
|
|||||
|
 | |
| |
| |
| |
| |
| |
|
Gene: SLC2A3 |
Gene summary for SLC2A3 |
| Gene information | Species | Human | Gene symbol | SLC2A3 | Gene ID | 6515 |
| Gene name | solute carrier family 2 member 3 | |
| Gene Alias | GLUT3 | |
| Cytomap | 12p13.31 | |
| Gene Type | protein-coding | GO ID | GO:0003008 | UniProtAcc | P11169 |
Top |
Malignant transformation analysis |
| Identification of the aberrant gene expression in precancerous and cancerous lesions by comparing the gene expression of stem-like cells in diseased tissues with normal stem cells |
| Entrez ID | Symbol | Replicates | Species | Organ | Tissue | Adj P-value | Log2FC | Malignancy |
| 6515 | SLC2A3 | HSIL_HPV_2 | Human | Cervix | HSIL_HPV | 2.99e-04 | -3.28e-01 | 0.0208 |
| 6515 | SLC2A3 | CCI_3 | Human | Cervix | CC | 3.95e-03 | -5.05e-01 | 0.516 |
| 6515 | SLC2A3 | CCII_1 | Human | Cervix | CC | 4.81e-09 | -5.36e-01 | 0.3249 |
| 6515 | SLC2A3 | Tumor | Human | Cervix | CC | 1.49e-25 | -5.23e-01 | 0.1241 |
| 6515 | SLC2A3 | sample1 | Human | Cervix | CC | 6.88e-05 | -5.18e-01 | 0.0959 |
| 6515 | SLC2A3 | sample3 | Human | Cervix | CC | 2.05e-24 | -5.32e-01 | 0.1387 |
| 6515 | SLC2A3 | H2 | Human | Cervix | HSIL_HPV | 3.06e-17 | -4.99e-01 | 0.0632 |
| 6515 | SLC2A3 | L1 | Human | Cervix | CC | 1.47e-03 | -3.98e-01 | 0.0802 |
| 6515 | SLC2A3 | T1 | Human | Cervix | CC | 7.10e-13 | -5.16e-01 | 0.0918 |
| 6515 | SLC2A3 | T3 | Human | Cervix | CC | 1.73e-22 | -5.26e-01 | 0.1389 |
| 6515 | SLC2A3 | LZE21D1 | Human | Esophagus | HGIN | 1.09e-18 | 1.84e-01 | 0.0632 |
| 6515 | SLC2A3 | LZE6T | Human | Esophagus | ESCC | 3.67e-06 | 1.01e+00 | 0.0845 |
| 6515 | SLC2A3 | P5T-E | Human | Esophagus | ESCC | 1.51e-41 | 1.44e+00 | 0.1327 |
| 6515 | SLC2A3 | P10T-E | Human | Esophagus | ESCC | 1.31e-35 | 1.35e+00 | 0.116 |
| 6515 | SLC2A3 | P12T-E | Human | Esophagus | ESCC | 3.67e-08 | 7.16e-01 | 0.1122 |
| 6515 | SLC2A3 | P22T-E | Human | Esophagus | ESCC | 5.62e-79 | 2.68e+00 | 0.1236 |
| 6515 | SLC2A3 | P26T-E | Human | Esophagus | ESCC | 3.35e-31 | 1.90e+00 | 0.1276 |
| 6515 | SLC2A3 | P28T-E | Human | Esophagus | ESCC | 7.58e-03 | -2.37e-01 | 0.1149 |
| 6515 | SLC2A3 | P31T-E | Human | Esophagus | ESCC | 1.80e-03 | -1.43e-01 | 0.1251 |
| 6515 | SLC2A3 | P38T-E | Human | Esophagus | ESCC | 1.15e-02 | -2.21e-01 | 0.127 |
| Page: 1 2 3 4 |
| Tissue | Expression Dynamics | Abbreviation |
| Cervix |  | CC: Cervix cancer |
| HSIL_HPV: HPV-infected high-grade squamous intraepithelial lesions | ||
| N_HPV: HPV-infected normal cervix | ||
| Esophagus | 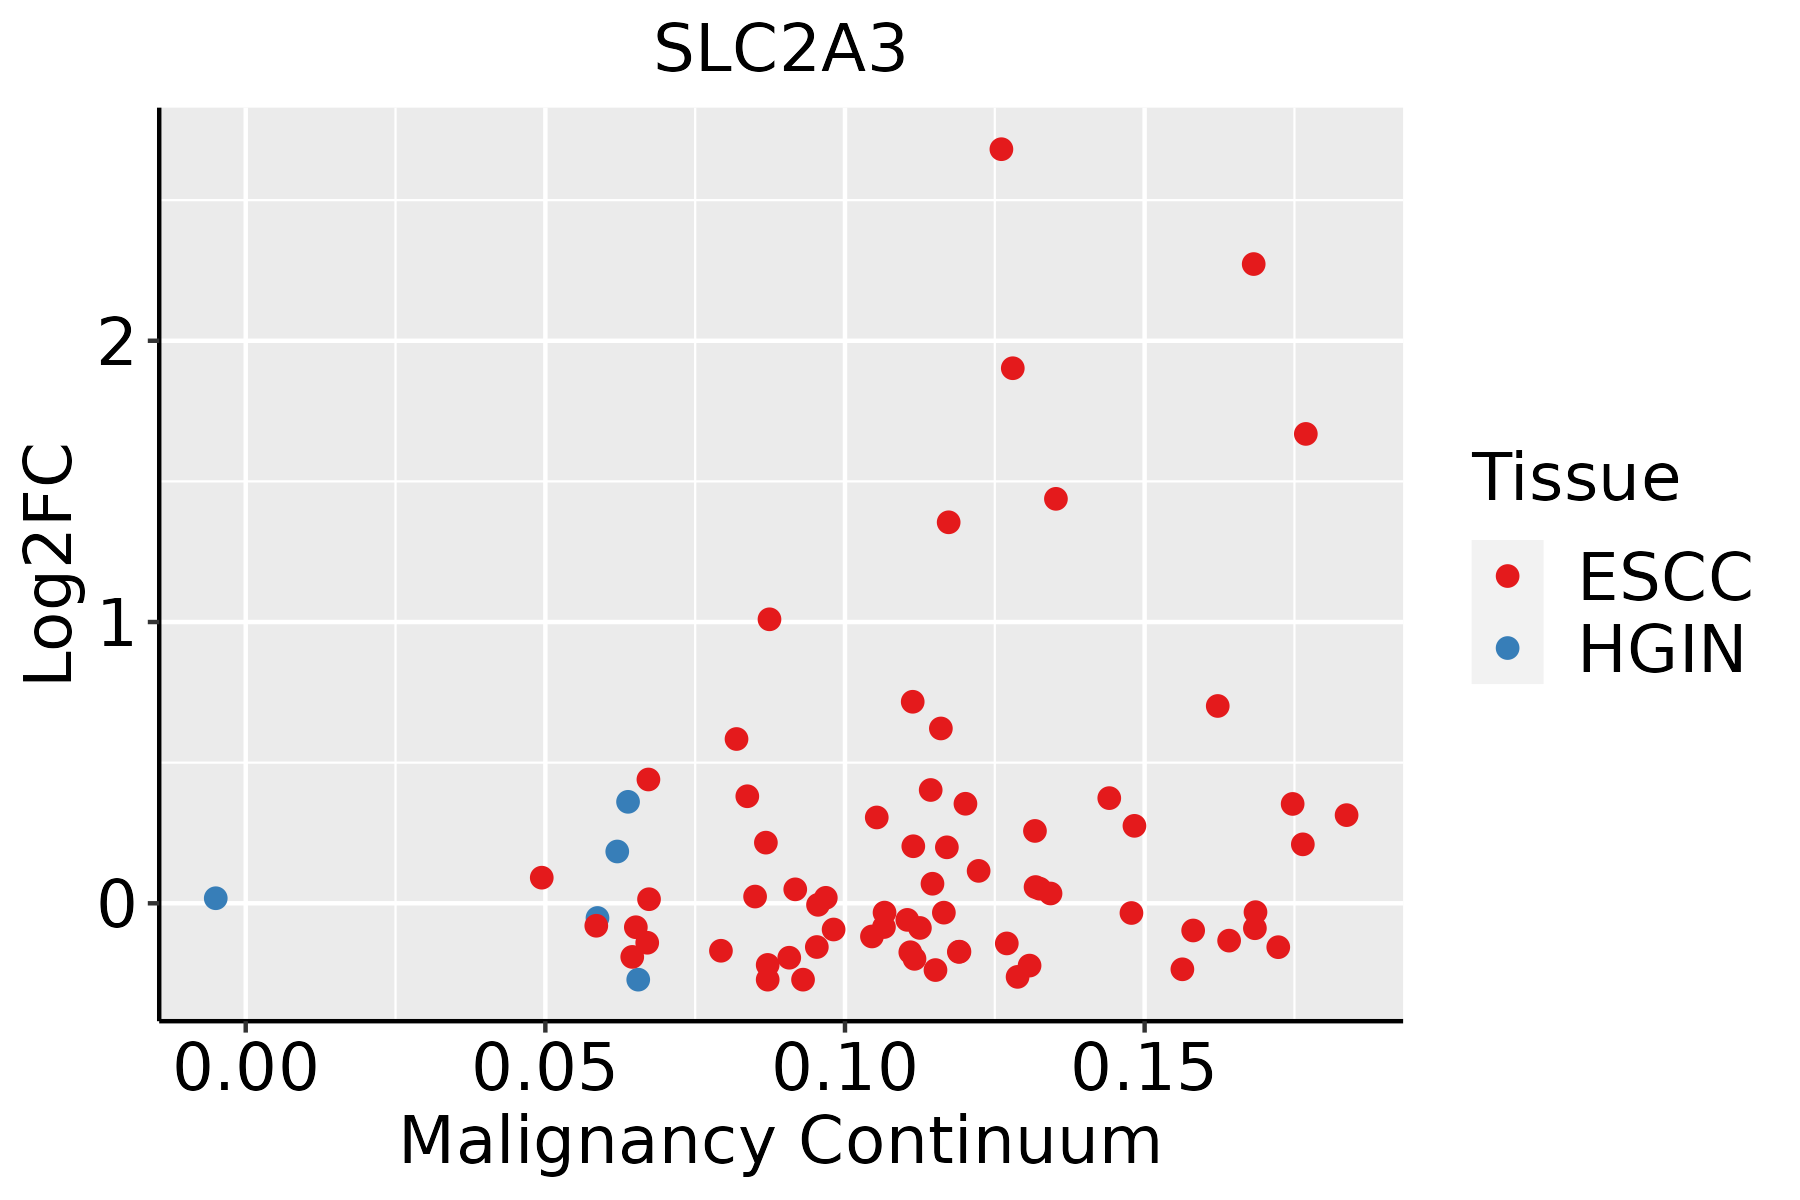 | ESCC: Esophageal squamous cell carcinoma |
| HGIN: High-grade intraepithelial neoplasias | ||
| LGIN: Low-grade intraepithelial neoplasias | ||
| Oral Cavity | 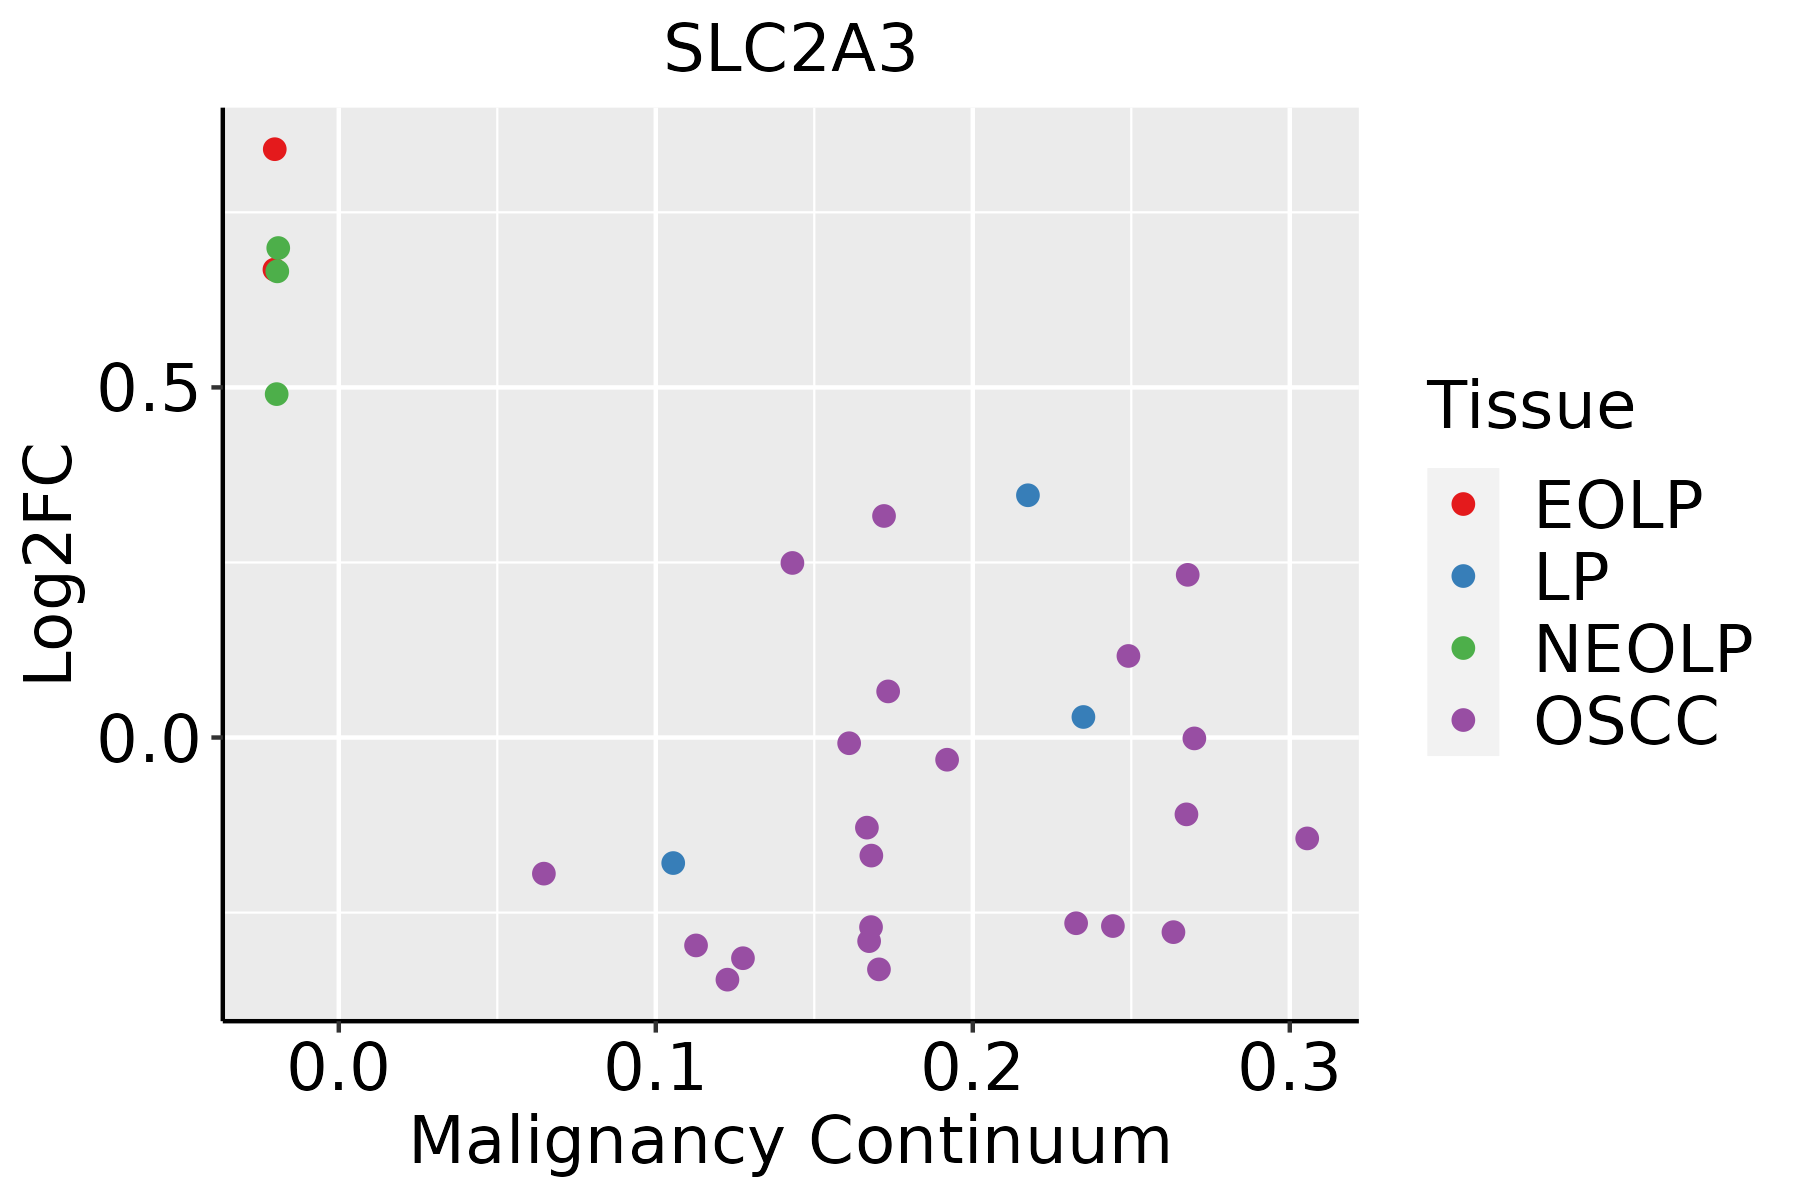 | EOLP: Erosive Oral lichen planus |
| LP: leukoplakia | ||
| NEOLP: Non-erosive oral lichen planus | ||
| OSCC: Oral squamous cell carcinoma | ||
| Prostate |  | BPH: Benign Prostatic Hyperplasia |
| Skin | 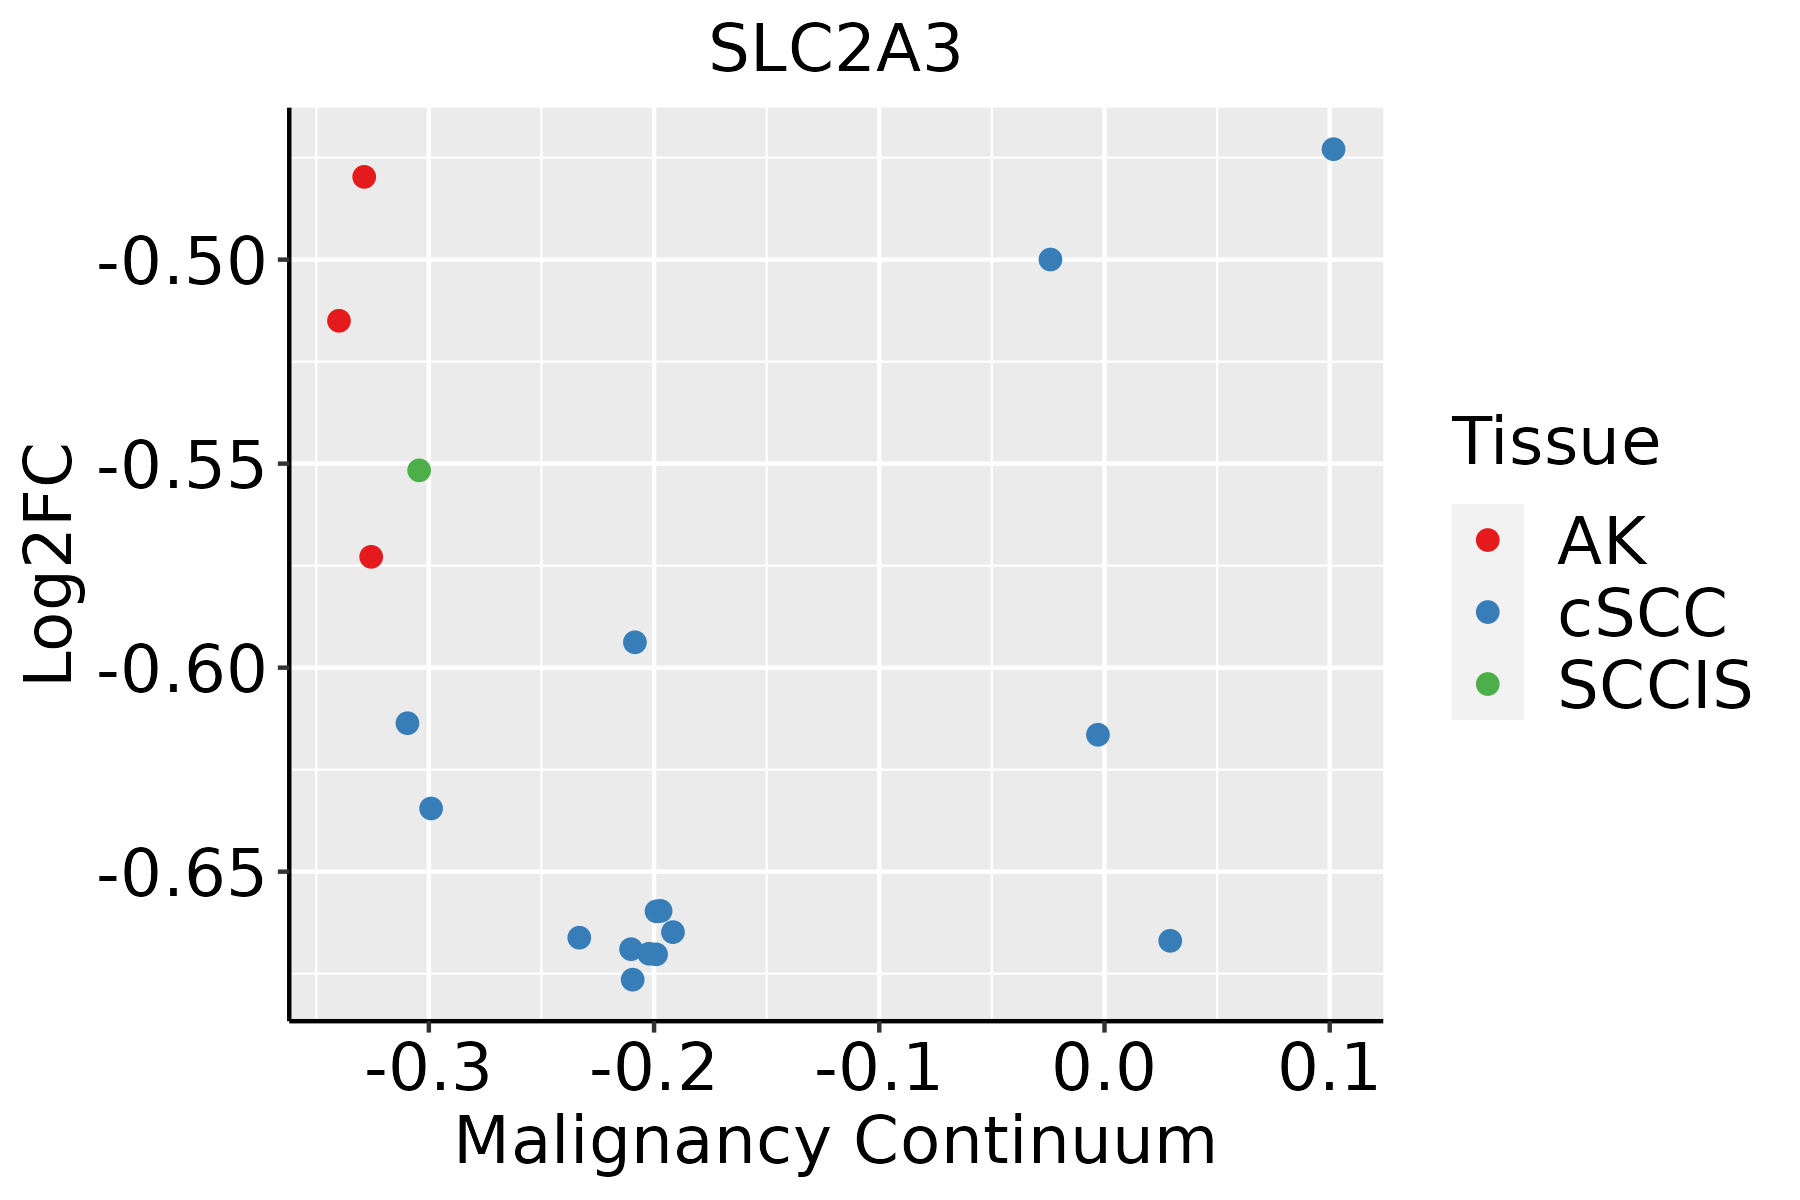 | AK: Actinic keratosis |
| cSCC: Cutaneous squamous cell carcinoma | ||
| SCCIS:squamous cell carcinoma in situ | ||
| Thyroid | 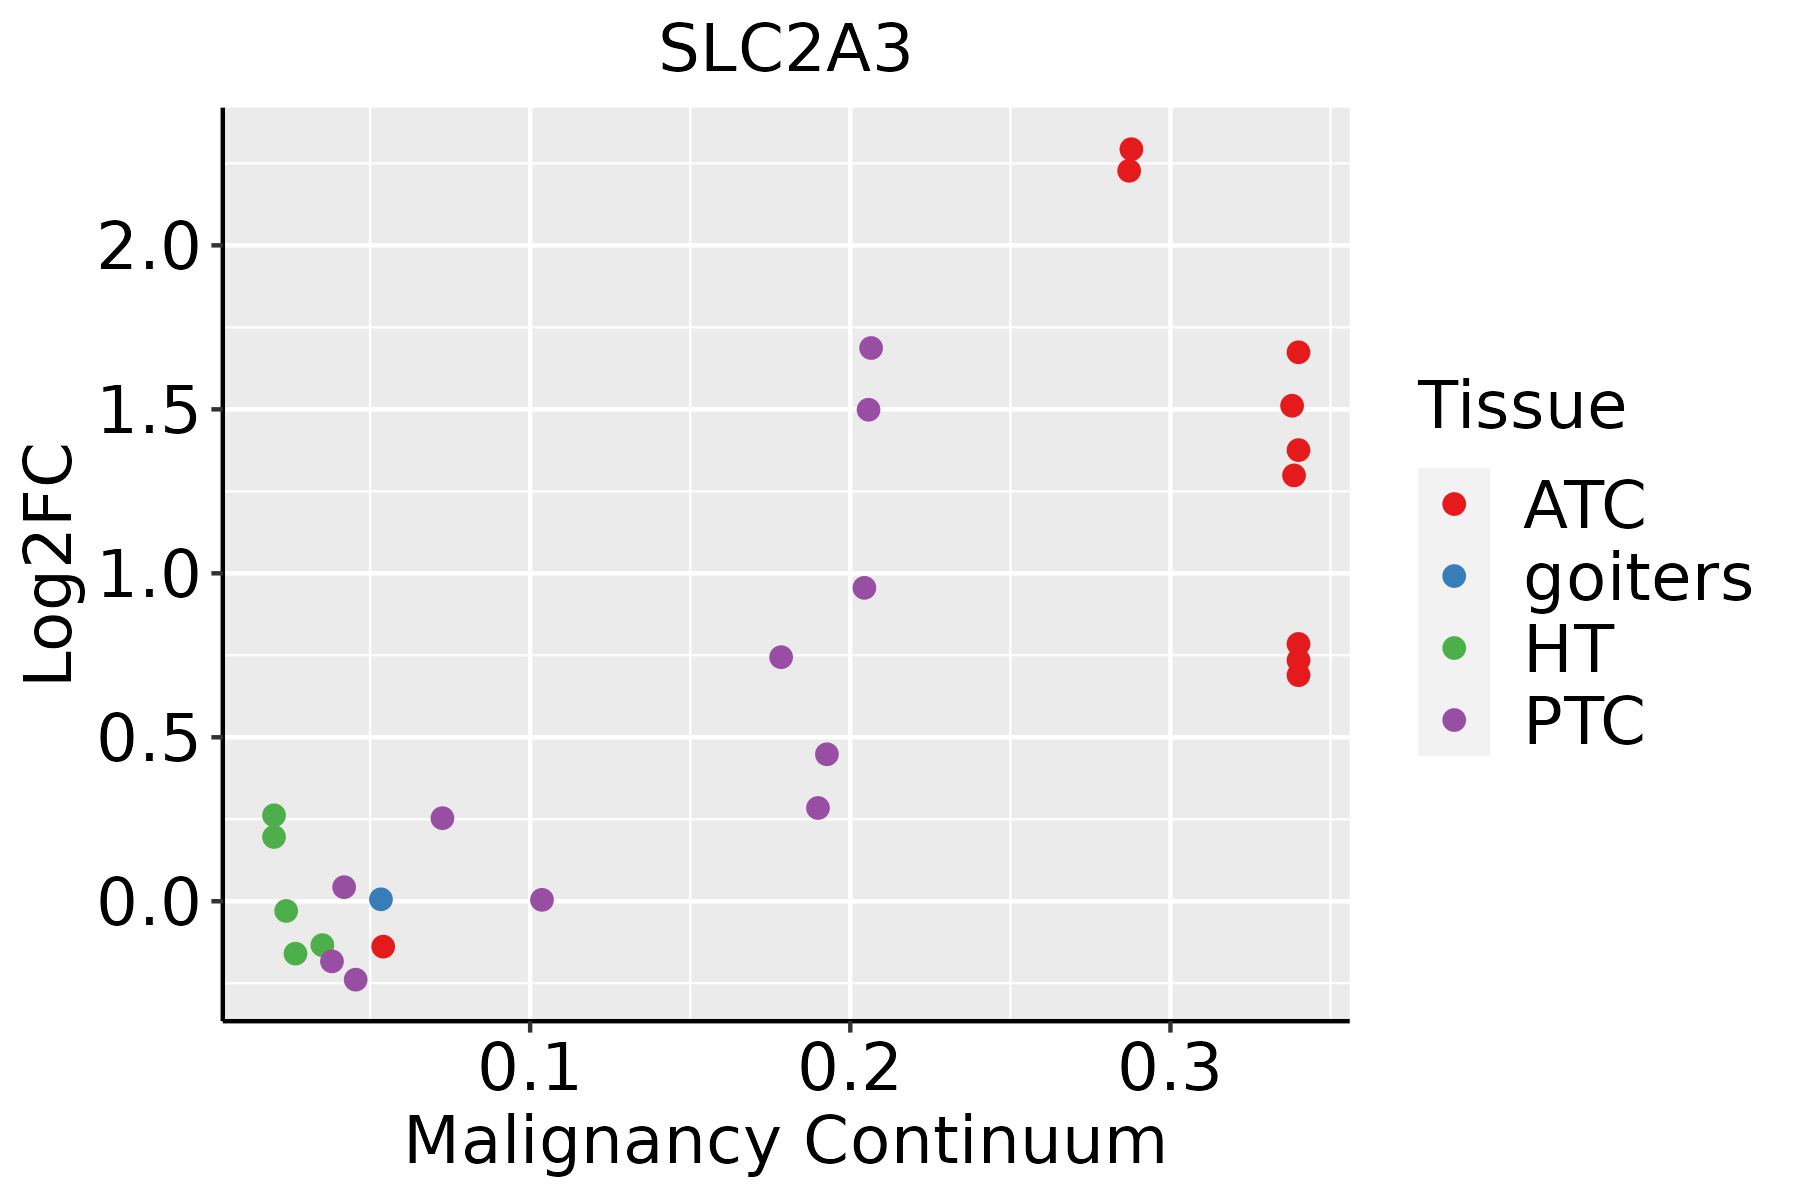 | ATC: Anaplastic thyroid cancer |
| HT: Hashimoto's thyroiditis | ||
| PTC: Papillary thyroid cancer |
| ∗log2FC in expression of this searched gene in stem-like cells from each diseased tissue sample relative to stem-like cells in normal samples in each tissue plotted against the malignancy continuum. Samples are colored based on if they are from different disease stage. |
Top |
Malignant transformation related pathway analysis |
| Find out the enriched GO biological processes and KEGG pathways involved in transition from healthy to precancer to cancer |
| Tissue | Disease Stage | Enriched GO biological Processes |
| Colorectum | AD |  |
| Colorectum | SER |  |
| Colorectum | MSS |  |
| Colorectum | MSI-H |  |
| Colorectum | FAP |  |
| ∗Top 15 enriched GO BP terms are showed in the bar plot of each disease state in each tissue. Each row represents a significant GO biological process which is colored according to the -log10(p.adjust). |
| Page: 1 2 3 4 5 6 7 8 9 |
| GO ID | Tissue | Disease Stage | Description | Gene Ratio | Bg Ratio | pvalue | p.adjust | Count |
| GO:00059969 | Esophagus | ESCC | monosaccharide metabolic process | 159/8552 | 257/18723 | 1.11e-07 | 1.81e-06 | 159 |
| GO:00067671 | Esophagus | ESCC | water-soluble vitamin metabolic process | 41/8552 | 59/18723 | 1.84e-04 | 1.17e-03 | 41 |
| GO:00067661 | Esophagus | ESCC | vitamin metabolic process | 67/8552 | 106/18723 | 2.03e-04 | 1.28e-03 | 67 |
| GO:00059968 | Oral cavity | OSCC | monosaccharide metabolic process | 129/7305 | 257/18723 | 1.63e-04 | 1.13e-03 | 129 |
| GO:00059967 | Prostate | Tumor | monosaccharide metabolic process | 62/3246 | 257/18723 | 3.38e-03 | 1.75e-02 | 62 |
| GO:00030183 | Prostate | Tumor | vascular process in circulatory system | 61/3246 | 263/18723 | 8.88e-03 | 3.84e-02 | 61 |
| GO:000599610 | Skin | cSCC | monosaccharide metabolic process | 85/4864 | 257/18723 | 6.43e-03 | 3.14e-02 | 85 |
| GO:00067672 | Skin | cSCC | water-soluble vitamin metabolic process | 24/4864 | 59/18723 | 9.59e-03 | 4.30e-02 | 24 |
| GO:000599614 | Thyroid | PTC | monosaccharide metabolic process | 115/5968 | 257/18723 | 9.36e-06 | 1.05e-04 | 115 |
| GO:000599615 | Thyroid | ATC | monosaccharide metabolic process | 118/6293 | 257/18723 | 2.56e-05 | 2.20e-04 | 118 |
| Page: 1 |
| Pathway ID | Tissue | Disease Stage | Description | Gene Ratio | Bg Ratio | pvalue | p.adjust | qvalue | Count |
| Page: 1 |
Top |
Cell-cell communication analysis |
| Identification of potential cell-cell interactions between two cell types and their ligand-receptor pairs for different disease states |
| Ligand | Receptor | LRpair | Pathway | Tissue | Disease Stage |
| Page: 1 |
Top |
Single-cell gene regulatory network inference analysis |
| Find out the significant the regulons (TFs) and the target genes of each regulon across cell types for different disease states |
| TF | Cell Type | Tissue | Disease Stage | Target Gene | RSS | Regulon Activity |
| ∗The dot plots of a searched regulon are shown for all cell subpopulations in each disease state of each tissue based on the regulon specific score inferred using pySCENIC and by calculating the average expression. |
| Page: 1 |
Top |
Somatic mutation of malignant transformation related genes |
| Annotation of somatic variants for genes involved in malignant transformation |
| Hugo Symbol | Variant Class | Variant Classification | dbSNP RS | HGVSc | HGVSp | HGVSp Short | SWISSPROT | BIOTYPE | SIFT | PolyPhen | Tumor Sample Barcode | Tissue | Histology | Sex | Age | Stage | Therapy Types | Drugs | Outcome |
| SLC2A3 | SNV | Missense_Mutation | novel | c.1457N>C | p.Ile486Thr | p.I486T | P11169 | protein_coding | tolerated(0.1) | benign(0.001) | TCGA-AN-A046-01 | Breast | breast invasive carcinoma | Female | >=65 | I/II | Unknown | Unknown | SD |
| SLC2A3 | SNV | Missense_Mutation | c.637C>G | p.Leu213Val | p.L213V | P11169 | protein_coding | deleterious(0) | probably_damaging(0.941) | TCGA-AR-A1AV-01 | Breast | breast invasive carcinoma | Male | >=65 | I/II | Chemotherapy | cytoxan | SD | |
| SLC2A3 | SNV | Missense_Mutation | novel | c.1067N>G | p.Lys356Arg | p.K356R | P11169 | protein_coding | tolerated(0.41) | benign(0.405) | TCGA-B6-A0RE-01 | Breast | breast invasive carcinoma | Female | <65 | I/II | Unknown | Unknown | SD |
| SLC2A3 | SNV | Missense_Mutation | c.956N>T | p.Thr319Ile | p.T319I | P11169 | protein_coding | deleterious(0) | probably_damaging(1) | TCGA-BH-A1FN-01 | Breast | breast invasive carcinoma | Female | <65 | I/II | Unknown | Unknown | PD | |
| SLC2A3 | deletion | Frame_Shift_Del | novel | c.758delN | p.Lys253SerfsTer6 | p.K253Sfs*6 | P11169 | protein_coding | TCGA-EW-A2FV-01 | Breast | breast invasive carcinoma | Female | <65 | III/IV | Chemotherapy | docetaxel | SD | ||
| SLC2A3 | deletion | Frame_Shift_Del | novel | c.741_772delNNNNNNNNNNNNNNNNNNNNNNNNNNNNNNNN | p.Met249AlafsTer3 | p.M249Afs*3 | P11169 | protein_coding | TCGA-HN-A2NL-01 | Breast | breast invasive carcinoma | Female | <65 | I/II | Chemotherapy | cyclophosphamide | SD | ||
| SLC2A3 | SNV | Missense_Mutation | rs200481428 | c.683N>A | p.Arg228Gln | p.R228Q | P11169 | protein_coding | tolerated(0.14) | benign(0.081) | TCGA-2W-A8YY-01 | Cervix | cervical & endocervical cancer | Female | <65 | I/II | Chemotherapy | cisplatin | CR |
| SLC2A3 | SNV | Missense_Mutation | c.164N>G | p.Ser55Cys | p.S55C | P11169 | protein_coding | deleterious(0) | possibly_damaging(0.841) | TCGA-DR-A0ZM-01 | Cervix | cervical & endocervical cancer | Female | <65 | III/IV | Unspecific | Cisplatin | SD | |
| SLC2A3 | SNV | Missense_Mutation | c.122N>G | p.Phe41Cys | p.F41C | P11169 | protein_coding | deleterious(0.01) | probably_damaging(0.986) | TCGA-A6-6141-01 | Colorectum | colon adenocarcinoma | Male | <65 | I/II | Chemotherapy | 5-fu | SD | |
| SLC2A3 | SNV | Missense_Mutation | c.730N>T | p.Asp244Tyr | p.D244Y | P11169 | protein_coding | deleterious(0) | probably_damaging(0.964) | TCGA-AA-3984-01 | Colorectum | colon adenocarcinoma | Female | <65 | I/II | Unknown | Unknown | SD |
| Page: 1 2 3 4 5 6 7 8 |
Top |
Related drugs of malignant transformation related genes |
| Identification of chemicals and drugs interact with genes involved in malignant transfromation |
| (DGIdb 4.0) |
| Entrez ID | Symbol | Category | Interaction Types | Drug Claim Name | Drug Name | PMIDs |
| 6515 | SLC2A3 | DRUGGABLE GENOME, TRANSPORTER | RESVERATROL | RESVERATROL | 11277764 | |
| 6515 | SLC2A3 | DRUGGABLE GENOME, TRANSPORTER | 178101360 | |||
| 6515 | SLC2A3 | DRUGGABLE GENOME, TRANSPORTER | CYTOKINES | 15727913 | ||
| 6515 | SLC2A3 | DRUGGABLE GENOME, TRANSPORTER | INSULIN | INSULIN | 12814351 | |
| 6515 | SLC2A3 | DRUGGABLE GENOME, TRANSPORTER | GLUFOSFAMIDE | GLUFOSFAMIDE |
| Page: 1 |

Copyright 2023-Present -The University of Texas Health Science Center at Houston |