
|
|||||
|
 | |
| |
| |
| |
| |
| |
|
Gene: SLC2A13 |
Gene summary for SLC2A13 |
| Gene information | Species | Human | Gene symbol | SLC2A13 | Gene ID | 114134 |
| Gene name | solute carrier family 2 member 13 | |
| Gene Alias | HMIT | |
| Cytomap | 12q12 | |
| Gene Type | protein-coding | GO ID | GO:0003008 | UniProtAcc | Q96QE2 |
Top |
Malignant transformation analysis |
| Identification of the aberrant gene expression in precancerous and cancerous lesions by comparing the gene expression of stem-like cells in diseased tissues with normal stem cells |
| Entrez ID | Symbol | Replicates | Species | Organ | Tissue | Adj P-value | Log2FC | Malignancy |
| 114134 | SLC2A13 | HTA11_3410_2000001011 | Human | Colorectum | AD | 6.98e-36 | -9.98e-01 | 0.0155 |
| 114134 | SLC2A13 | HTA11_2487_2000001011 | Human | Colorectum | SER | 1.55e-11 | -7.06e-01 | -0.1808 |
| 114134 | SLC2A13 | HTA11_2951_2000001011 | Human | Colorectum | AD | 1.73e-08 | -1.09e+00 | 0.0216 |
| 114134 | SLC2A13 | HTA11_1938_2000001011 | Human | Colorectum | AD | 4.65e-05 | -6.54e-01 | -0.0811 |
| 114134 | SLC2A13 | HTA11_78_2000001011 | Human | Colorectum | AD | 1.25e-11 | -7.00e-01 | -0.1088 |
| 114134 | SLC2A13 | HTA11_3361_2000001011 | Human | Colorectum | AD | 2.21e-08 | -7.76e-01 | -0.1207 |
| 114134 | SLC2A13 | HTA11_83_2000001011 | Human | Colorectum | SER | 4.92e-07 | -7.51e-01 | -0.1526 |
| 114134 | SLC2A13 | HTA11_696_2000001011 | Human | Colorectum | AD | 4.26e-30 | -7.66e-01 | -0.1464 |
| 114134 | SLC2A13 | HTA11_866_2000001011 | Human | Colorectum | AD | 2.42e-24 | -6.87e-01 | -0.1001 |
| 114134 | SLC2A13 | HTA11_1391_2000001011 | Human | Colorectum | AD | 1.54e-10 | -7.19e-01 | -0.059 |
| 114134 | SLC2A13 | HTA11_2992_2000001011 | Human | Colorectum | SER | 2.32e-03 | -7.29e-01 | -0.1706 |
| 114134 | SLC2A13 | HTA11_5212_2000001011 | Human | Colorectum | AD | 2.13e-04 | -8.70e-01 | -0.2061 |
| 114134 | SLC2A13 | HTA11_5216_2000001011 | Human | Colorectum | SER | 1.13e-03 | -9.23e-01 | -0.1462 |
| 114134 | SLC2A13 | HTA11_546_2000001011 | Human | Colorectum | AD | 1.16e-04 | -7.53e-01 | -0.0842 |
| 114134 | SLC2A13 | HTA11_9341_2000001011 | Human | Colorectum | SER | 5.41e-03 | -9.95e-01 | -0.00410000000000005 |
| 114134 | SLC2A13 | HTA11_7862_2000001011 | Human | Colorectum | AD | 1.43e-09 | -9.63e-01 | -0.0179 |
| 114134 | SLC2A13 | HTA11_866_3004761011 | Human | Colorectum | AD | 2.86e-29 | -9.85e-01 | 0.096 |
| 114134 | SLC2A13 | HTA11_4255_2000001011 | Human | Colorectum | SER | 2.88e-04 | -8.93e-01 | 0.0446 |
| 114134 | SLC2A13 | HTA11_9408_2000001011 | Human | Colorectum | AD | 3.00e-03 | -9.63e-01 | 0.0451 |
| 114134 | SLC2A13 | HTA11_8622_2000001021 | Human | Colorectum | SER | 1.72e-07 | -9.23e-01 | 0.0528 |
| Page: 1 2 3 4 5 |
| Tissue | Expression Dynamics | Abbreviation |
| Colorectum (GSE201348) |  | FAP: Familial adenomatous polyposis |
| CRC: Colorectal cancer | ||
| Colorectum (HTA11) |  | AD: Adenomas |
| SER: Sessile serrated lesions | ||
| MSI-H: Microsatellite-high colorectal cancer | ||
| MSS: Microsatellite stable colorectal cancer | ||
| Liver |  | HCC: Hepatocellular carcinoma |
| NAFLD: Non-alcoholic fatty liver disease | ||
| Lung | 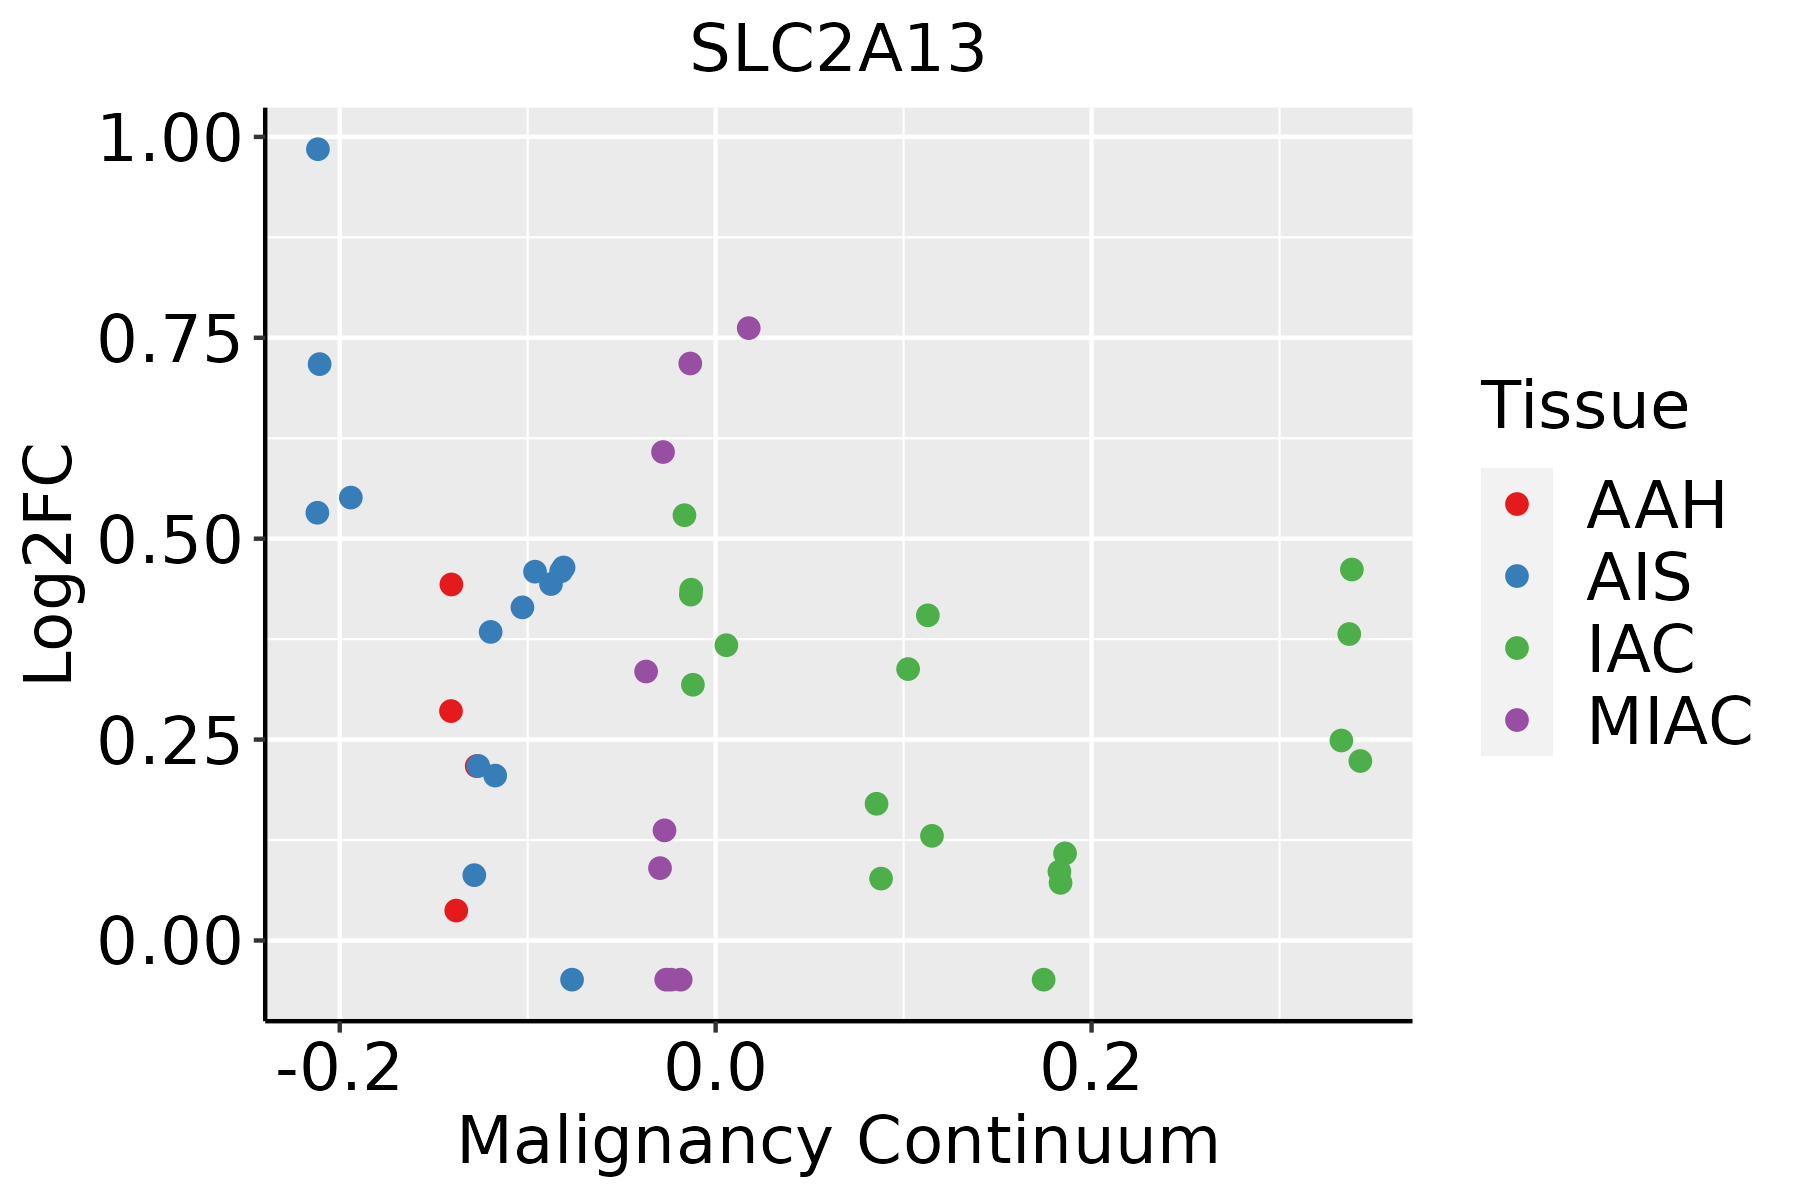 | AAH: Atypical adenomatous hyperplasia |
| AIS: Adenocarcinoma in situ | ||
| IAC: Invasive lung adenocarcinoma | ||
| MIA: Minimally invasive adenocarcinoma |
| ∗log2FC in expression of this searched gene in stem-like cells from each diseased tissue sample relative to stem-like cells in normal samples in each tissue plotted against the malignancy continuum. Samples are colored based on if they are from different disease stage. |
Top |
Malignant transformation related pathway analysis |
| Find out the enriched GO biological processes and KEGG pathways involved in transition from healthy to precancer to cancer |
| Tissue | Disease Stage | Enriched GO biological Processes |
| Colorectum | AD |  |
| Colorectum | SER |  |
| Colorectum | MSS |  |
| Colorectum | MSI-H |  |
| Colorectum | FAP |  |
| ∗Top 15 enriched GO BP terms are showed in the bar plot of each disease state in each tissue. Each row represents a significant GO biological process which is colored according to the -log10(p.adjust). |
| Page: 1 2 3 4 5 6 7 8 9 |
| GO ID | Tissue | Disease Stage | Description | Gene Ratio | Bg Ratio | pvalue | p.adjust | Count |
| GO:0034250 | Colorectum | AD | positive regulation of cellular amide metabolic process | 53/3918 | 162/18723 | 2.98e-04 | 3.60e-03 | 53 |
| GO:00342501 | Colorectum | SER | positive regulation of cellular amide metabolic process | 41/2897 | 162/18723 | 7.67e-04 | 9.79e-03 | 41 |
| GO:00342502 | Colorectum | MSS | positive regulation of cellular amide metabolic process | 51/3467 | 162/18723 | 4.70e-05 | 8.60e-04 | 51 |
| GO:0150104 | Colorectum | MSS | transport across blood-brain barrier | 28/3467 | 87/18723 | 1.54e-03 | 1.41e-02 | 28 |
| GO:0010232 | Colorectum | MSS | vascular transport | 28/3467 | 88/18723 | 1.87e-03 | 1.64e-02 | 28 |
| GO:0050435 | Colorectum | MSS | amyloid-beta metabolic process | 21/3467 | 67/18723 | 7.90e-03 | 4.84e-02 | 21 |
| GO:01501041 | Colorectum | FAP | transport across blood-brain barrier | 25/2622 | 87/18723 | 2.63e-04 | 3.59e-03 | 25 |
| GO:00102321 | Colorectum | FAP | vascular transport | 25/2622 | 88/18723 | 3.19e-04 | 4.12e-03 | 25 |
| GO:00342504 | Colorectum | FAP | positive regulation of cellular amide metabolic process | 39/2622 | 162/18723 | 4.02e-04 | 4.86e-03 | 39 |
| GO:0003018 | Colorectum | FAP | vascular process in circulatory system | 56/2622 | 263/18723 | 7.67e-04 | 8.12e-03 | 56 |
| GO:00030181 | Colorectum | CRC | vascular process in circulatory system | 45/2078 | 263/18723 | 2.10e-03 | 2.08e-02 | 45 |
| GO:01501042 | Colorectum | CRC | transport across blood-brain barrier | 18/2078 | 87/18723 | 6.50e-03 | 4.69e-02 | 18 |
| GO:0015850 | Liver | NAFLD | organic hydroxy compound transport | 50/1882 | 284/18723 | 6.01e-05 | 1.32e-03 | 50 |
| GO:00030182 | Liver | NAFLD | vascular process in circulatory system | 46/1882 | 263/18723 | 1.36e-04 | 2.58e-03 | 46 |
| GO:01501043 | Liver | NAFLD | transport across blood-brain barrier | 17/1882 | 87/18723 | 5.46e-03 | 4.20e-02 | 17 |
| GO:00342507 | Liver | NAFLD | positive regulation of cellular amide metabolic process | 27/1882 | 162/18723 | 5.95e-03 | 4.48e-02 | 27 |
| GO:00102322 | Liver | NAFLD | vascular transport | 17/1882 | 88/18723 | 6.15e-03 | 4.61e-02 | 17 |
| GO:003425022 | Liver | HCC | positive regulation of cellular amide metabolic process | 110/7958 | 162/18723 | 5.14e-11 | 1.92e-09 | 110 |
| GO:015010411 | Liver | HCC | transport across blood-brain barrier | 50/7958 | 87/18723 | 3.42e-03 | 1.55e-02 | 50 |
| GO:001023211 | Liver | HCC | vascular transport | 50/7958 | 88/18723 | 4.69e-03 | 2.02e-02 | 50 |
| Page: 1 2 |
| Pathway ID | Tissue | Disease Stage | Description | Gene Ratio | Bg Ratio | pvalue | p.adjust | qvalue | Count |
| Page: 1 |
Top |
Cell-cell communication analysis |
| Identification of potential cell-cell interactions between two cell types and their ligand-receptor pairs for different disease states |
| Ligand | Receptor | LRpair | Pathway | Tissue | Disease Stage |
| Page: 1 |
Top |
Single-cell gene regulatory network inference analysis |
| Find out the significant the regulons (TFs) and the target genes of each regulon across cell types for different disease states |
| TF | Cell Type | Tissue | Disease Stage | Target Gene | RSS | Regulon Activity |
| ∗The dot plots of a searched regulon are shown for all cell subpopulations in each disease state of each tissue based on the regulon specific score inferred using pySCENIC and by calculating the average expression. |
| Page: 1 |
Top |
Somatic mutation of malignant transformation related genes |
| Annotation of somatic variants for genes involved in malignant transformation |
| Hugo Symbol | Variant Class | Variant Classification | dbSNP RS | HGVSc | HGVSp | HGVSp Short | SWISSPROT | BIOTYPE | SIFT | PolyPhen | Tumor Sample Barcode | Tissue | Histology | Sex | Age | Stage | Therapy Types | Drugs | Outcome |
| SLC2A13 | SNV | Missense_Mutation | c.781G>C | p.Glu261Gln | p.E261Q | Q96QE2 | protein_coding | deleterious(0) | probably_damaging(1) | TCGA-A2-A04U-01 | Breast | breast invasive carcinoma | Female | <65 | I/II | Chemotherapy | adriamycin | SD | |
| SLC2A13 | SNV | Missense_Mutation | c.1078G>A | p.Asp360Asn | p.D360N | Q96QE2 | protein_coding | tolerated(0.18) | benign(0.01) | TCGA-E2-A10C-01 | Breast | breast invasive carcinoma | Female | <65 | I/II | Chemotherapy | cytoxan | SD | |
| SLC2A13 | SNV | Missense_Mutation | novel | c.1125C>G | p.Phe375Leu | p.F375L | Q96QE2 | protein_coding | deleterious(0) | benign(0.348) | TCGA-C5-A8XJ-01 | Cervix | cervical & endocervical cancer | Female | >=65 | I/II | Chemotherapy | cisplatin | SD |
| SLC2A13 | SNV | Missense_Mutation | c.1141N>A | p.Gly381Arg | p.G381R | Q96QE2 | protein_coding | deleterious(0) | probably_damaging(0.963) | TCGA-A6-5661-01 | Colorectum | colon adenocarcinoma | Female | >=65 | I/II | Unknown | Unknown | SD | |
| SLC2A13 | SNV | Missense_Mutation | c.1440N>T | p.Trp480Cys | p.W480C | Q96QE2 | protein_coding | tolerated(0.08) | benign(0.023) | TCGA-A6-6653-01 | Colorectum | colon adenocarcinoma | Male | >=65 | I/II | Unknown | Unknown | SD | |
| SLC2A13 | SNV | Missense_Mutation | c.1605A>G | p.Ile535Met | p.I535M | Q96QE2 | protein_coding | deleterious(0.02) | probably_damaging(0.98) | TCGA-AA-3492-01 | Colorectum | colon adenocarcinoma | Female | >=65 | I/II | Unknown | Unknown | SD | |
| SLC2A13 | SNV | Missense_Mutation | c.1679N>T | p.Ser560Leu | p.S560L | Q96QE2 | protein_coding | deleterious(0) | possibly_damaging(0.887) | TCGA-AA-3510-01 | Colorectum | colon adenocarcinoma | Male | >=65 | I/II | Unknown | Unknown | SD | |
| SLC2A13 | SNV | Missense_Mutation | c.847N>T | p.Arg283Cys | p.R283C | Q96QE2 | protein_coding | deleterious(0) | probably_damaging(0.978) | TCGA-AA-3811-01 | Colorectum | colon adenocarcinoma | Female | >=65 | III/IV | Unknown | Unknown | PD | |
| SLC2A13 | SNV | Missense_Mutation | novel | c.1180N>G | p.Thr394Ala | p.T394A | Q96QE2 | protein_coding | tolerated(0.12) | benign(0.015) | TCGA-AA-3984-01 | Colorectum | colon adenocarcinoma | Female | <65 | I/II | Unknown | Unknown | SD |
| SLC2A13 | SNV | Missense_Mutation | c.1187N>A | p.Gly396Asp | p.G396D | Q96QE2 | protein_coding | tolerated(0.06) | possibly_damaging(0.88) | TCGA-AA-A01T-01 | Colorectum | colon adenocarcinoma | Female | <65 | III/IV | Chemotherapy | 5-fluorouracil | CR |
| Page: 1 2 3 4 5 6 7 |
Top |
Related drugs of malignant transformation related genes |
| Identification of chemicals and drugs interact with genes involved in malignant transfromation |
| (DGIdb 4.0) |
| Entrez ID | Symbol | Category | Interaction Types | Drug Claim Name | Drug Name | PMIDs |
| Page: 1 |

Copyright 2023-Present -The University of Texas Health Science Center at Houston |