
|
|||||
|
 | |
| |
| |
| |
| |
| |
|
Gene: SLC2A10 |
Gene summary for SLC2A10 |
| Gene information | Species | Human | Gene symbol | SLC2A10 | Gene ID | 81031 |
| Gene name | solute carrier family 2 member 10 | |
| Gene Alias | ATORS | |
| Cytomap | 20q13.12 | |
| Gene Type | protein-coding | GO ID | GO:0001501 | UniProtAcc | O95528 |
Top |
Malignant transformation analysis |
| Identification of the aberrant gene expression in precancerous and cancerous lesions by comparing the gene expression of stem-like cells in diseased tissues with normal stem cells |
| Entrez ID | Symbol | Replicates | Species | Organ | Tissue | Adj P-value | Log2FC | Malignancy |
| 81031 | SLC2A10 | LZE5T | Human | Esophagus | ESCC | 1.92e-04 | 5.32e-01 | 0.0514 |
| 81031 | SLC2A10 | LZE24T | Human | Esophagus | ESCC | 2.82e-07 | 7.54e-02 | 0.0596 |
| 81031 | SLC2A10 | P1T-E | Human | Esophagus | ESCC | 1.39e-02 | 1.51e-01 | 0.0875 |
| 81031 | SLC2A10 | P2T-E | Human | Esophagus | ESCC | 1.02e-07 | 2.23e-02 | 0.1177 |
| 81031 | SLC2A10 | P4T-E | Human | Esophagus | ESCC | 3.15e-07 | 9.02e-02 | 0.1323 |
| 81031 | SLC2A10 | P8T-E | Human | Esophagus | ESCC | 2.92e-31 | 5.39e-01 | 0.0889 |
| 81031 | SLC2A10 | P10T-E | Human | Esophagus | ESCC | 4.17e-10 | 1.18e-01 | 0.116 |
| 81031 | SLC2A10 | P12T-E | Human | Esophagus | ESCC | 7.39e-07 | 5.32e-02 | 0.1122 |
| 81031 | SLC2A10 | P15T-E | Human | Esophagus | ESCC | 3.14e-02 | 2.22e-02 | 0.1149 |
| 81031 | SLC2A10 | P16T-E | Human | Esophagus | ESCC | 1.16e-07 | 5.74e-02 | 0.1153 |
| 81031 | SLC2A10 | P26T-E | Human | Esophagus | ESCC | 3.49e-05 | 1.12e-01 | 0.1276 |
| 81031 | SLC2A10 | P27T-E | Human | Esophagus | ESCC | 3.54e-02 | 2.84e-03 | 0.1055 |
| 81031 | SLC2A10 | P39T-E | Human | Esophagus | ESCC | 1.00e-07 | 5.59e-02 | 0.0894 |
| 81031 | SLC2A10 | P44T-E | Human | Esophagus | ESCC | 8.62e-03 | 8.57e-02 | 0.1096 |
| 81031 | SLC2A10 | P48T-E | Human | Esophagus | ESCC | 3.31e-03 | -5.31e-03 | 0.0959 |
| 81031 | SLC2A10 | P54T-E | Human | Esophagus | ESCC | 2.15e-14 | 4.31e-01 | 0.0975 |
| 81031 | SLC2A10 | P57T-E | Human | Esophagus | ESCC | 3.81e-07 | 1.19e-01 | 0.0926 |
| 81031 | SLC2A10 | P61T-E | Human | Esophagus | ESCC | 2.56e-05 | 1.91e-01 | 0.099 |
| 81031 | SLC2A10 | P62T-E | Human | Esophagus | ESCC | 3.30e-07 | 6.66e-02 | 0.1302 |
| 81031 | SLC2A10 | P65T-E | Human | Esophagus | ESCC | 4.12e-11 | 2.34e-01 | 0.0978 |
| Page: 1 2 |
| Tissue | Expression Dynamics | Abbreviation |
| Esophagus |  | ESCC: Esophageal squamous cell carcinoma |
| HGIN: High-grade intraepithelial neoplasias | ||
| LGIN: Low-grade intraepithelial neoplasias | ||
| Prostate | 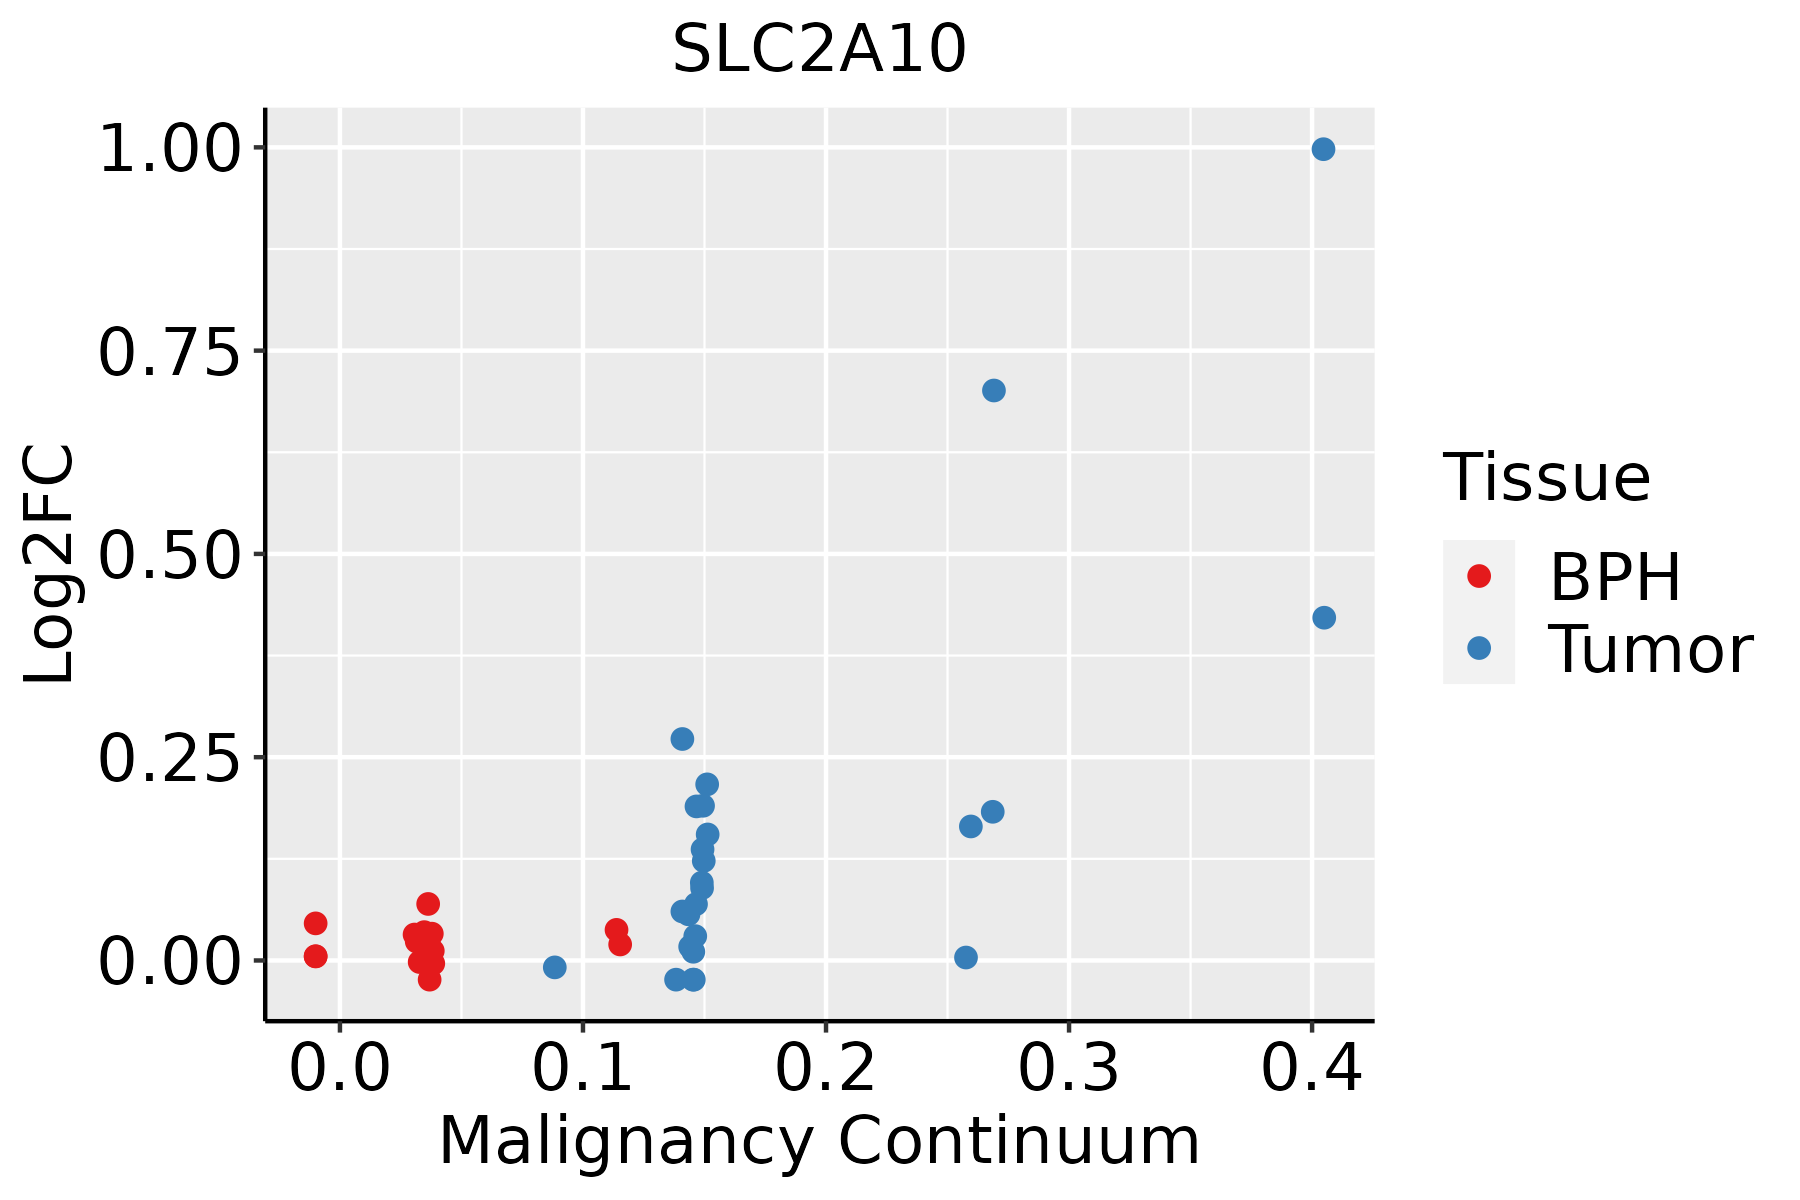 | BPH: Benign Prostatic Hyperplasia |
| ∗log2FC in expression of this searched gene in stem-like cells from each diseased tissue sample relative to stem-like cells in normal samples in each tissue plotted against the malignancy continuum. Samples are colored based on if they are from different disease stage. |
Top |
Malignant transformation related pathway analysis |
| Find out the enriched GO biological processes and KEGG pathways involved in transition from healthy to precancer to cancer |
| Tissue | Disease Stage | Enriched GO biological Processes |
| Colorectum | AD |  |
| Colorectum | SER |  |
| Colorectum | MSS |  |
| Colorectum | MSI-H |  |
| Colorectum | FAP |  |
| ∗Top 15 enriched GO BP terms are showed in the bar plot of each disease state in each tissue. Each row represents a significant GO biological process which is colored according to the -log10(p.adjust). |
| Page: 1 2 3 4 5 6 7 8 9 |
| GO ID | Tissue | Disease Stage | Description | Gene Ratio | Bg Ratio | pvalue | p.adjust | Count |
| GO:00435888 | Esophagus | ESCC | skin development | 163/8552 | 263/18723 | 6.48e-08 | 1.14e-06 | 163 |
| GO:00091002 | Esophagus | ESCC | glycoprotein metabolic process | 226/8552 | 387/18723 | 2.64e-07 | 3.94e-06 | 226 |
| GO:00715599 | Esophagus | ESCC | response to transforming growth factor beta | 157/8552 | 256/18723 | 2.95e-07 | 4.23e-06 | 157 |
| GO:00715609 | Esophagus | ESCC | cellular response to transforming growth factor beta stimulus | 151/8552 | 250/18723 | 1.78e-06 | 2.10e-05 | 151 |
| GO:004545419 | Esophagus | ESCC | cell redox homeostasis | 29/8552 | 35/18723 | 6.61e-06 | 6.75e-05 | 29 |
| GO:00071799 | Esophagus | ESCC | transforming growth factor beta receptor signaling pathway | 121/8552 | 198/18723 | 8.26e-06 | 8.03e-05 | 121 |
| GO:00091012 | Esophagus | ESCC | glycoprotein biosynthetic process | 181/8552 | 317/18723 | 2.54e-05 | 2.15e-04 | 181 |
| GO:00301984 | Esophagus | ESCC | extracellular matrix organization | 171/8552 | 301/18723 | 6.08e-05 | 4.67e-04 | 171 |
| GO:00430624 | Esophagus | ESCC | extracellular structure organization | 171/8552 | 302/18723 | 7.73e-05 | 5.76e-04 | 171 |
| GO:00452294 | Esophagus | ESCC | external encapsulating structure organization | 172/8552 | 304/18723 | 7.80e-05 | 5.80e-04 | 172 |
| GO:000717810 | Esophagus | ESCC | transmembrane receptor protein serine/threonine kinase signaling pathway | 195/8552 | 355/18723 | 2.58e-04 | 1.58e-03 | 195 |
| GO:00072299 | Esophagus | ESCC | integrin-mediated signaling pathway | 67/8552 | 107/18723 | 3.03e-04 | 1.81e-03 | 67 |
| GO:00305115 | Esophagus | ESCC | positive regulation of transforming growth factor beta receptor signaling pathway | 24/8552 | 32/18723 | 7.22e-04 | 3.77e-03 | 24 |
| GO:19038465 | Esophagus | ESCC | positive regulation of cellular response to transforming growth factor beta stimulus | 24/8552 | 32/18723 | 7.22e-04 | 3.77e-03 | 24 |
| GO:00170156 | Esophagus | ESCC | regulation of transforming growth factor beta receptor signaling pathway | 75/8552 | 128/18723 | 2.19e-03 | 9.71e-03 | 75 |
| GO:19038447 | Esophagus | ESCC | regulation of cellular response to transforming growth factor beta stimulus | 76/8552 | 131/18723 | 2.96e-03 | 1.24e-02 | 76 |
| GO:0006029 | Esophagus | ESCC | proteoglycan metabolic process | 48/8552 | 79/18723 | 4.93e-03 | 1.89e-02 | 48 |
| GO:190260018 | Esophagus | ESCC | proton transmembrane transport | 88/8552 | 157/18723 | 5.62e-03 | 2.10e-02 | 88 |
| GO:0030166 | Esophagus | ESCC | proteoglycan biosynthetic process | 35/8552 | 56/18723 | 8.30e-03 | 2.94e-02 | 35 |
| GO:19030532 | Esophagus | ESCC | regulation of extracellular matrix organization | 30/8552 | 48/18723 | 1.40e-02 | 4.57e-02 | 30 |
| Page: 1 2 |
| Pathway ID | Tissue | Disease Stage | Description | Gene Ratio | Bg Ratio | pvalue | p.adjust | qvalue | Count |
| Page: 1 |
Top |
Cell-cell communication analysis |
| Identification of potential cell-cell interactions between two cell types and their ligand-receptor pairs for different disease states |
| Ligand | Receptor | LRpair | Pathway | Tissue | Disease Stage |
| Page: 1 |
Top |
Single-cell gene regulatory network inference analysis |
| Find out the significant the regulons (TFs) and the target genes of each regulon across cell types for different disease states |
| TF | Cell Type | Tissue | Disease Stage | Target Gene | RSS | Regulon Activity |
| ∗The dot plots of a searched regulon are shown for all cell subpopulations in each disease state of each tissue based on the regulon specific score inferred using pySCENIC and by calculating the average expression. |
| Page: 1 |
Top |
Somatic mutation of malignant transformation related genes |
| Annotation of somatic variants for genes involved in malignant transformation |
| Hugo Symbol | Variant Class | Variant Classification | dbSNP RS | HGVSc | HGVSp | HGVSp Short | SWISSPROT | BIOTYPE | SIFT | PolyPhen | Tumor Sample Barcode | Tissue | Histology | Sex | Age | Stage | Therapy Types | Drugs | Outcome |
| SLC2A10 | SNV | Missense_Mutation | rs369484751 | c.797G>T | p.Gly266Val | p.G266V | O95528 | protein_coding | deleterious(0) | possibly_damaging(0.776) | TCGA-BH-A0DI-01 | Breast | breast invasive carcinoma | Female | <65 | I/II | Chemotherapy | adriamycin | CR |
| SLC2A10 | SNV | Missense_Mutation | rs768203290 | c.181N>A | p.Ala61Thr | p.A61T | O95528 | protein_coding | deleterious(0.01) | probably_damaging(0.999) | TCGA-BH-A18G-01 | Breast | breast invasive carcinoma | Female | >=65 | I/II | Unknown | Unknown | SD |
| SLC2A10 | SNV | Missense_Mutation | rs776700297 | c.1207C>T | p.Arg403Trp | p.R403W | O95528 | protein_coding | deleterious(0.01) | benign(0.063) | TCGA-D8-A1J9-01 | Breast | breast invasive carcinoma | Female | <65 | I/II | Unknown | Unknown | SD |
| SLC2A10 | SNV | Missense_Mutation | novel | c.1492N>G | p.Pro498Ala | p.P498A | O95528 | protein_coding | deleterious(0) | probably_damaging(1) | TCGA-HM-A4S6-01 | Cervix | cervical & endocervical cancer | Female | <65 | III/IV | Chemotherapy | cisplatin | CR |
| SLC2A10 | SNV | Missense_Mutation | rs756530921 | c.1420G>A | p.Gly474Ser | p.G474S | O95528 | protein_coding | deleterious(0) | probably_damaging(1) | TCGA-MA-AA3Z-01 | Cervix | cervical & endocervical cancer | Female | <65 | I/II | Unknown | Unknown | SD |
| SLC2A10 | SNV | Missense_Mutation | c.1303N>T | p.Leu435Phe | p.L435F | O95528 | protein_coding | deleterious(0) | probably_damaging(0.999) | TCGA-A6-2686-01 | Colorectum | colon adenocarcinoma | Female | >=65 | I/II | Unknown | Unknown | SD | |
| SLC2A10 | SNV | Missense_Mutation | c.1153N>T | p.Ala385Ser | p.A385S | O95528 | protein_coding | tolerated(0.64) | benign(0.01) | TCGA-AA-3663-01 | Colorectum | colon adenocarcinoma | Male | <65 | I/II | Unknown | Unknown | SD | |
| SLC2A10 | SNV | Missense_Mutation | novel | c.451N>C | p.Tyr151His | p.Y151H | O95528 | protein_coding | deleterious(0) | probably_damaging(1) | TCGA-AA-3811-01 | Colorectum | colon adenocarcinoma | Female | >=65 | III/IV | Unknown | Unknown | PD |
| SLC2A10 | SNV | Missense_Mutation | c.422N>T | p.Ala141Val | p.A141V | O95528 | protein_coding | tolerated(1) | benign(0.03) | TCGA-AA-3864-01 | Colorectum | colon adenocarcinoma | Male | >=65 | I/II | Unknown | Unknown | SD | |
| SLC2A10 | SNV | Missense_Mutation | novel | c.1061C>T | p.Pro354Leu | p.P354L | O95528 | protein_coding | tolerated(0.1) | benign(0.028) | TCGA-AA-A01K-01 | Colorectum | colon adenocarcinoma | Female | >=65 | III/IV | Chemotherapy | folinic | CR |
| Page: 1 2 3 4 5 6 7 |
Top |
Related drugs of malignant transformation related genes |
| Identification of chemicals and drugs interact with genes involved in malignant transfromation |
| (DGIdb 4.0) |
| Entrez ID | Symbol | Category | Interaction Types | Drug Claim Name | Drug Name | PMIDs |
| Page: 1 |

Copyright 2023-Present -The University of Texas Health Science Center at Houston |