
|
|||||
|
 | |
| |
| |
| |
| |
| |
|
Gene: SLC2A1 |
Gene summary for SLC2A1 |
| Gene information | Species | Human | Gene symbol | SLC2A1 | Gene ID | 6513 |
| Gene name | solute carrier family 2 member 1 | |
| Gene Alias | CSE | |
| Cytomap | 1p34.2 | |
| Gene Type | protein-coding | GO ID | GO:0000003 | UniProtAcc | P11166 |
Top |
Malignant transformation analysis |
| Identification of the aberrant gene expression in precancerous and cancerous lesions by comparing the gene expression of stem-like cells in diseased tissues with normal stem cells |
| Entrez ID | Symbol | Replicates | Species | Organ | Tissue | Adj P-value | Log2FC | Malignancy |
| 6513 | SLC2A1 | GSM4909281 | Human | Breast | IDC | 3.61e-06 | 3.73e-01 | 0.21 |
| 6513 | SLC2A1 | GSM4909285 | Human | Breast | IDC | 1.21e-03 | 3.28e-01 | 0.21 |
| 6513 | SLC2A1 | GSM4909311 | Human | Breast | IDC | 1.70e-05 | -1.28e-01 | 0.1534 |
| 6513 | SLC2A1 | GSM4909315 | Human | Breast | IDC | 2.05e-02 | 2.59e-01 | 0.21 |
| 6513 | SLC2A1 | GSM4909319 | Human | Breast | IDC | 2.26e-06 | -1.43e-01 | 0.1563 |
| 6513 | SLC2A1 | ctrl6 | Human | Breast | Precancer | 1.29e-19 | 8.63e-01 | -0.0061 |
| 6513 | SLC2A1 | brca3 | Human | Breast | Precancer | 2.18e-13 | 4.48e-01 | -0.0263 |
| 6513 | SLC2A1 | brca7 | Human | Breast | Precancer | 4.55e-06 | 8.59e-01 | -0.009 |
| 6513 | SLC2A1 | brca10 | Human | Breast | Precancer | 6.30e-38 | 9.31e-01 | -0.0029 |
| 6513 | SLC2A1 | NCCBC5 | Human | Breast | DCIS | 3.67e-02 | 1.80e-01 | 0.2046 |
| 6513 | SLC2A1 | P1 | Human | Breast | IDC | 1.07e-03 | -1.38e-01 | 0.1527 |
| 6513 | SLC2A1 | DCIS2 | Human | Breast | DCIS | 5.76e-38 | 7.10e-02 | 0.0085 |
| 6513 | SLC2A1 | CA_HPV_1 | Human | Cervix | CC | 2.12e-03 | -6.73e-02 | 0.0264 |
| 6513 | SLC2A1 | CA_HPV_2 | Human | Cervix | CC | 2.20e-03 | 3.24e-01 | 0.0391 |
| 6513 | SLC2A1 | CA_HPV_3 | Human | Cervix | CC | 3.46e-04 | 2.39e-01 | 0.0414 |
| 6513 | SLC2A1 | CCI_1 | Human | Cervix | CC | 1.82e-09 | 1.16e+00 | 0.528 |
| 6513 | SLC2A1 | Tumor | Human | Cervix | CC | 4.76e-22 | 6.44e-01 | 0.1241 |
| 6513 | SLC2A1 | sample3 | Human | Cervix | CC | 4.15e-44 | 8.98e-01 | 0.1387 |
| 6513 | SLC2A1 | L1 | Human | Cervix | CC | 6.49e-20 | 8.35e-01 | 0.0802 |
| 6513 | SLC2A1 | T3 | Human | Cervix | CC | 2.65e-40 | 9.20e-01 | 0.1389 |
| Page: 1 2 3 4 5 6 7 |
| Tissue | Expression Dynamics | Abbreviation |
| Breast | 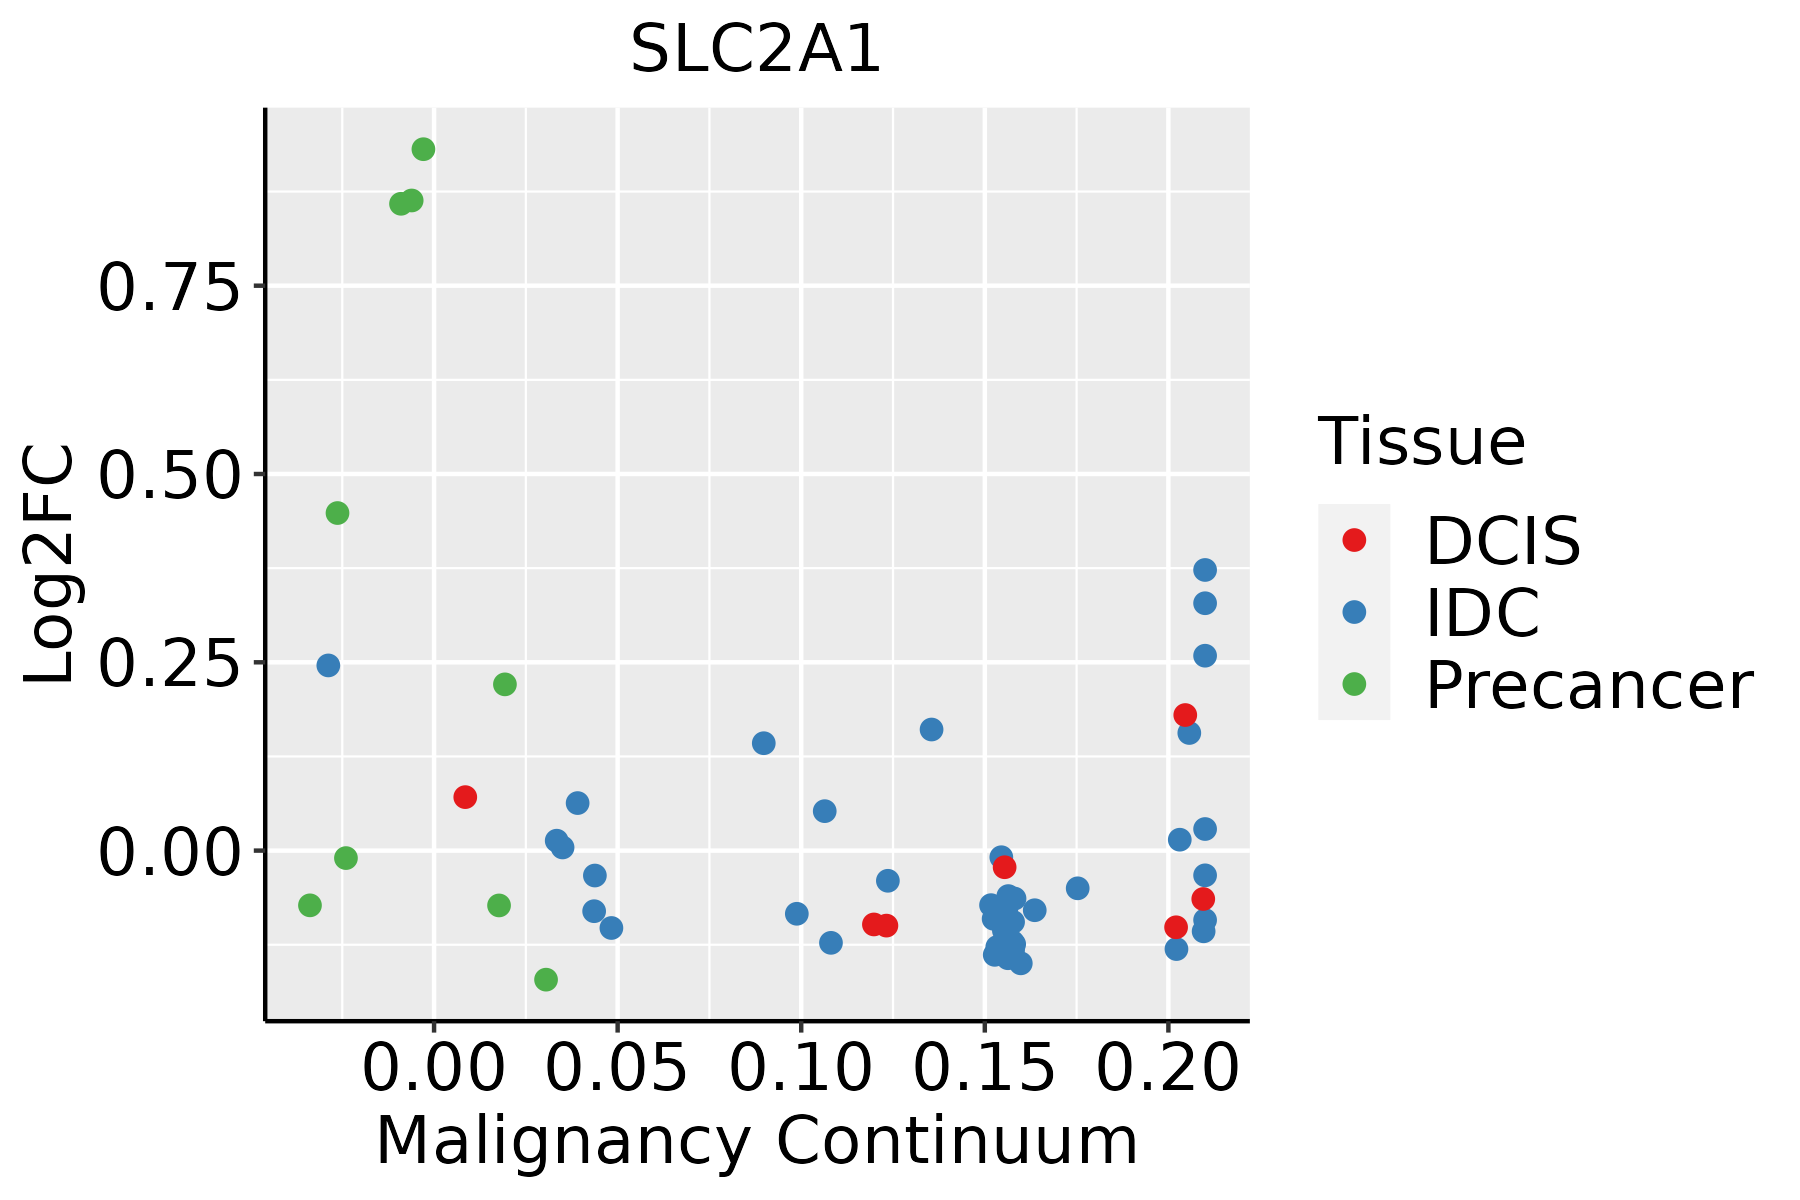 | IDC: Invasive ductal carcinoma |
| DCIS: Ductal carcinoma in situ | ||
| Precancer(BRCA1-mut): Precancerous lesion from BRCA1 mutation carriers | ||
| Cervix | 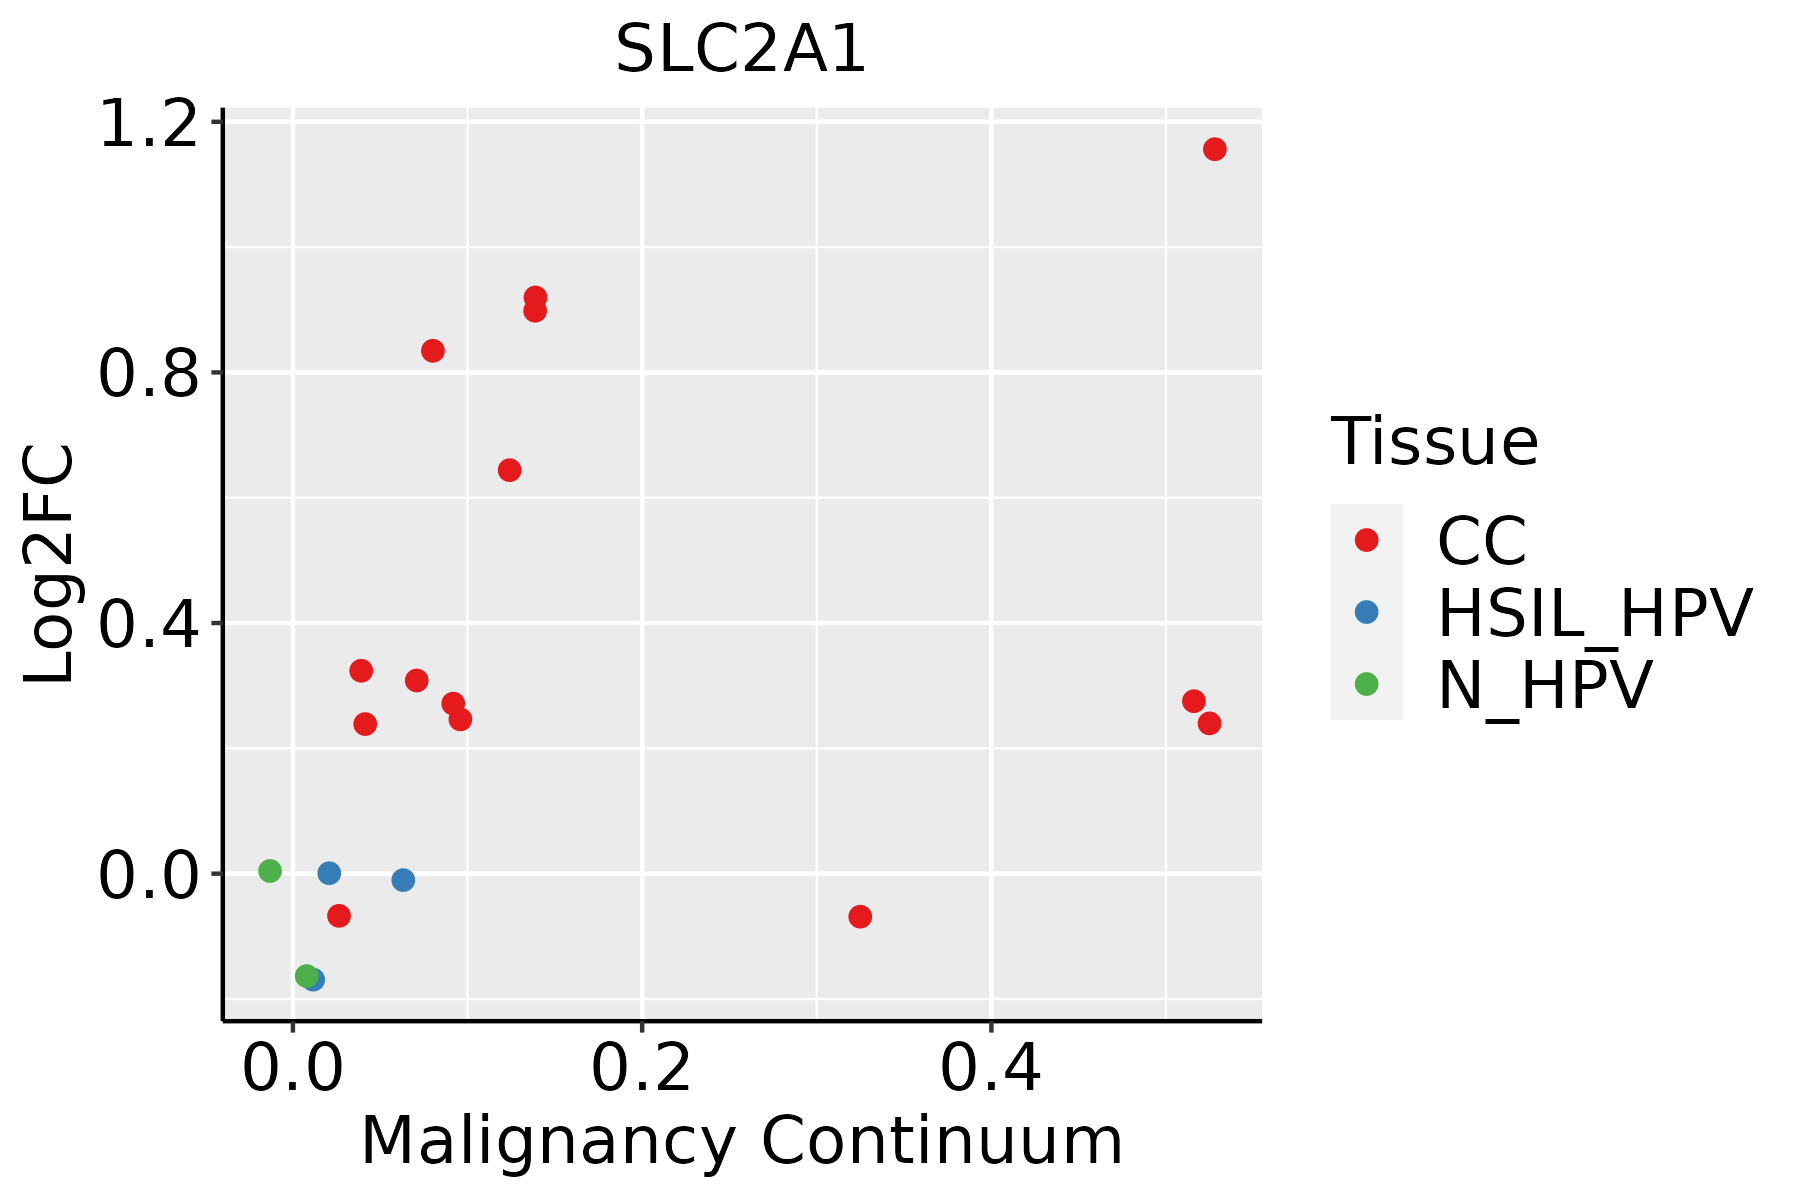 | CC: Cervix cancer |
| HSIL_HPV: HPV-infected high-grade squamous intraepithelial lesions | ||
| N_HPV: HPV-infected normal cervix | ||
| Esophagus | 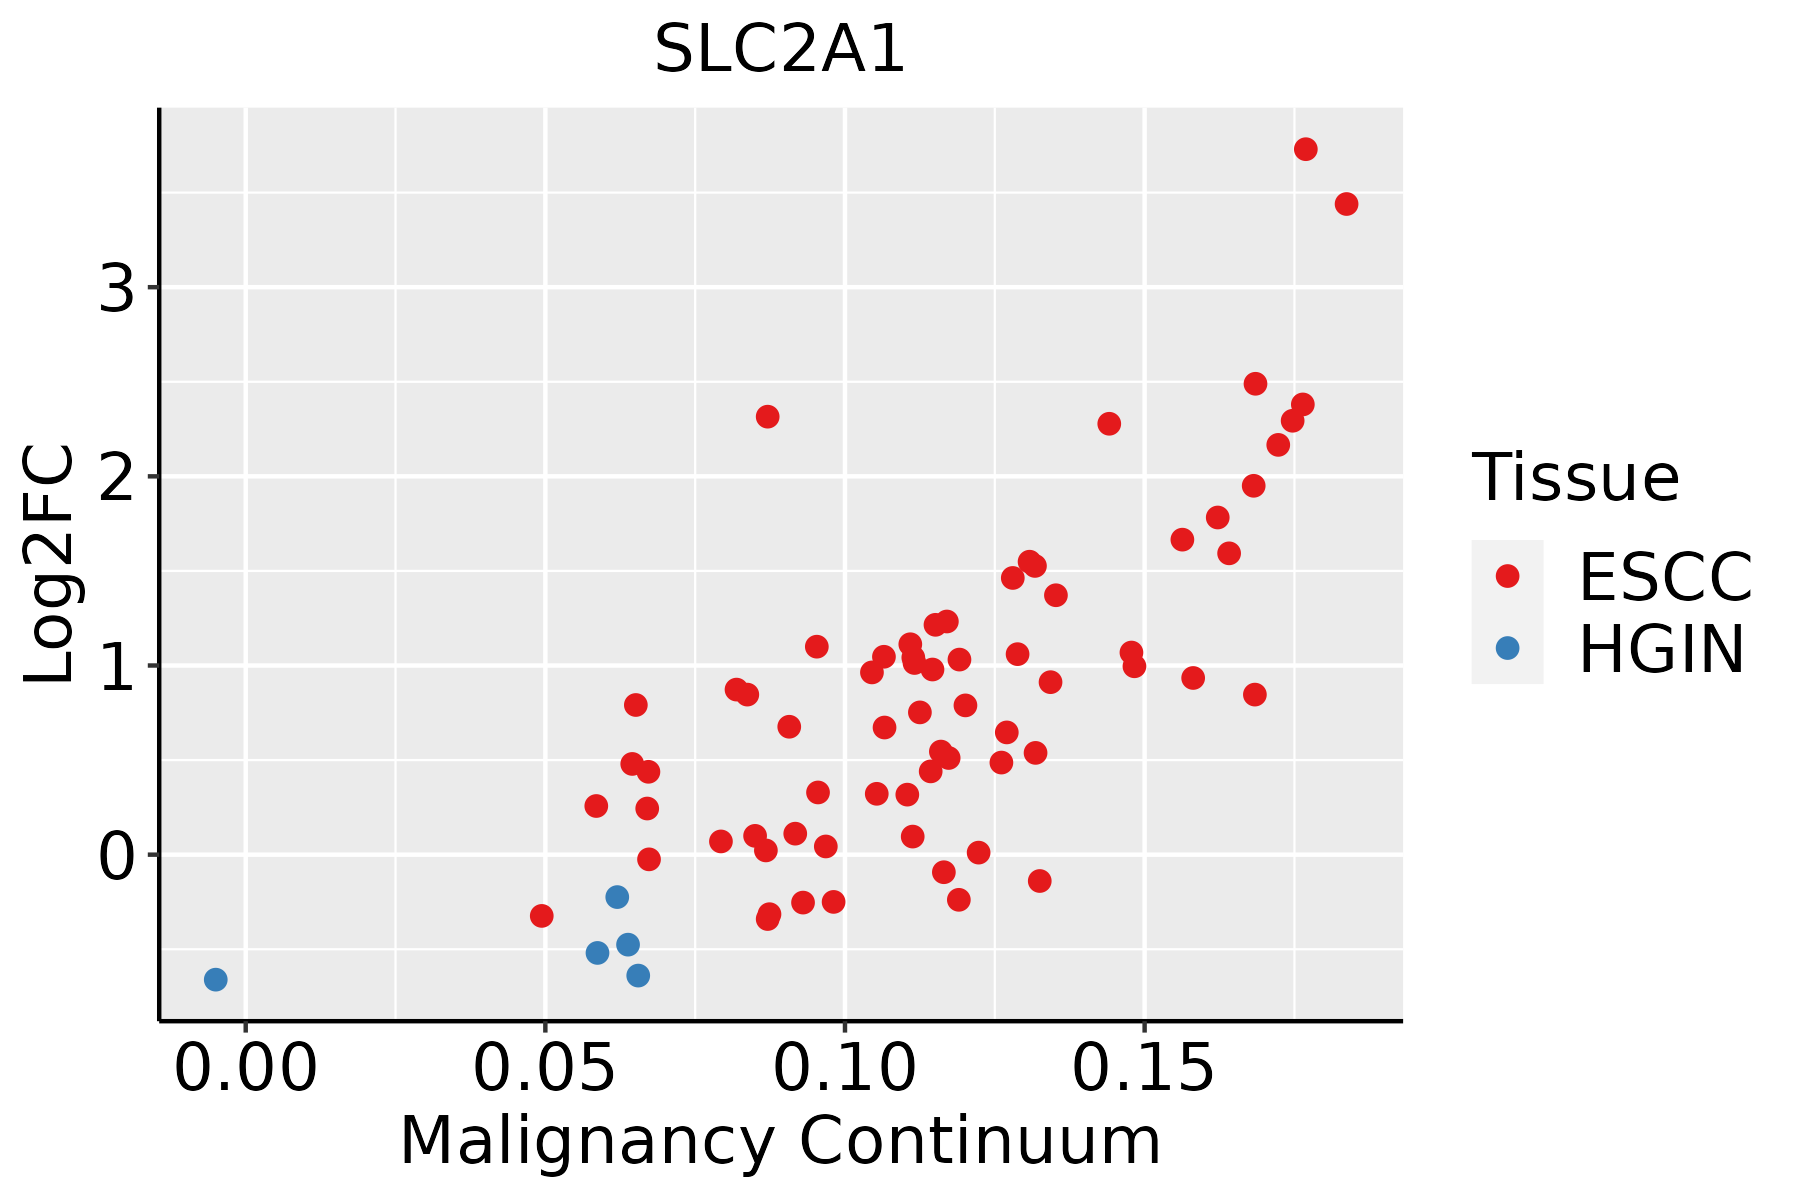 | ESCC: Esophageal squamous cell carcinoma |
| HGIN: High-grade intraepithelial neoplasias | ||
| LGIN: Low-grade intraepithelial neoplasias | ||
| Liver | 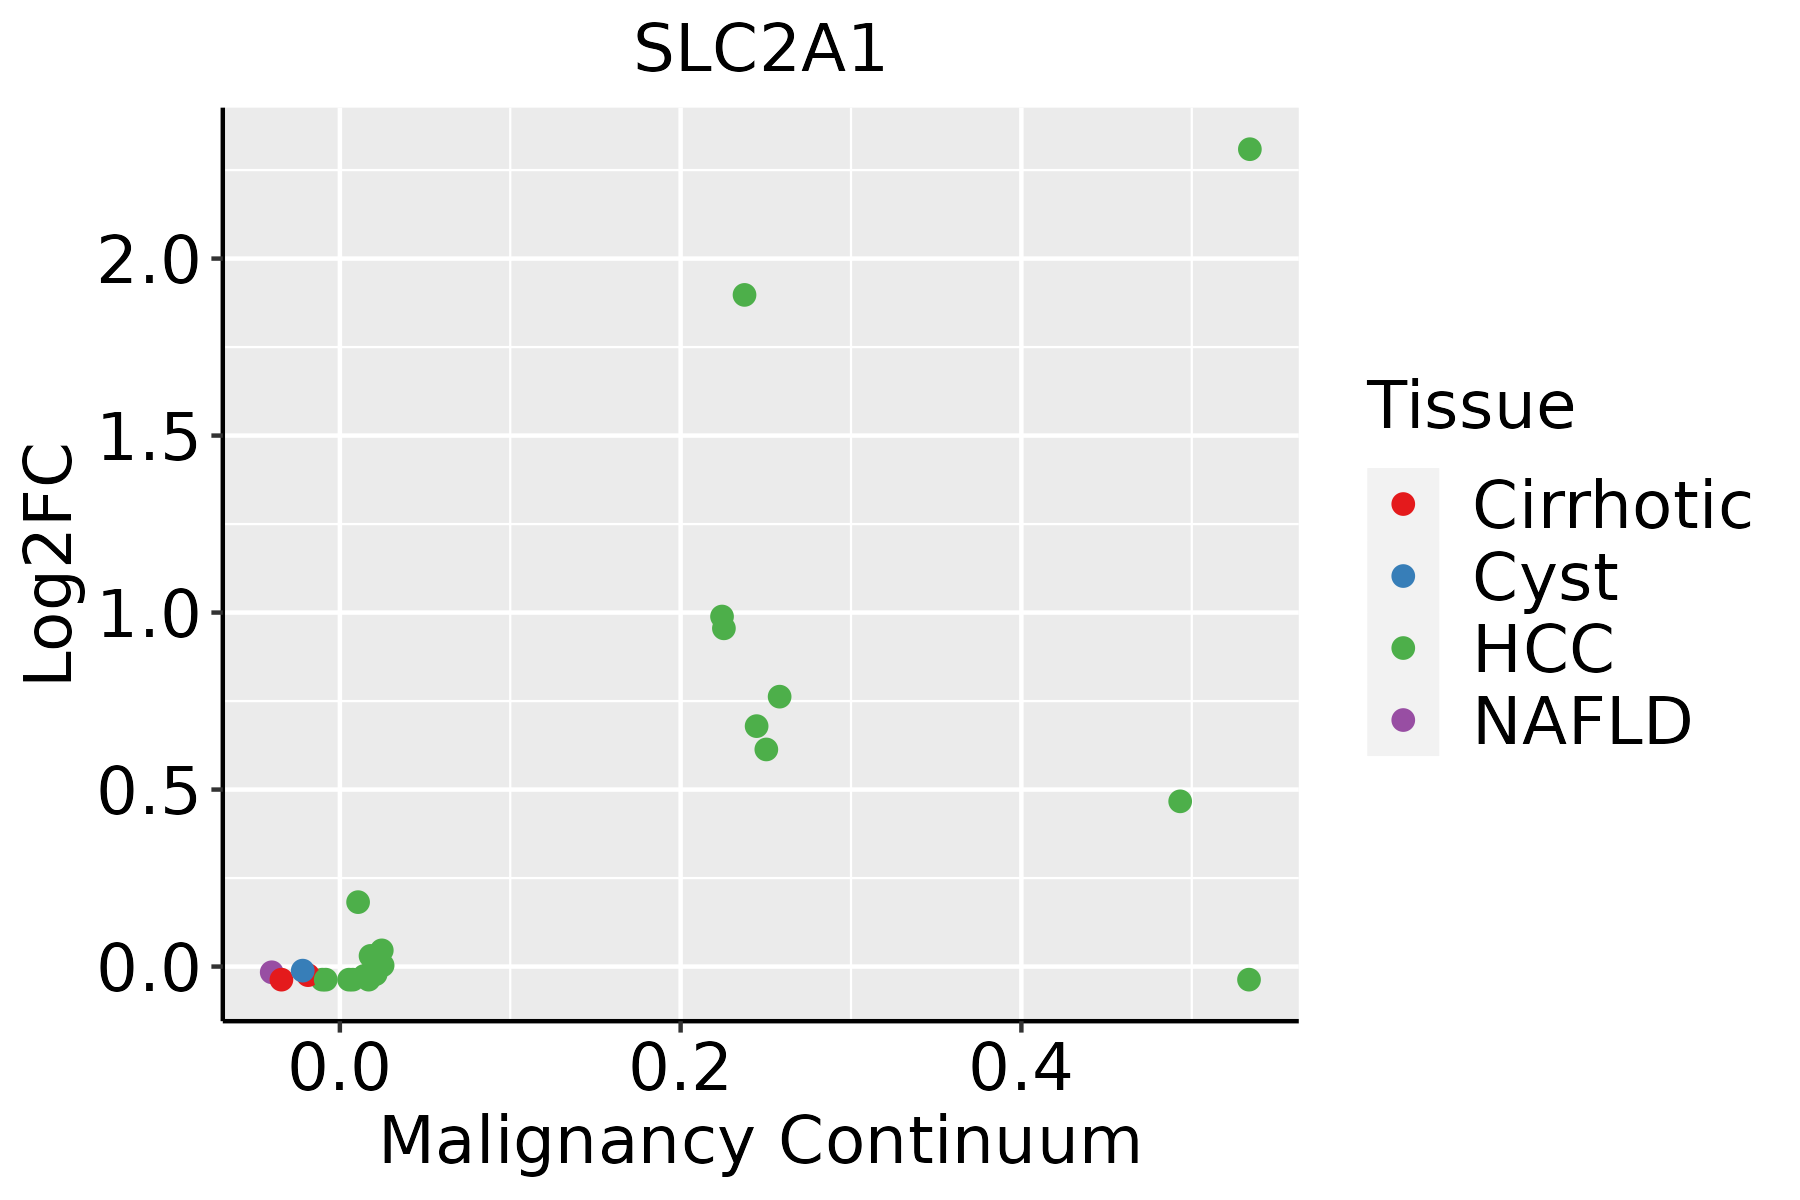 | HCC: Hepatocellular carcinoma |
| NAFLD: Non-alcoholic fatty liver disease | ||
| Oral Cavity |  | EOLP: Erosive Oral lichen planus |
| LP: leukoplakia | ||
| NEOLP: Non-erosive oral lichen planus | ||
| OSCC: Oral squamous cell carcinoma | ||
| Skin | 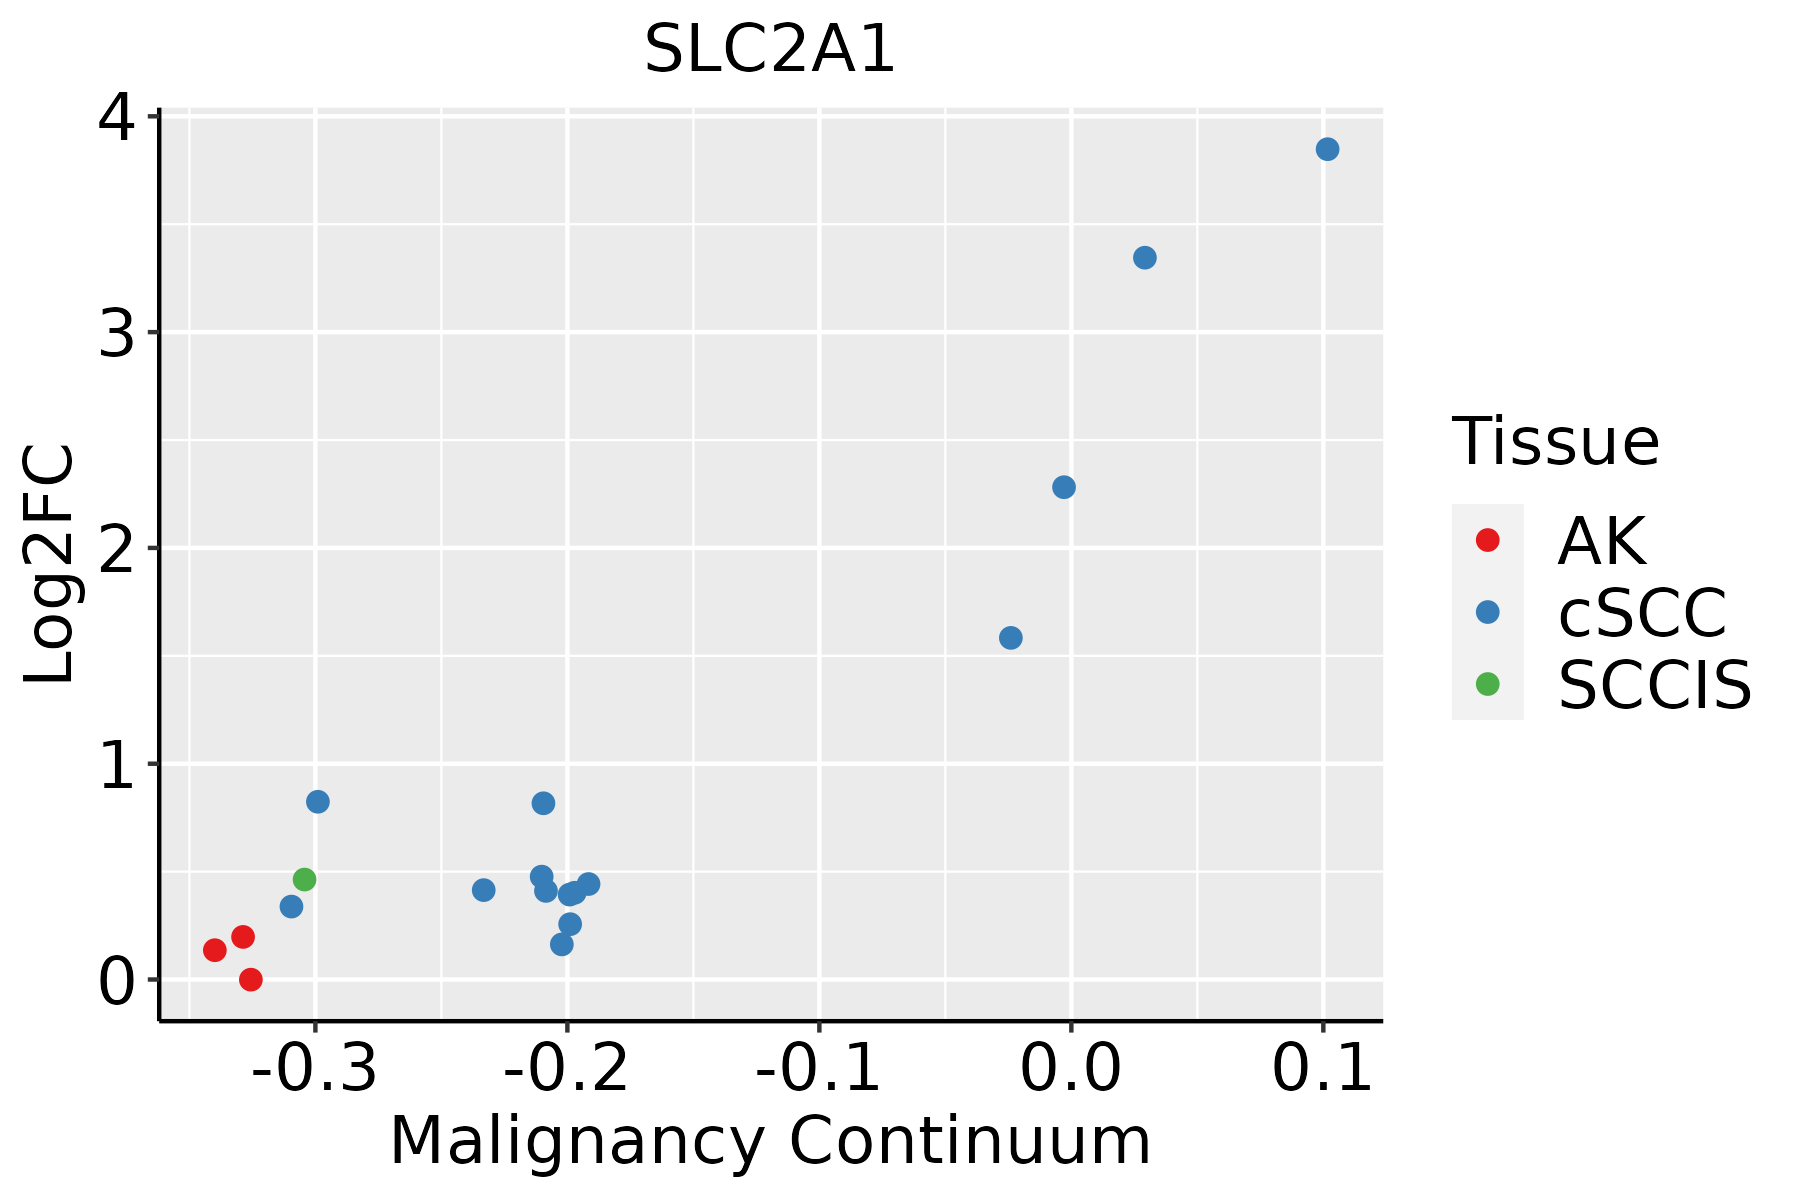 | AK: Actinic keratosis |
| cSCC: Cutaneous squamous cell carcinoma | ||
| SCCIS:squamous cell carcinoma in situ | ||
| Thyroid | 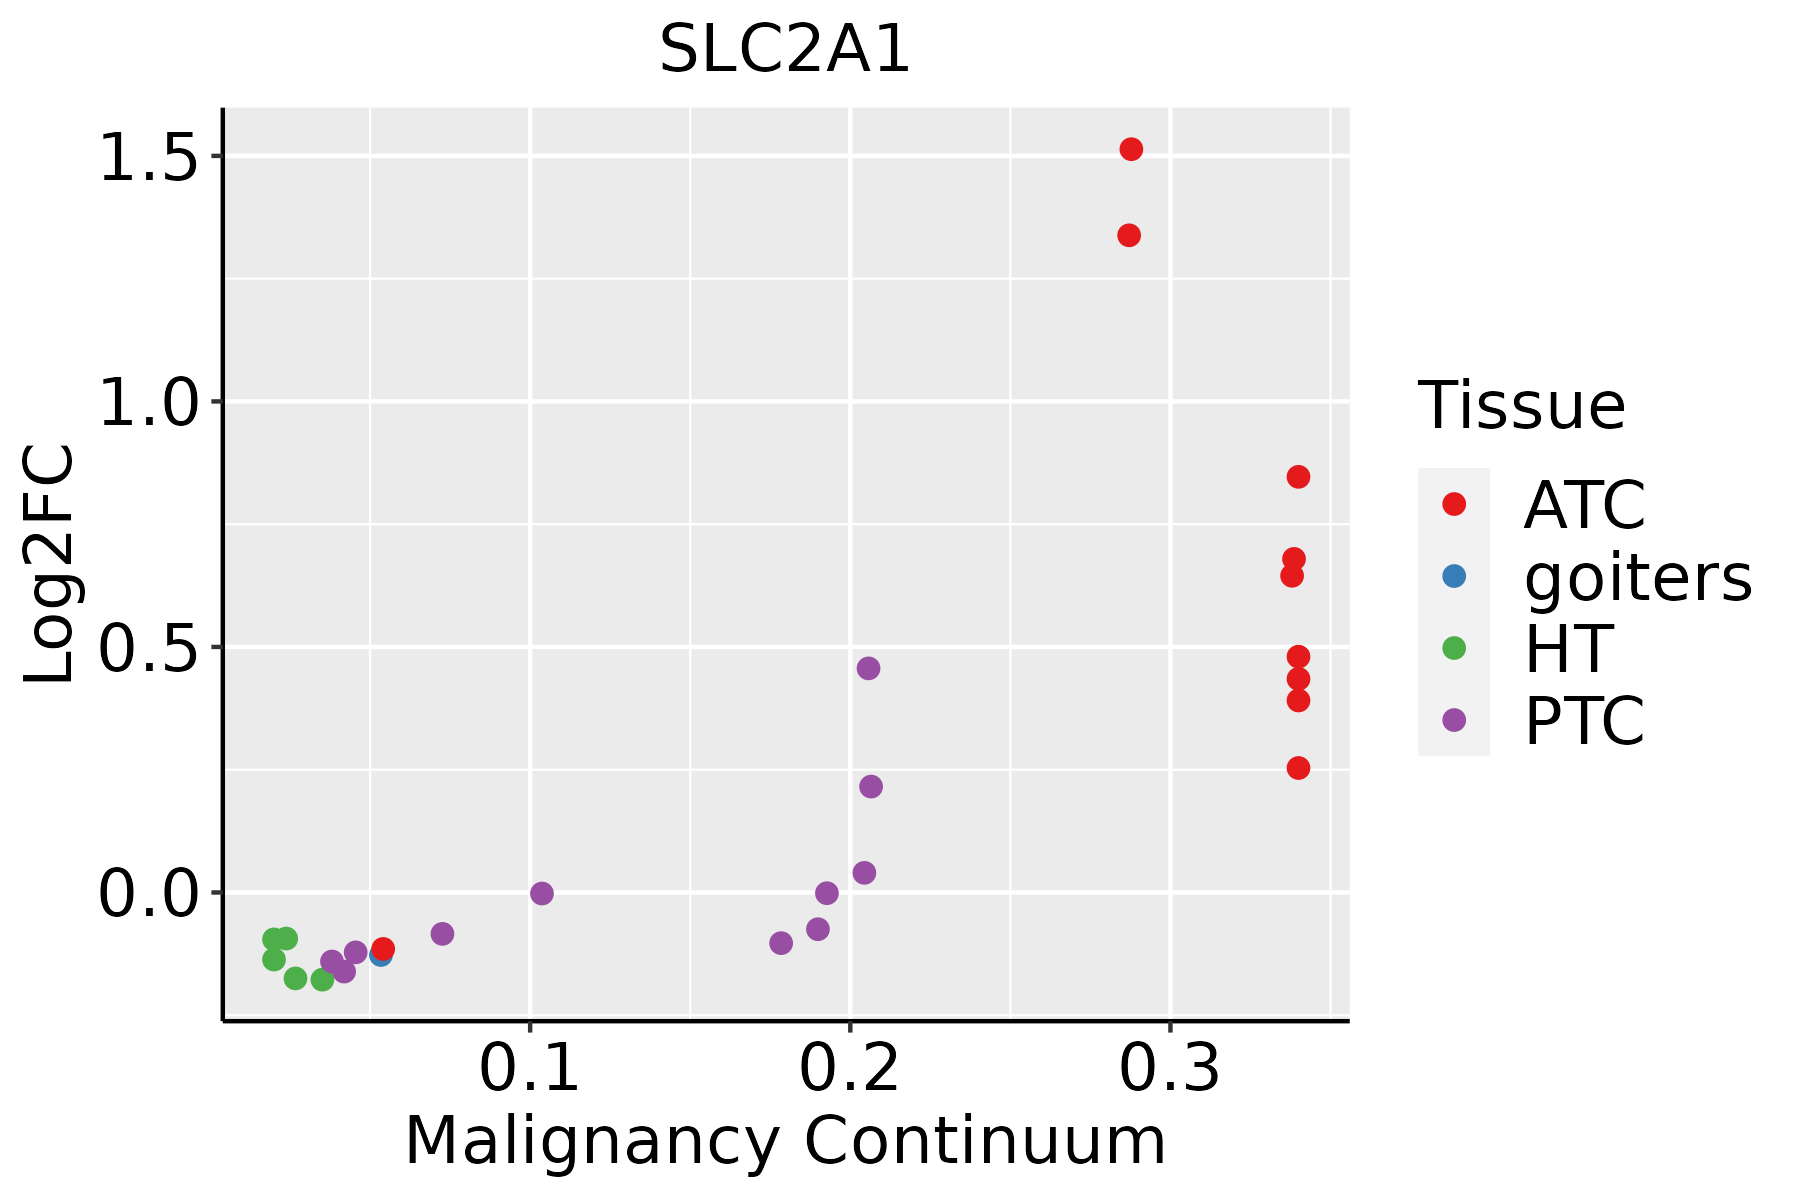 | ATC: Anaplastic thyroid cancer |
| HT: Hashimoto's thyroiditis | ||
| PTC: Papillary thyroid cancer |
| ∗log2FC in expression of this searched gene in stem-like cells from each diseased tissue sample relative to stem-like cells in normal samples in each tissue plotted against the malignancy continuum. Samples are colored based on if they are from different disease stage. |
Top |
Malignant transformation related pathway analysis |
| Find out the enriched GO biological processes and KEGG pathways involved in transition from healthy to precancer to cancer |
| Tissue | Disease Stage | Enriched GO biological Processes |
| Colorectum | AD |  |
| Colorectum | SER |  |
| Colorectum | MSS |  |
| Colorectum | MSI-H |  |
| Colorectum | FAP |  |
| ∗Top 15 enriched GO BP terms are showed in the bar plot of each disease state in each tissue. Each row represents a significant GO biological process which is colored according to the -log10(p.adjust). |
| Page: 1 2 3 4 5 6 7 8 9 |
| GO ID | Tissue | Disease Stage | Description | Gene Ratio | Bg Ratio | pvalue | p.adjust | Count |
| GO:00362939 | Breast | Precancer | response to decreased oxygen levels | 53/1080 | 322/18723 | 4.09e-12 | 6.84e-10 | 53 |
| GO:00016669 | Breast | Precancer | response to hypoxia | 51/1080 | 307/18723 | 7.33e-12 | 1.11e-09 | 51 |
| GO:00704829 | Breast | Precancer | response to oxygen levels | 55/1080 | 347/18723 | 7.47e-12 | 1.11e-09 | 55 |
| GO:00621979 | Breast | Precancer | cellular response to chemical stress | 51/1080 | 337/18723 | 2.40e-10 | 2.34e-08 | 51 |
| GO:00075653 | Breast | Precancer | female pregnancy | 29/1080 | 193/18723 | 2.07e-06 | 7.31e-05 | 29 |
| GO:00447063 | Breast | Precancer | multi-multicellular organism process | 31/1080 | 220/18723 | 3.73e-06 | 1.19e-04 | 31 |
| GO:00712147 | Breast | Precancer | cellular response to abiotic stimulus | 37/1080 | 331/18723 | 9.12e-05 | 1.73e-03 | 37 |
| GO:01040047 | Breast | Precancer | cellular response to environmental stimulus | 37/1080 | 331/18723 | 9.12e-05 | 1.73e-03 | 37 |
| GO:00316679 | Breast | Precancer | response to nutrient levels | 47/1080 | 474/18723 | 2.09e-04 | 3.27e-03 | 47 |
| GO:00714969 | Breast | Precancer | cellular response to external stimulus | 33/1080 | 320/18723 | 9.01e-04 | 1.03e-02 | 33 |
| GO:00316688 | Breast | Precancer | cellular response to extracellular stimulus | 27/1080 | 246/18723 | 1.02e-03 | 1.13e-02 | 27 |
| GO:00092677 | Breast | Precancer | cellular response to starvation | 19/1080 | 156/18723 | 1.65e-03 | 1.67e-02 | 19 |
| GO:00018956 | Breast | Precancer | retina homeostasis | 12/1080 | 79/18723 | 1.82e-03 | 1.79e-02 | 12 |
| GO:00059966 | Breast | Precancer | monosaccharide metabolic process | 27/1080 | 257/18723 | 1.94e-03 | 1.88e-02 | 27 |
| GO:00714703 | Breast | Precancer | cellular response to osmotic stress | 8/1080 | 41/18723 | 2.08e-03 | 1.97e-02 | 8 |
| GO:00425947 | Breast | Precancer | response to starvation | 22/1080 | 197/18723 | 2.30e-03 | 2.15e-02 | 22 |
| GO:00096126 | Breast | Precancer | response to mechanical stimulus | 23/1080 | 216/18723 | 3.41e-03 | 2.85e-02 | 23 |
| GO:00018948 | Breast | Precancer | tissue homeostasis | 27/1080 | 268/18723 | 3.49e-03 | 2.90e-02 | 27 |
| GO:00316697 | Breast | Precancer | cellular response to nutrient levels | 22/1080 | 215/18723 | 6.58e-03 | 4.53e-02 | 22 |
| GO:007048214 | Breast | IDC | response to oxygen levels | 64/1434 | 347/18723 | 3.45e-11 | 5.57e-09 | 64 |
| Page: 1 2 3 4 5 6 7 8 9 10 11 12 13 14 15 16 17 |
| Pathway ID | Tissue | Disease Stage | Description | Gene Ratio | Bg Ratio | pvalue | p.adjust | qvalue | Count |
| hsa0541518 | Breast | Precancer | Diabetic cardiomyopathy | 63/684 | 203/8465 | 5.63e-22 | 1.48e-20 | 1.14e-20 | 63 |
| hsa0406616 | Breast | Precancer | HIF-1 signaling pathway | 23/684 | 109/8465 | 1.51e-05 | 1.59e-04 | 1.22e-04 | 23 |
| hsa0516618 | Breast | Precancer | Human T-cell leukemia virus 1 infection | 33/684 | 222/8465 | 4.29e-04 | 3.31e-03 | 2.53e-03 | 33 |
| hsa052309 | Breast | Precancer | Central carbon metabolism in cancer | 13/684 | 70/8465 | 3.57e-03 | 2.17e-02 | 1.66e-02 | 13 |
| hsa0541519 | Breast | Precancer | Diabetic cardiomyopathy | 63/684 | 203/8465 | 5.63e-22 | 1.48e-20 | 1.14e-20 | 63 |
| hsa0406617 | Breast | Precancer | HIF-1 signaling pathway | 23/684 | 109/8465 | 1.51e-05 | 1.59e-04 | 1.22e-04 | 23 |
| hsa0516619 | Breast | Precancer | Human T-cell leukemia virus 1 infection | 33/684 | 222/8465 | 4.29e-04 | 3.31e-03 | 2.53e-03 | 33 |
| hsa0523012 | Breast | Precancer | Central carbon metabolism in cancer | 13/684 | 70/8465 | 3.57e-03 | 2.17e-02 | 1.66e-02 | 13 |
| hsa0541523 | Breast | IDC | Diabetic cardiomyopathy | 67/867 | 203/8465 | 3.17e-19 | 8.59e-18 | 6.43e-18 | 67 |
| hsa0516624 | Breast | IDC | Human T-cell leukemia virus 1 infection | 40/867 | 222/8465 | 2.52e-04 | 2.21e-03 | 1.66e-03 | 40 |
| hsa0406623 | Breast | IDC | HIF-1 signaling pathway | 22/867 | 109/8465 | 1.36e-03 | 1.00e-02 | 7.50e-03 | 22 |
| hsa0491916 | Breast | IDC | Thyroid hormone signaling pathway | 23/867 | 121/8465 | 2.45e-03 | 1.69e-02 | 1.27e-02 | 23 |
| hsa052118 | Breast | IDC | Renal cell carcinoma | 14/867 | 69/8465 | 9.16e-03 | 4.37e-02 | 3.27e-02 | 14 |
| hsa0541533 | Breast | IDC | Diabetic cardiomyopathy | 67/867 | 203/8465 | 3.17e-19 | 8.59e-18 | 6.43e-18 | 67 |
| hsa0516634 | Breast | IDC | Human T-cell leukemia virus 1 infection | 40/867 | 222/8465 | 2.52e-04 | 2.21e-03 | 1.66e-03 | 40 |
| hsa0406633 | Breast | IDC | HIF-1 signaling pathway | 22/867 | 109/8465 | 1.36e-03 | 1.00e-02 | 7.50e-03 | 22 |
| hsa0491917 | Breast | IDC | Thyroid hormone signaling pathway | 23/867 | 121/8465 | 2.45e-03 | 1.69e-02 | 1.27e-02 | 23 |
| hsa0521113 | Breast | IDC | Renal cell carcinoma | 14/867 | 69/8465 | 9.16e-03 | 4.37e-02 | 3.27e-02 | 14 |
| hsa0541543 | Breast | DCIS | Diabetic cardiomyopathy | 65/846 | 203/8465 | 1.81e-18 | 4.87e-17 | 3.59e-17 | 65 |
| hsa0516642 | Breast | DCIS | Human T-cell leukemia virus 1 infection | 41/846 | 222/8465 | 7.03e-05 | 6.88e-04 | 5.07e-04 | 41 |
| Page: 1 2 3 4 5 |
Top |
Cell-cell communication analysis |
| Identification of potential cell-cell interactions between two cell types and their ligand-receptor pairs for different disease states |
| Ligand | Receptor | LRpair | Pathway | Tissue | Disease Stage |
| Page: 1 |
Top |
Single-cell gene regulatory network inference analysis |
| Find out the significant the regulons (TFs) and the target genes of each regulon across cell types for different disease states |
| TF | Cell Type | Tissue | Disease Stage | Target Gene | RSS | Regulon Activity |
| ∗The dot plots of a searched regulon are shown for all cell subpopulations in each disease state of each tissue based on the regulon specific score inferred using pySCENIC and by calculating the average expression. |
| Page: 1 |
Top |
Somatic mutation of malignant transformation related genes |
| Annotation of somatic variants for genes involved in malignant transformation |
| Hugo Symbol | Variant Class | Variant Classification | dbSNP RS | HGVSc | HGVSp | HGVSp Short | SWISSPROT | BIOTYPE | SIFT | PolyPhen | Tumor Sample Barcode | Tissue | Histology | Sex | Age | Stage | Therapy Types | Drugs | Outcome |
| SLC2A1 | SNV | Missense_Mutation | novel | c.475N>G | p.Leu159Val | p.L159V | P11166 | protein_coding | tolerated(0.23) | benign(0.136) | TCGA-C8-A8HQ-01 | Breast | breast invasive carcinoma | Female | <65 | I/II | Unknown | Unknown | SD |
| SLC2A1 | insertion | Frame_Shift_Ins | novel | c.971_972insCTTAAGGA | p.Phe326ArgfsTer17 | p.F326Rfs*17 | P11166 | protein_coding | TCGA-A8-A07Z-01 | Breast | breast invasive carcinoma | Female | >=65 | I/II | Unspecific | Exemestane | SD | ||
| SLC2A1 | SNV | Missense_Mutation | novel | c.648N>G | p.Ile216Met | p.I216M | P11166 | protein_coding | deleterious(0) | possibly_damaging(0.685) | TCGA-C5-A1MH-01 | Cervix | cervical & endocervical cancer | Female | >=65 | III/IV | Chemotherapy | cisplatin | PD |
| SLC2A1 | SNV | Missense_Mutation | novel | c.488N>C | p.Gly163Ala | p.G163A | P11166 | protein_coding | tolerated(0.94) | benign(0.006) | TCGA-EA-A3HS-01 | Cervix | cervical & endocervical cancer | Female | <65 | I/II | Unknown | Unknown | SD |
| SLC2A1 | SNV | Missense_Mutation | rs199639208 | c.799N>A | p.Ala267Thr | p.A267T | P11166 | protein_coding | tolerated(0.59) | benign(0.003) | TCGA-VS-A9V2-01 | Cervix | cervical & endocervical cancer | Female | <65 | I/II | Unknown | Unknown | SD |
| SLC2A1 | SNV | Missense_Mutation | c.500N>T | p.Gly167Val | p.G167V | P11166 | protein_coding | deleterious(0) | probably_damaging(0.99) | TCGA-WL-A834-01 | Cervix | cervical & endocervical cancer | Female | <65 | I/II | Chemotherapy | paclitaxel | SD | |
| SLC2A1 | SNV | Missense_Mutation | novel | c.463N>C | p.Ala155Pro | p.A155P | P11166 | protein_coding | deleterious(0) | possibly_damaging(0.908) | TCGA-AA-3811-01 | Colorectum | colon adenocarcinoma | Female | >=65 | III/IV | Unknown | Unknown | PD |
| SLC2A1 | SNV | Missense_Mutation | rs201815571 | c.152G>A | p.Arg51His | p.R51H | P11166 | protein_coding | deleterious(0) | possibly_damaging(0.554) | TCGA-AD-5900-01 | Colorectum | colon adenocarcinoma | Male | >=65 | I/II | Unknown | Unknown | SD |
| SLC2A1 | SNV | Missense_Mutation | rs387907313 | c.694C>T | p.Arg232Cys | p.R232C | P11166 | protein_coding | deleterious(0) | probably_damaging(0.995) | TCGA-AZ-6601-01 | Colorectum | colon adenocarcinoma | Male | >=65 | I/II | Unknown | Unknown | PD |
| SLC2A1 | SNV | Missense_Mutation | rs139412383 | c.695N>A | p.Arg232His | p.R232H | P11166 | protein_coding | deleterious(0.01) | probably_damaging(0.988) | TCGA-CM-4748-01 | Colorectum | colon adenocarcinoma | Male | <65 | III/IV | Chemotherapy | fluorouracil | SD |
| Page: 1 2 3 4 |
Top |
Related drugs of malignant transformation related genes |
| Identification of chemicals and drugs interact with genes involved in malignant transfromation |
| (DGIdb 4.0) |
| Entrez ID | Symbol | Category | Interaction Types | Drug Claim Name | Drug Name | PMIDs |
| 6513 | SLC2A1 | TRANSPORTER, DRUGGABLE GENOME, EXTERNAL SIDE OF PLASMA MEMBRANE | TCDD | 7530807 | ||
| 6513 | SLC2A1 | TRANSPORTER, DRUGGABLE GENOME, EXTERNAL SIDE OF PLASMA MEMBRANE | allosteric modulator | 310264666 | ||
| 6513 | SLC2A1 | TRANSPORTER, DRUGGABLE GENOME, EXTERNAL SIDE OF PLASMA MEMBRANE | DIAZEPAM | DIAZEPAM | 15148255 | |
| 6513 | SLC2A1 | TRANSPORTER, DRUGGABLE GENOME, EXTERNAL SIDE OF PLASMA MEMBRANE | 178101360 | |||
| 6513 | SLC2A1 | TRANSPORTER, DRUGGABLE GENOME, EXTERNAL SIDE OF PLASMA MEMBRANE | IL-7 | 17023582 | ||
| 6513 | SLC2A1 | TRANSPORTER, DRUGGABLE GENOME, EXTERNAL SIDE OF PLASMA MEMBRANE | PIOGLITAZONE | PIOGLITAZONE | 17251278 | |
| 6513 | SLC2A1 | TRANSPORTER, DRUGGABLE GENOME, EXTERNAL SIDE OF PLASMA MEMBRANE | BFGF | 15924676 | ||
| 6513 | SLC2A1 | TRANSPORTER, DRUGGABLE GENOME, EXTERNAL SIDE OF PLASMA MEMBRANE | GENISTEIN | GENISTEIN | 8621505 | |
| 6513 | SLC2A1 | TRANSPORTER, DRUGGABLE GENOME, EXTERNAL SIDE OF PLASMA MEMBRANE | TRIAMCINOLONE | TRIAMCINOLONE | 10199793 | |
| 6513 | SLC2A1 | TRANSPORTER, DRUGGABLE GENOME, EXTERNAL SIDE OF PLASMA MEMBRANE | LIPOIC ACID | THIOCTIC ACID | 23984871 |
| Page: 1 2 3 |

Copyright 2023-Present -The University of Texas Health Science Center at Houston |