
|
|||||
|
 | |
| |
| |
| |
| |
| |
|
Gene: SLC29A4 |
Gene summary for SLC29A4 |
| Gene information | Species | Human | Gene symbol | SLC29A4 | Gene ID | 222962 |
| Gene name | solute carrier family 29 member 4 | |
| Gene Alias | ENT4 | |
| Cytomap | 7p22.1 | |
| Gene Type | protein-coding | GO ID | GO:0001504 | UniProtAcc | Q7RTT9 |
Top |
Malignant transformation analysis |
| Identification of the aberrant gene expression in precancerous and cancerous lesions by comparing the gene expression of stem-like cells in diseased tissues with normal stem cells |
| Entrez ID | Symbol | Replicates | Species | Organ | Tissue | Adj P-value | Log2FC | Malignancy |
| 222962 | SLC29A4 | HCC1_Meng | Human | Liver | HCC | 6.67e-43 | 1.58e-01 | 0.0246 |
| 222962 | SLC29A4 | HCC1 | Human | Liver | HCC | 1.33e-05 | 2.75e+00 | 0.5336 |
| 222962 | SLC29A4 | HCC2 | Human | Liver | HCC | 3.00e-28 | 2.73e+00 | 0.5341 |
| 222962 | SLC29A4 | S014 | Human | Liver | HCC | 1.63e-42 | 1.26e+00 | 0.2254 |
| 222962 | SLC29A4 | S015 | Human | Liver | HCC | 4.15e-38 | 1.44e+00 | 0.2375 |
| 222962 | SLC29A4 | S016 | Human | Liver | HCC | 3.13e-36 | 1.07e+00 | 0.2243 |
| 222962 | SLC29A4 | HTA12-15-2 | Human | Pancreas | PDAC | 4.47e-05 | 2.80e-01 | 0.2315 |
| 222962 | SLC29A4 | HTA12-25-1 | Human | Pancreas | PDAC | 3.68e-04 | 3.60e-01 | 0.313 |
| 222962 | SLC29A4 | HTA12-26-1 | Human | Pancreas | PDAC | 9.79e-17 | 6.13e-01 | 0.3728 |
| 222962 | SLC29A4 | HTA12-29-1 | Human | Pancreas | PDAC | 4.14e-35 | 7.00e-01 | 0.3722 |
| Page: 1 |
| Tissue | Expression Dynamics | Abbreviation |
| Liver | 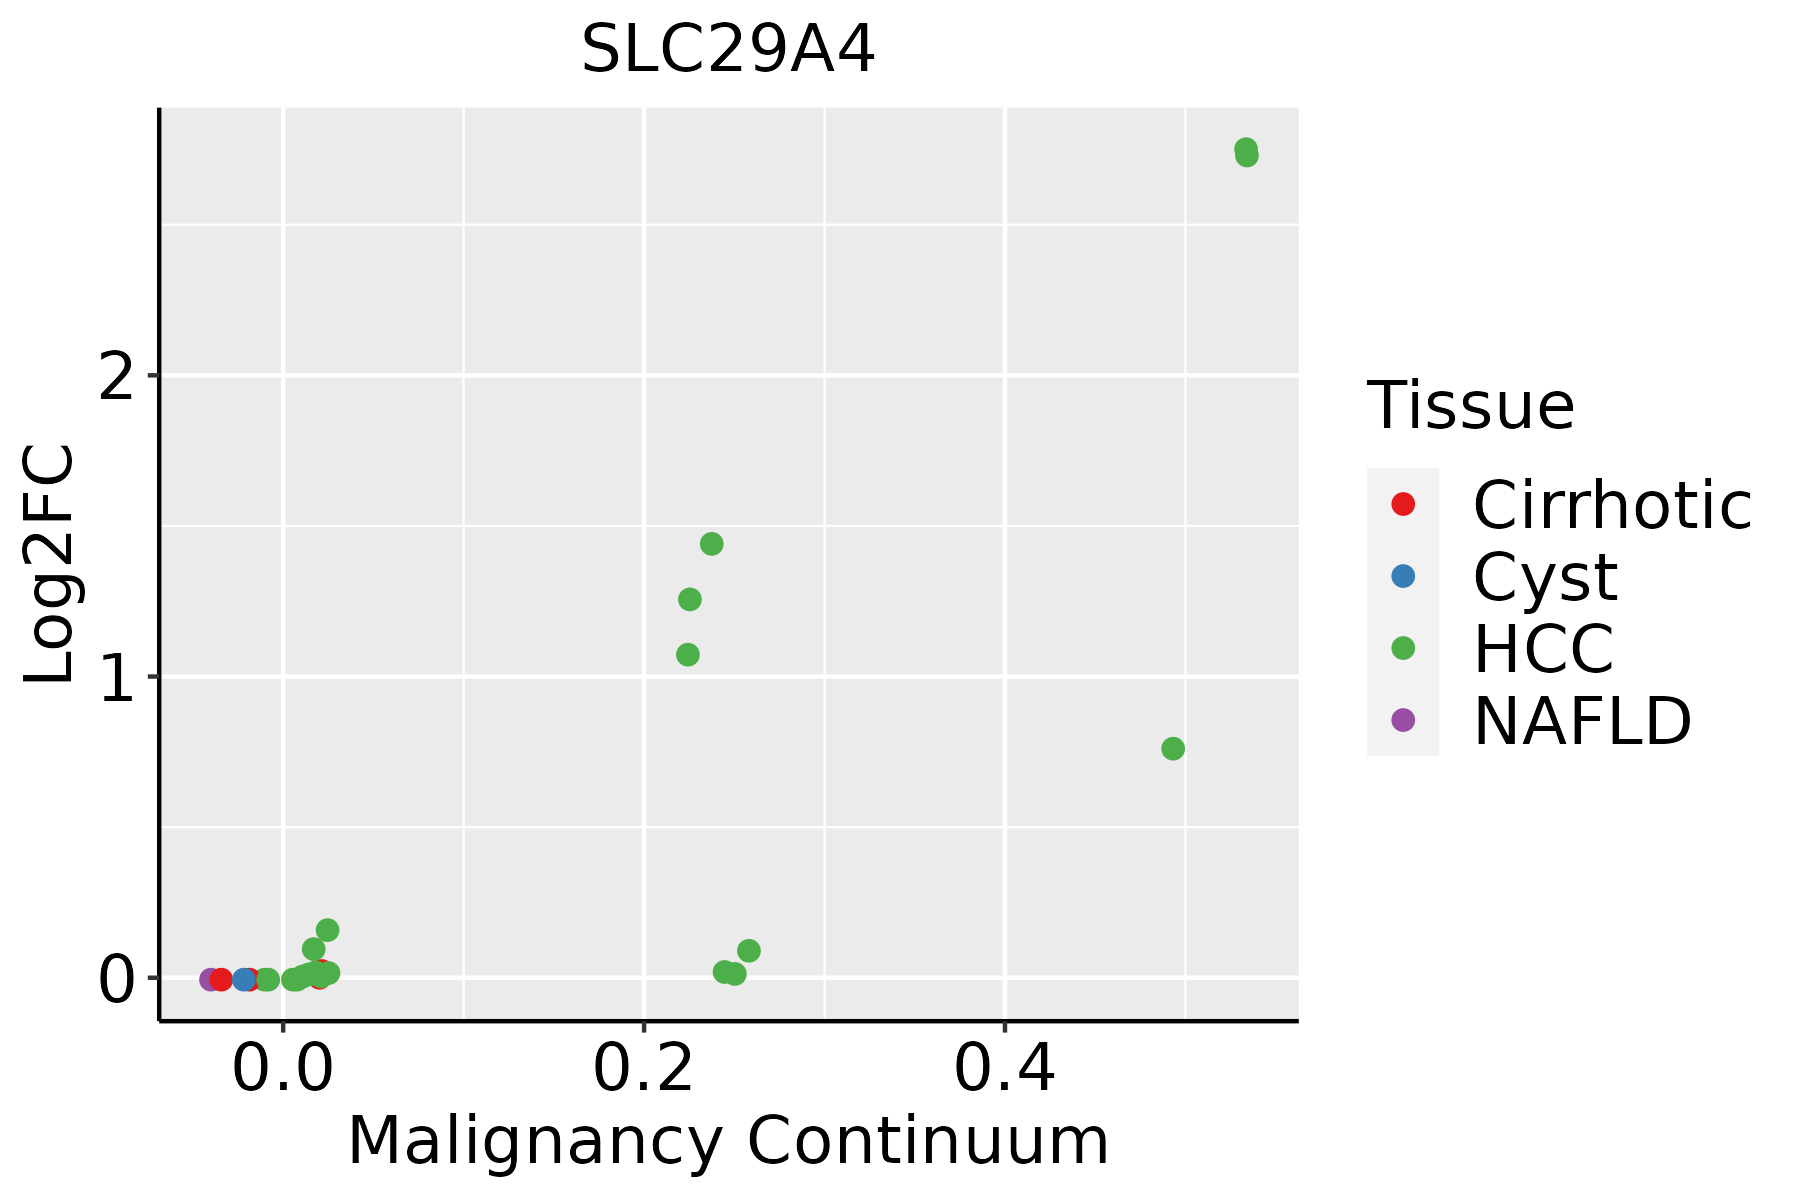 | HCC: Hepatocellular carcinoma |
| NAFLD: Non-alcoholic fatty liver disease |
| ∗log2FC in expression of this searched gene in stem-like cells from each diseased tissue sample relative to stem-like cells in normal samples in each tissue plotted against the malignancy continuum. Samples are colored based on if they are from different disease stage. |
Top |
Malignant transformation related pathway analysis |
| Find out the enriched GO biological processes and KEGG pathways involved in transition from healthy to precancer to cancer |
| Tissue | Disease Stage | Enriched GO biological Processes |
| Colorectum | AD |  |
| Colorectum | SER |  |
| Colorectum | MSS |  |
| Colorectum | MSI-H |  |
| Colorectum | FAP |  |
| ∗Top 15 enriched GO BP terms are showed in the bar plot of each disease state in each tissue. Each row represents a significant GO biological process which is colored according to the -log10(p.adjust). |
| Page: 1 2 3 4 5 6 7 8 9 |
| GO ID | Tissue | Disease Stage | Description | Gene Ratio | Bg Ratio | pvalue | p.adjust | Count |
| GO:001593111 | Liver | HCC | nucleobase-containing compound transport | 150/7958 | 222/18723 | 3.17e-14 | 2.03e-12 | 150 |
| GO:1901264 | Liver | HCC | carbohydrate derivative transport | 48/7958 | 80/18723 | 1.19e-03 | 6.62e-03 | 48 |
| GO:015010411 | Liver | HCC | transport across blood-brain barrier | 50/7958 | 87/18723 | 3.42e-03 | 1.55e-02 | 50 |
| GO:001023211 | Liver | HCC | vascular transport | 50/7958 | 88/18723 | 4.69e-03 | 2.02e-02 | 50 |
| Page: 1 |
| Pathway ID | Tissue | Disease Stage | Description | Gene Ratio | Bg Ratio | pvalue | p.adjust | qvalue | Count |
| Page: 1 |
Top |
Cell-cell communication analysis |
| Identification of potential cell-cell interactions between two cell types and their ligand-receptor pairs for different disease states |
| Ligand | Receptor | LRpair | Pathway | Tissue | Disease Stage |
| Page: 1 |
Top |
Single-cell gene regulatory network inference analysis |
| Find out the significant the regulons (TFs) and the target genes of each regulon across cell types for different disease states |
| TF | Cell Type | Tissue | Disease Stage | Target Gene | RSS | Regulon Activity |
| ∗The dot plots of a searched regulon are shown for all cell subpopulations in each disease state of each tissue based on the regulon specific score inferred using pySCENIC and by calculating the average expression. |
| Page: 1 |
Top |
Somatic mutation of malignant transformation related genes |
| Annotation of somatic variants for genes involved in malignant transformation |
| Hugo Symbol | Variant Class | Variant Classification | dbSNP RS | HGVSc | HGVSp | HGVSp Short | SWISSPROT | BIOTYPE | SIFT | PolyPhen | Tumor Sample Barcode | Tissue | Histology | Sex | Age | Stage | Therapy Types | Drugs | Outcome |
| SLC29A4 | SNV | Missense_Mutation | rs760181725 | c.40N>A | p.Val14Met | p.V14M | Q7RTT9 | protein_coding | tolerated_low_confidence(0.11) | benign(0.003) | TCGA-A2-A0EN-01 | Breast | breast invasive carcinoma | Female | >=65 | I/II | Hormone Therapy | tamoxiphen | SD |
| SLC29A4 | SNV | Missense_Mutation | c.1162N>T | p.Pro388Ser | p.P388S | Q7RTT9 | protein_coding | deleterious(0) | probably_damaging(1) | TCGA-A2-A0SW-01 | Breast | breast invasive carcinoma | Female | >=65 | III/IV | Hormone Therapy | arimidex | PD | |
| SLC29A4 | SNV | Missense_Mutation | rs544632146 | c.1001N>A | p.Arg334His | p.R334H | Q7RTT9 | protein_coding | tolerated(0.09) | benign(0.006) | TCGA-AC-A23H-01 | Breast | breast invasive carcinoma | Female | >=65 | I/II | Unknown | Unknown | PD |
| SLC29A4 | SNV | Missense_Mutation | rs757442875 | c.347C>T | p.Ala116Val | p.A116V | Q7RTT9 | protein_coding | deleterious(0) | possibly_damaging(0.871) | TCGA-AR-A2LR-01 | Breast | breast invasive carcinoma | Female | <65 | I/II | Chemotherapy | adriamycin | SD |
| SLC29A4 | SNV | Missense_Mutation | c.1162N>G | p.Pro388Ala | p.P388A | Q7RTT9 | protein_coding | deleterious(0) | probably_damaging(1) | TCGA-BH-A0DL-01 | Breast | breast invasive carcinoma | Female | <65 | I/II | Chemotherapy | cytoxan | CR | |
| SLC29A4 | SNV | Missense_Mutation | rs202005474 | c.463N>A | p.Val155Met | p.V155M | Q7RTT9 | protein_coding | deleterious(0) | possibly_damaging(0.487) | TCGA-EA-A1QS-01 | Cervix | cervical & endocervical cancer | Female | <65 | I/II | Unknown | Unknown | SD |
| SLC29A4 | SNV | Missense_Mutation | c.1293N>G | p.Phe431Leu | p.F431L | Q7RTT9 | protein_coding | tolerated(0.25) | benign(0.216) | TCGA-FU-A23L-01 | Cervix | cervical & endocervical cancer | Female | <65 | I/II | Chemotherapy | cisplatin | CR | |
| SLC29A4 | SNV | Missense_Mutation | c.1335N>A | p.His445Gln | p.H445Q | Q7RTT9 | protein_coding | tolerated(0.09) | probably_damaging(0.982) | TCGA-IR-A3LK-01 | Cervix | cervical & endocervical cancer | Female | >=65 | I/II | Chemotherapy | cisplatin | PD | |
| SLC29A4 | SNV | Missense_Mutation | rs774254094 | c.499G>A | p.Ala167Thr | p.A167T | Q7RTT9 | protein_coding | tolerated(0.36) | benign(0.013) | TCGA-VS-A94Z-01 | Cervix | cervical & endocervical cancer | Female | <65 | I/II | Chemotherapy | cisplatin | CR |
| SLC29A4 | SNV | Missense_Mutation | novel | c.1421A>G | p.Lys474Arg | p.K474R | Q7RTT9 | protein_coding | tolerated(0.07) | probably_damaging(0.914) | TCGA-AA-3984-01 | Colorectum | colon adenocarcinoma | Female | <65 | I/II | Unknown | Unknown | SD |
| Page: 1 2 3 4 5 6 |
Top |
Related drugs of malignant transformation related genes |
| Identification of chemicals and drugs interact with genes involved in malignant transfromation |
| (DGIdb 4.0) |
| Entrez ID | Symbol | Category | Interaction Types | Drug Claim Name | Drug Name | PMIDs |
| 222962 | SLC29A4 | EXTERNAL SIDE OF PLASMA MEMBRANE, TRANSPORTER | inhibitor | 135652709 | QUININE | |
| 222962 | SLC29A4 | EXTERNAL SIDE OF PLASMA MEMBRANE, TRANSPORTER | inhibitor | 252166690 | ||
| 222962 | SLC29A4 | EXTERNAL SIDE OF PLASMA MEMBRANE, TRANSPORTER | inhibitor | 135650270 | FLUOXETINE | |
| 222962 | SLC29A4 | EXTERNAL SIDE OF PLASMA MEMBRANE, TRANSPORTER | metformin | METFORMIN | 22722338 | |
| 222962 | SLC29A4 | EXTERNAL SIDE OF PLASMA MEMBRANE, TRANSPORTER | inhibitor | 178101327 | RHODAMINE123 | |
| 222962 | SLC29A4 | EXTERNAL SIDE OF PLASMA MEMBRANE, TRANSPORTER | HISTAMINE | HISTAMINE | 22396231 | |
| 222962 | SLC29A4 | EXTERNAL SIDE OF PLASMA MEMBRANE, TRANSPORTER | inhibitor | 135651305 | VERAPAMIL | |
| 222962 | SLC29A4 | EXTERNAL SIDE OF PLASMA MEMBRANE, TRANSPORTER | inhibitor | 178101509 | DIPYRIDAMOLE | |
| 222962 | SLC29A4 | EXTERNAL SIDE OF PLASMA MEMBRANE, TRANSPORTER | inhibitor | 135650872 | QUINIDINE | |
| 222962 | SLC29A4 | EXTERNAL SIDE OF PLASMA MEMBRANE, TRANSPORTER | inhibitor | 135650171 | DESIPRAMINE |
| Page: 1 2 |

Copyright 2023-Present -The University of Texas Health Science Center at Houston |