
|
|||||
|
 | |
| |
| |
| |
| |
| |
|
Gene: SLC27A6 |
Gene summary for SLC27A6 |
| Gene information | Species | Human | Gene symbol | SLC27A6 | Gene ID | 28965 |
| Gene name | solute carrier family 27 member 6 | |
| Gene Alias | ACSVL2 | |
| Cytomap | 5q23.3 | |
| Gene Type | protein-coding | GO ID | GO:0000038 | UniProtAcc | Q9Y2P4 |
Top |
Malignant transformation analysis |
| Identification of the aberrant gene expression in precancerous and cancerous lesions by comparing the gene expression of stem-like cells in diseased tissues with normal stem cells |
| Entrez ID | Symbol | Replicates | Species | Organ | Tissue | Adj P-value | Log2FC | Malignancy |
| 28965 | SLC27A6 | HTA11_99999970781_79442 | Human | Colorectum | MSS | 3.61e-02 | -1.26e-01 | 0.294 |
| 28965 | SLC27A6 | A015-C-203 | Human | Colorectum | FAP | 4.63e-48 | 1.26e+00 | -0.1294 |
| 28965 | SLC27A6 | A015-C-204 | Human | Colorectum | FAP | 3.53e-21 | 8.66e-01 | -0.0228 |
| 28965 | SLC27A6 | A014-C-040 | Human | Colorectum | FAP | 3.09e-13 | 1.06e+00 | -0.1184 |
| 28965 | SLC27A6 | A002-C-201 | Human | Colorectum | FAP | 6.69e-31 | 9.98e-01 | 0.0324 |
| 28965 | SLC27A6 | A002-C-203 | Human | Colorectum | FAP | 1.96e-02 | 3.42e-01 | 0.2786 |
| 28965 | SLC27A6 | A001-C-119 | Human | Colorectum | FAP | 1.87e-09 | 6.71e-01 | -0.1557 |
| 28965 | SLC27A6 | A002-C-205 | Human | Colorectum | FAP | 4.14e-02 | 3.35e-01 | -0.1236 |
| 28965 | SLC27A6 | A014-C-108 | Human | Colorectum | FAP | 2.43e-05 | 4.52e-01 | -0.124 |
| 28965 | SLC27A6 | A001-C-104 | Human | Colorectum | FAP | 1.36e-05 | 4.26e-01 | 0.0184 |
| 28965 | SLC27A6 | A015-C-006 | Human | Colorectum | FAP | 6.99e-06 | 5.30e-01 | -0.0994 |
| 28965 | SLC27A6 | A002-C-116 | Human | Colorectum | FAP | 6.50e-31 | 1.01e+00 | -0.0452 |
| 28965 | SLC27A6 | CRC-1-8810 | Human | Colorectum | CRC | 1.20e-09 | 4.90e-01 | 0.6257 |
| 28965 | SLC27A6 | CRC-3-11773 | Human | Colorectum | CRC | 4.70e-49 | 1.24e+00 | 0.2564 |
| 28965 | SLC27A6 | male-WTA | Human | Thyroid | PTC | 9.64e-45 | 5.35e-01 | 0.1037 |
| 28965 | SLC27A6 | PTC01 | Human | Thyroid | PTC | 1.46e-18 | 4.57e-01 | 0.1899 |
| 28965 | SLC27A6 | PTC04 | Human | Thyroid | PTC | 1.68e-10 | 2.03e-01 | 0.1927 |
| 28965 | SLC27A6 | PTC05 | Human | Thyroid | PTC | 8.06e-15 | 7.82e-01 | 0.2065 |
| 28965 | SLC27A6 | PTC06 | Human | Thyroid | PTC | 7.25e-32 | 9.12e-01 | 0.2057 |
| 28965 | SLC27A6 | PTC07 | Human | Thyroid | PTC | 1.04e-30 | 7.61e-01 | 0.2044 |
| Page: 1 |
| Tissue | Expression Dynamics | Abbreviation |
| Colorectum (GSE201348) | 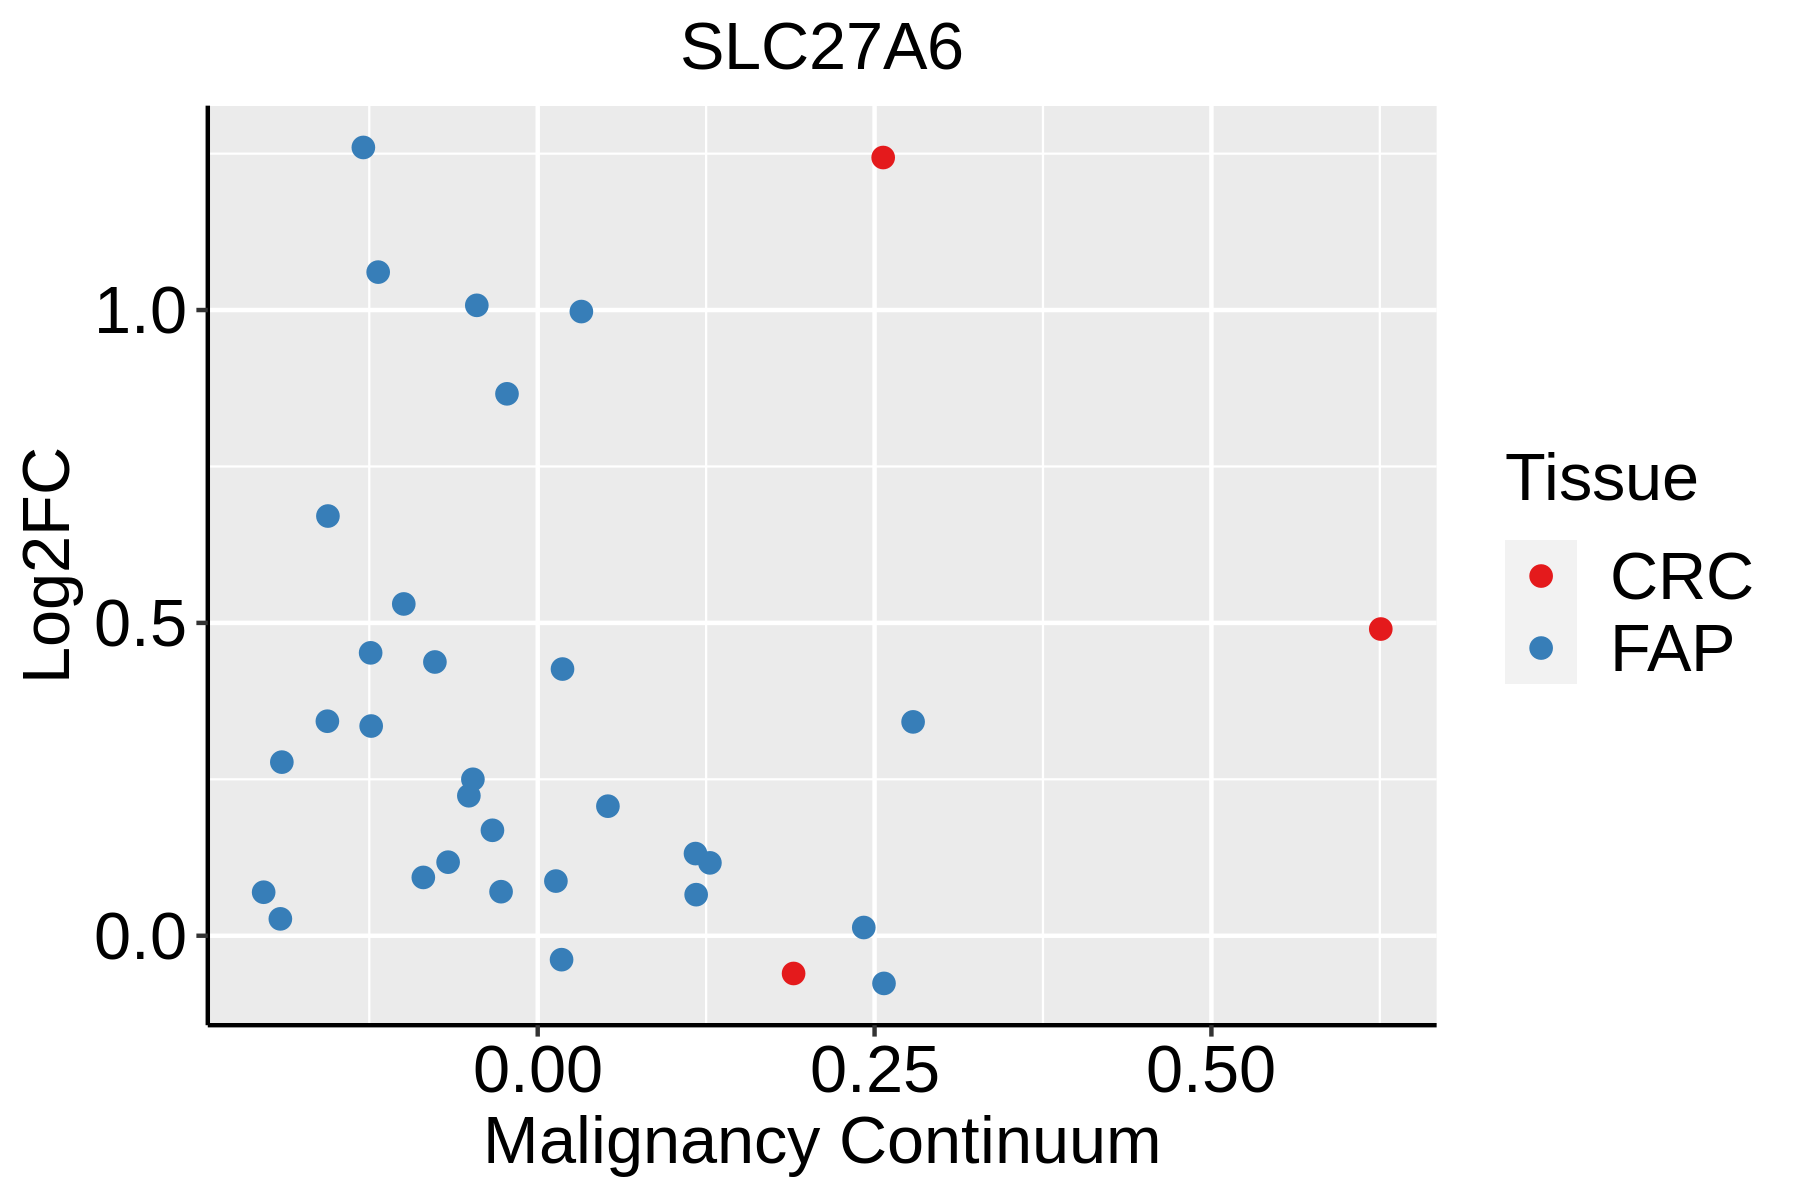 | FAP: Familial adenomatous polyposis |
| CRC: Colorectal cancer | ||
| Colorectum (HTA11) |  | AD: Adenomas |
| SER: Sessile serrated lesions | ||
| MSI-H: Microsatellite-high colorectal cancer | ||
| MSS: Microsatellite stable colorectal cancer | ||
| Thyroid | 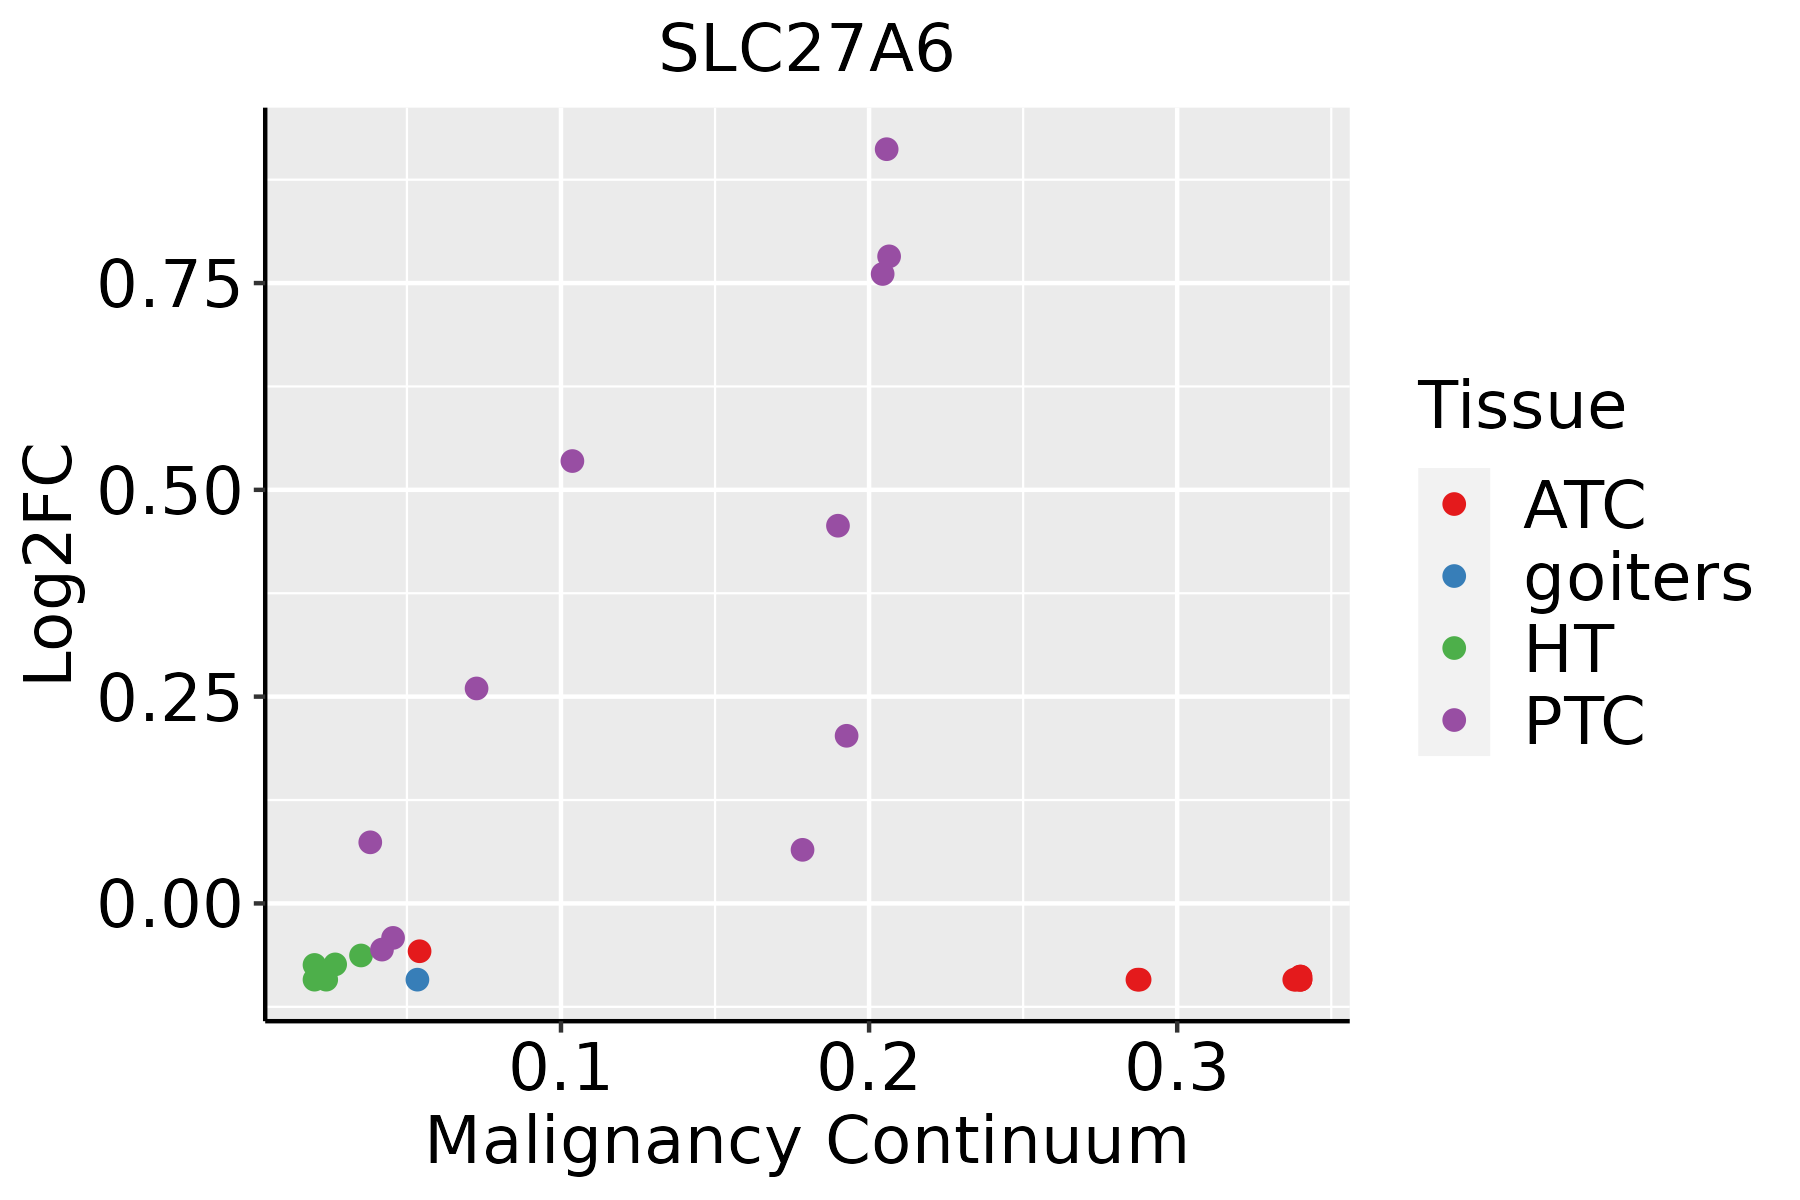 | ATC: Anaplastic thyroid cancer |
| HT: Hashimoto's thyroiditis | ||
| PTC: Papillary thyroid cancer |
| ∗log2FC in expression of this searched gene in stem-like cells from each diseased tissue sample relative to stem-like cells in normal samples in each tissue plotted against the malignancy continuum. Samples are colored based on if they are from different disease stage. |
Top |
Malignant transformation related pathway analysis |
| Find out the enriched GO biological processes and KEGG pathways involved in transition from healthy to precancer to cancer |
| Tissue | Disease Stage | Enriched GO biological Processes |
| Colorectum | AD |  |
| Colorectum | SER |  |
| Colorectum | MSS |  |
| Colorectum | MSI-H |  |
| Colorectum | FAP |  |
| ∗Top 15 enriched GO BP terms are showed in the bar plot of each disease state in each tissue. Each row represents a significant GO biological process which is colored according to the -log10(p.adjust). |
| Page: 1 2 3 4 5 6 7 8 9 |
| GO ID | Tissue | Disease Stage | Description | Gene Ratio | Bg Ratio | pvalue | p.adjust | Count |
| GO:00066312 | Colorectum | MSS | fatty acid metabolic process | 95/3467 | 390/18723 | 2.20e-03 | 1.84e-02 | 95 |
| GO:00108761 | Colorectum | MSS | lipid localization | 104/3467 | 448/18723 | 6.76e-03 | 4.38e-02 | 104 |
| GO:00066313 | Colorectum | FAP | fatty acid metabolic process | 81/2622 | 390/18723 | 1.43e-04 | 2.24e-03 | 81 |
| GO:00068691 | Colorectum | FAP | lipid transport | 81/2622 | 398/18723 | 2.84e-04 | 3.76e-03 | 81 |
| GO:00108762 | Colorectum | FAP | lipid localization | 85/2622 | 448/18723 | 1.92e-03 | 1.63e-02 | 85 |
| GO:0015908 | Colorectum | FAP | fatty acid transport | 21/2622 | 86/18723 | 6.79e-03 | 4.17e-02 | 21 |
| GO:00066314 | Colorectum | CRC | fatty acid metabolic process | 65/2078 | 390/18723 | 5.30e-04 | 7.42e-03 | 65 |
| GO:00068692 | Colorectum | CRC | lipid transport | 63/2078 | 398/18723 | 2.36e-03 | 2.26e-02 | 63 |
| GO:00108763 | Colorectum | CRC | lipid localization | 68/2078 | 448/18723 | 4.60e-03 | 3.58e-02 | 68 |
| Page: 1 |
| Pathway ID | Tissue | Disease Stage | Description | Gene Ratio | Bg Ratio | pvalue | p.adjust | qvalue | Count |
| hsa04931 | Colorectum | MSS | Insulin resistance | 36/1875 | 108/8465 | 4.74e-03 | 2.01e-02 | 1.23e-02 | 36 |
| hsa049311 | Colorectum | MSS | Insulin resistance | 36/1875 | 108/8465 | 4.74e-03 | 2.01e-02 | 1.23e-02 | 36 |
| hsa049312 | Colorectum | FAP | Insulin resistance | 32/1404 | 108/8465 | 4.90e-04 | 3.56e-03 | 2.16e-03 | 32 |
| hsa049313 | Colorectum | FAP | Insulin resistance | 32/1404 | 108/8465 | 4.90e-04 | 3.56e-03 | 2.16e-03 | 32 |
| hsa049314 | Colorectum | CRC | Insulin resistance | 28/1091 | 108/8465 | 1.78e-04 | 2.37e-03 | 1.61e-03 | 28 |
| hsa049315 | Colorectum | CRC | Insulin resistance | 28/1091 | 108/8465 | 1.78e-04 | 2.37e-03 | 1.61e-03 | 28 |
| Page: 1 |
Top |
Cell-cell communication analysis |
| Identification of potential cell-cell interactions between two cell types and their ligand-receptor pairs for different disease states |
| Ligand | Receptor | LRpair | Pathway | Tissue | Disease Stage |
| Page: 1 |
Top |
Single-cell gene regulatory network inference analysis |
| Find out the significant the regulons (TFs) and the target genes of each regulon across cell types for different disease states |
| TF | Cell Type | Tissue | Disease Stage | Target Gene | RSS | Regulon Activity |
| ∗The dot plots of a searched regulon are shown for all cell subpopulations in each disease state of each tissue based on the regulon specific score inferred using pySCENIC and by calculating the average expression. |
| Page: 1 |
Top |
Somatic mutation of malignant transformation related genes |
| Annotation of somatic variants for genes involved in malignant transformation |
| Hugo Symbol | Variant Class | Variant Classification | dbSNP RS | HGVSc | HGVSp | HGVSp Short | SWISSPROT | BIOTYPE | SIFT | PolyPhen | Tumor Sample Barcode | Tissue | Histology | Sex | Age | Stage | Therapy Types | Drugs | Outcome |
| SLC27A6 | SNV | Missense_Mutation | c.151N>A | p.Gly51Arg | p.G51R | Q9Y2P4 | protein_coding | tolerated(0.81) | benign(0.007) | TCGA-BH-A0HF-01 | Breast | breast invasive carcinoma | Female | >=65 | I/II | Hormone Therapy | arimidex | SD | |
| SLC27A6 | SNV | Missense_Mutation | rs778742697 | c.1582A>C | p.Ile528Leu | p.I528L | Q9Y2P4 | protein_coding | tolerated(0.28) | benign(0.011) | TCGA-E2-A1LL-01 | Breast | breast invasive carcinoma | Female | >=65 | III/IV | Chemotherapy | docetaxel | PD |
| SLC27A6 | SNV | Missense_Mutation | c.391G>A | p.Val131Met | p.V131M | Q9Y2P4 | protein_coding | tolerated(0.08) | possibly_damaging(0.879) | TCGA-2W-A8YY-01 | Cervix | cervical & endocervical cancer | Female | <65 | I/II | Chemotherapy | cisplatin | CR | |
| SLC27A6 | SNV | Missense_Mutation | c.1573A>G | p.Met525Val | p.M525V | Q9Y2P4 | protein_coding | deleterious(0) | probably_damaging(0.967) | TCGA-2W-A8YY-01 | Cervix | cervical & endocervical cancer | Female | <65 | I/II | Chemotherapy | cisplatin | CR | |
| SLC27A6 | SNV | Missense_Mutation | rs760437774 | c.1544C>T | p.Ala515Val | p.A515V | Q9Y2P4 | protein_coding | tolerated(0.09) | benign(0.003) | TCGA-EA-A410-01 | Cervix | cervical & endocervical cancer | Female | <65 | I/II | Unknown | Unknown | SD |
| SLC27A6 | SNV | Missense_Mutation | c.1685A>G | p.Glu562Gly | p.E562G | Q9Y2P4 | protein_coding | deleterious(0.03) | benign(0.014) | TCGA-EA-A410-01 | Cervix | cervical & endocervical cancer | Female | <65 | I/II | Unknown | Unknown | SD | |
| SLC27A6 | SNV | Missense_Mutation | novel | c.312N>T | p.Lys104Asn | p.K104N | Q9Y2P4 | protein_coding | deleterious(0.04) | benign(0.288) | TCGA-A6-2672-01 | Colorectum | colon adenocarcinoma | Female | >=65 | III/IV | Unknown | Unknown | SD |
| SLC27A6 | SNV | Missense_Mutation | rs201193988 | c.1093N>A | p.Glu365Lys | p.E365K | Q9Y2P4 | protein_coding | deleterious(0) | probably_damaging(0.999) | TCGA-AA-3510-01 | Colorectum | colon adenocarcinoma | Male | >=65 | I/II | Unknown | Unknown | SD |
| SLC27A6 | SNV | Missense_Mutation | c.1408N>A | p.Gln470Lys | p.Q470K | Q9Y2P4 | protein_coding | tolerated(0.27) | benign(0.012) | TCGA-AA-3660-01 | Colorectum | colon adenocarcinoma | Female | <65 | I/II | Unknown | Unknown | SD | |
| SLC27A6 | SNV | Missense_Mutation | novel | c.655N>C | p.Cys219Arg | p.C219R | Q9Y2P4 | protein_coding | deleterious(0.04) | benign(0.222) | TCGA-AA-3947-01 | Colorectum | colon adenocarcinoma | Female | <65 | I/II | Unknown | Unknown | SD |
| Page: 1 2 3 4 5 6 7 8 9 10 11 12 |
Top |
Related drugs of malignant transformation related genes |
| Identification of chemicals and drugs interact with genes involved in malignant transfromation |
| (DGIdb 4.0) |
| Entrez ID | Symbol | Category | Interaction Types | Drug Claim Name | Drug Name | PMIDs |
| Page: 1 |

Copyright 2023-Present -The University of Texas Health Science Center at Houston |