
|
|||||
|
 | |
| |
| |
| |
| |
| |
|
Gene: SLC27A5 |
Gene summary for SLC27A5 |
| Gene information | Species | Human | Gene symbol | SLC27A5 | Gene ID | 10998 |
| Gene name | solute carrier family 27 member 5 | |
| Gene Alias | ACSB | |
| Cytomap | 19q13.43 | |
| Gene Type | protein-coding | GO ID | GO:0000038 | UniProtAcc | Q9Y2P5 |
Top |
Malignant transformation analysis |
| Identification of the aberrant gene expression in precancerous and cancerous lesions by comparing the gene expression of stem-like cells in diseased tissues with normal stem cells |
| Entrez ID | Symbol | Replicates | Species | Organ | Tissue | Adj P-value | Log2FC | Malignancy |
| 10998 | SLC27A5 | LZE2T | Human | Esophagus | ESCC | 3.57e-05 | 5.79e-01 | 0.082 |
| 10998 | SLC27A5 | LZE24T | Human | Esophagus | ESCC | 4.52e-15 | 4.33e-01 | 0.0596 |
| 10998 | SLC27A5 | P2T-E | Human | Esophagus | ESCC | 5.68e-06 | 9.16e-02 | 0.1177 |
| 10998 | SLC27A5 | P4T-E | Human | Esophagus | ESCC | 9.10e-22 | 4.79e-01 | 0.1323 |
| 10998 | SLC27A5 | P5T-E | Human | Esophagus | ESCC | 1.93e-09 | 2.14e-01 | 0.1327 |
| 10998 | SLC27A5 | P8T-E | Human | Esophagus | ESCC | 2.75e-07 | 1.46e-01 | 0.0889 |
| 10998 | SLC27A5 | P10T-E | Human | Esophagus | ESCC | 2.64e-31 | 5.54e-01 | 0.116 |
| 10998 | SLC27A5 | P12T-E | Human | Esophagus | ESCC | 6.04e-14 | 2.46e-01 | 0.1122 |
| 10998 | SLC27A5 | P15T-E | Human | Esophagus | ESCC | 2.44e-03 | 1.35e-01 | 0.1149 |
| 10998 | SLC27A5 | P16T-E | Human | Esophagus | ESCC | 8.66e-16 | 2.03e-01 | 0.1153 |
| 10998 | SLC27A5 | P17T-E | Human | Esophagus | ESCC | 1.32e-03 | 2.25e-01 | 0.1278 |
| 10998 | SLC27A5 | P21T-E | Human | Esophagus | ESCC | 9.92e-09 | 1.57e-01 | 0.1617 |
| 10998 | SLC27A5 | P22T-E | Human | Esophagus | ESCC | 3.26e-17 | 3.46e-01 | 0.1236 |
| 10998 | SLC27A5 | P23T-E | Human | Esophagus | ESCC | 7.80e-36 | 8.10e-01 | 0.108 |
| 10998 | SLC27A5 | P24T-E | Human | Esophagus | ESCC | 3.06e-05 | 8.38e-02 | 0.1287 |
| 10998 | SLC27A5 | P26T-E | Human | Esophagus | ESCC | 4.11e-49 | 8.68e-01 | 0.1276 |
| 10998 | SLC27A5 | P27T-E | Human | Esophagus | ESCC | 1.19e-26 | 5.28e-01 | 0.1055 |
| 10998 | SLC27A5 | P28T-E | Human | Esophagus | ESCC | 7.52e-29 | 6.29e-01 | 0.1149 |
| 10998 | SLC27A5 | P30T-E | Human | Esophagus | ESCC | 4.11e-27 | 1.53e+00 | 0.137 |
| 10998 | SLC27A5 | P31T-E | Human | Esophagus | ESCC | 1.15e-16 | 4.61e-01 | 0.1251 |
| Page: 1 2 3 |
| Tissue | Expression Dynamics | Abbreviation |
| Esophagus |  | ESCC: Esophageal squamous cell carcinoma |
| HGIN: High-grade intraepithelial neoplasias | ||
| LGIN: Low-grade intraepithelial neoplasias | ||
| Liver | 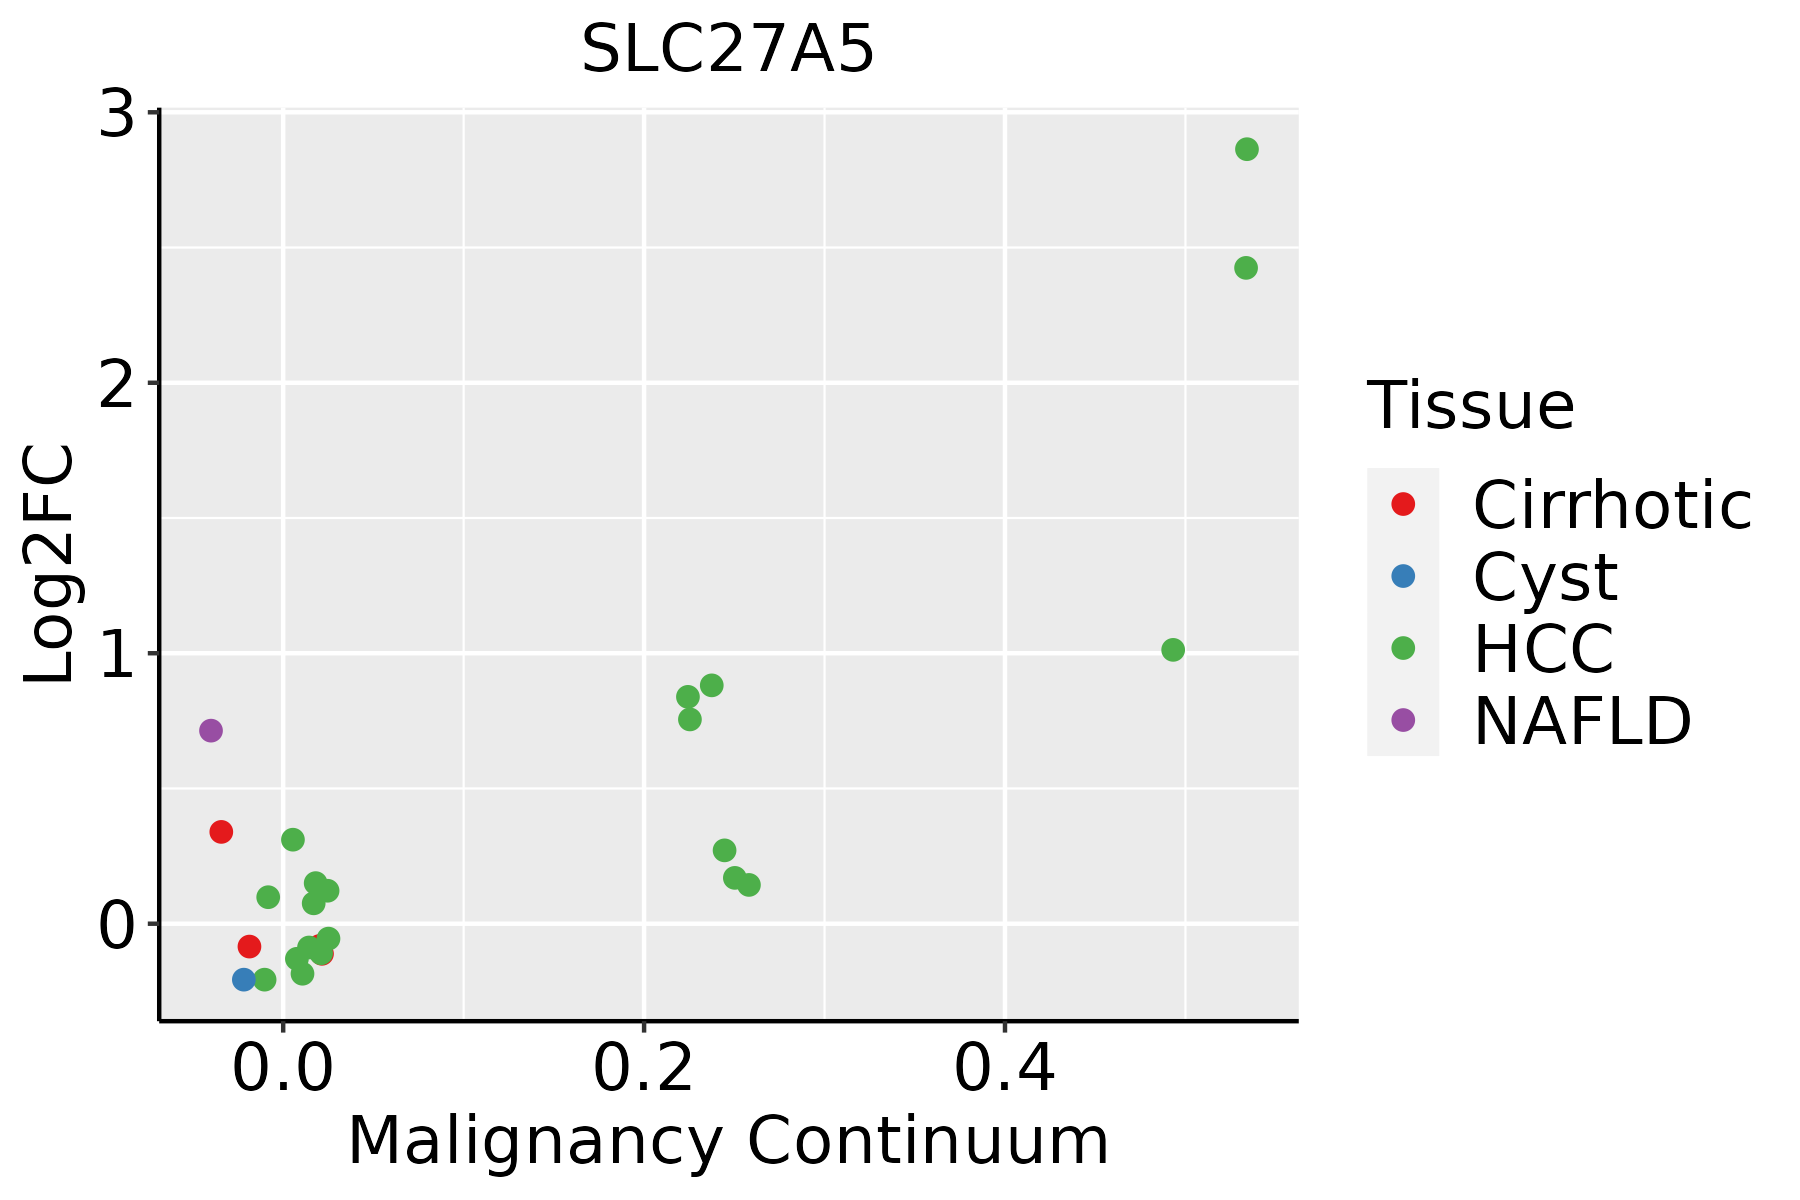 | HCC: Hepatocellular carcinoma |
| NAFLD: Non-alcoholic fatty liver disease |
| ∗log2FC in expression of this searched gene in stem-like cells from each diseased tissue sample relative to stem-like cells in normal samples in each tissue plotted against the malignancy continuum. Samples are colored based on if they are from different disease stage. |
Top |
Malignant transformation related pathway analysis |
| Find out the enriched GO biological processes and KEGG pathways involved in transition from healthy to precancer to cancer |
| Tissue | Disease Stage | Enriched GO biological Processes |
| Colorectum | AD |  |
| Colorectum | SER |  |
| Colorectum | MSS |  |
| Colorectum | MSI-H |  |
| Colorectum | FAP |  |
| ∗Top 15 enriched GO BP terms are showed in the bar plot of each disease state in each tissue. Each row represents a significant GO biological process which is colored according to the -log10(p.adjust). |
| Page: 1 2 3 4 5 6 7 8 9 |
| GO ID | Tissue | Disease Stage | Description | Gene Ratio | Bg Ratio | pvalue | p.adjust | Count |
| GO:0006091110 | Esophagus | ESCC | generation of precursor metabolites and energy | 331/8552 | 490/18723 | 3.86e-23 | 8.45e-21 | 331 |
| GO:00066318 | Esophagus | ESCC | fatty acid metabolic process | 217/8552 | 390/18723 | 4.21e-05 | 3.39e-04 | 217 |
| GO:00463948 | Esophagus | ESCC | carboxylic acid biosynthetic process | 175/8552 | 314/18723 | 1.98e-04 | 1.26e-03 | 175 |
| GO:00160538 | Esophagus | ESCC | organic acid biosynthetic process | 175/8552 | 316/18723 | 3.04e-04 | 1.82e-03 | 175 |
| GO:00464864 | Esophagus | ESCC | glycerolipid metabolic process | 211/8552 | 392/18723 | 6.51e-04 | 3.46e-03 | 211 |
| GO:00066946 | Esophagus | ESCC | steroid biosynthetic process | 98/8552 | 173/18723 | 2.34e-03 | 1.03e-02 | 98 |
| GO:00159111 | Esophagus | ESCC | long-chain fatty acid import across plasma membrane | 9/8552 | 10/18723 | 5.09e-03 | 1.92e-02 | 9 |
| GO:19016174 | Esophagus | ESCC | organic hydroxy compound biosynthetic process | 128/8552 | 237/18723 | 5.86e-03 | 2.16e-02 | 128 |
| GO:00445391 | Esophagus | ESCC | long-chain fatty acid import into cell | 13/8552 | 17/18723 | 1.00e-02 | 3.42e-02 | 13 |
| GO:01403541 | Esophagus | ESCC | lipid import into cell | 13/8552 | 17/18723 | 1.00e-02 | 3.42e-02 | 13 |
| GO:00066316 | Liver | NAFLD | fatty acid metabolic process | 92/1882 | 390/18723 | 3.38e-15 | 3.29e-12 | 92 |
| GO:00160535 | Liver | NAFLD | organic acid biosynthetic process | 77/1882 | 316/18723 | 1.03e-13 | 6.69e-11 | 77 |
| GO:00463945 | Liver | NAFLD | carboxylic acid biosynthetic process | 75/1882 | 314/18723 | 6.37e-13 | 3.39e-10 | 75 |
| GO:00082023 | Liver | NAFLD | steroid metabolic process | 69/1882 | 319/18723 | 5.90e-10 | 1.28e-07 | 69 |
| GO:00066413 | Liver | NAFLD | triglyceride metabolic process | 29/1882 | 100/18723 | 9.51e-08 | 7.62e-06 | 29 |
| GO:0008206 | Liver | NAFLD | bile acid metabolic process | 19/1882 | 49/18723 | 9.82e-08 | 7.76e-06 | 19 |
| GO:00108765 | Liver | NAFLD | lipid localization | 79/1882 | 448/18723 | 4.75e-07 | 2.92e-05 | 79 |
| GO:00723303 | Liver | NAFLD | monocarboxylic acid biosynthetic process | 46/1882 | 214/18723 | 5.06e-07 | 3.07e-05 | 46 |
| GO:00060917 | Liver | NAFLD | generation of precursor metabolites and energy | 84/1882 | 490/18723 | 7.03e-07 | 3.95e-05 | 84 |
| GO:00066392 | Liver | NAFLD | acylglycerol metabolic process | 32/1882 | 128/18723 | 8.82e-07 | 4.60e-05 | 32 |
| Page: 1 2 3 4 |
| Pathway ID | Tissue | Disease Stage | Description | Gene Ratio | Bg Ratio | pvalue | p.adjust | qvalue | Count |
| hsa049318 | Esophagus | ESCC | Insulin resistance | 69/4205 | 108/8465 | 1.92e-03 | 5.54e-03 | 2.84e-03 | 69 |
| hsa0493113 | Esophagus | ESCC | Insulin resistance | 69/4205 | 108/8465 | 1.92e-03 | 5.54e-03 | 2.84e-03 | 69 |
| hsa033206 | Liver | NAFLD | PPAR signaling pathway | 25/1043 | 75/8465 | 1.61e-06 | 6.62e-05 | 5.33e-05 | 25 |
| hsa049316 | Liver | NAFLD | Insulin resistance | 29/1043 | 108/8465 | 3.01e-05 | 7.59e-04 | 6.11e-04 | 29 |
| hsa049762 | Liver | NAFLD | Bile secretion | 20/1043 | 89/8465 | 5.08e-03 | 4.43e-02 | 3.57e-02 | 20 |
| hsa0332011 | Liver | NAFLD | PPAR signaling pathway | 25/1043 | 75/8465 | 1.61e-06 | 6.62e-05 | 5.33e-05 | 25 |
| hsa0493111 | Liver | NAFLD | Insulin resistance | 29/1043 | 108/8465 | 3.01e-05 | 7.59e-04 | 6.11e-04 | 29 |
| hsa0497611 | Liver | NAFLD | Bile secretion | 20/1043 | 89/8465 | 5.08e-03 | 4.43e-02 | 3.57e-02 | 20 |
| hsa0332021 | Liver | Cirrhotic | PPAR signaling pathway | 32/2530 | 75/8465 | 1.24e-02 | 3.92e-02 | 2.42e-02 | 32 |
| hsa0332031 | Liver | Cirrhotic | PPAR signaling pathway | 32/2530 | 75/8465 | 1.24e-02 | 3.92e-02 | 2.42e-02 | 32 |
| hsa0493121 | Liver | HCC | Insulin resistance | 77/4020 | 108/8465 | 3.89e-07 | 4.46e-06 | 2.48e-06 | 77 |
| hsa033204 | Liver | HCC | PPAR signaling pathway | 48/4020 | 75/8465 | 2.83e-03 | 9.37e-03 | 5.21e-03 | 48 |
| hsa001202 | Liver | HCC | Primary bile acid biosynthesis | 14/4020 | 17/8465 | 3.49e-03 | 1.12e-02 | 6.22e-03 | 14 |
| hsa0493131 | Liver | HCC | Insulin resistance | 77/4020 | 108/8465 | 3.89e-07 | 4.46e-06 | 2.48e-06 | 77 |
| hsa033205 | Liver | HCC | PPAR signaling pathway | 48/4020 | 75/8465 | 2.83e-03 | 9.37e-03 | 5.21e-03 | 48 |
| hsa001203 | Liver | HCC | Primary bile acid biosynthesis | 14/4020 | 17/8465 | 3.49e-03 | 1.12e-02 | 6.22e-03 | 14 |
| Page: 1 |
Top |
Cell-cell communication analysis |
| Identification of potential cell-cell interactions between two cell types and their ligand-receptor pairs for different disease states |
| Ligand | Receptor | LRpair | Pathway | Tissue | Disease Stage |
| Page: 1 |
Top |
Single-cell gene regulatory network inference analysis |
| Find out the significant the regulons (TFs) and the target genes of each regulon across cell types for different disease states |
| TF | Cell Type | Tissue | Disease Stage | Target Gene | RSS | Regulon Activity |
| ∗The dot plots of a searched regulon are shown for all cell subpopulations in each disease state of each tissue based on the regulon specific score inferred using pySCENIC and by calculating the average expression. |
| Page: 1 |
Top |
Somatic mutation of malignant transformation related genes |
| Annotation of somatic variants for genes involved in malignant transformation |
| Hugo Symbol | Variant Class | Variant Classification | dbSNP RS | HGVSc | HGVSp | HGVSp Short | SWISSPROT | BIOTYPE | SIFT | PolyPhen | Tumor Sample Barcode | Tissue | Histology | Sex | Age | Stage | Therapy Types | Drugs | Outcome |
| SLC27A5 | SNV | Missense_Mutation | c.1753G>A | p.Val585Met | p.V585M | Q9Y2P5 | protein_coding | deleterious(0.02) | probably_damaging(0.996) | TCGA-BH-A0BQ-01 | Breast | breast invasive carcinoma | Female | <65 | I/II | Unknown | Unknown | PD | |
| SLC27A5 | SNV | Missense_Mutation | c.2057N>A | p.Gly686Glu | p.G686E | Q9Y2P5 | protein_coding | deleterious(0.04) | benign(0.41) | TCGA-C8-A274-01 | Breast | breast invasive carcinoma | Female | <65 | I/II | Hormone Therapy | tamoxiphen | SD | |
| SLC27A5 | SNV | Missense_Mutation | c.951G>C | p.Lys317Asn | p.K317N | Q9Y2P5 | protein_coding | tolerated(0.48) | benign(0.003) | TCGA-EK-A3GK-01 | Cervix | cervical & endocervical cancer | Female | <65 | I/II | Unknown | Unknown | SD | |
| SLC27A5 | SNV | Missense_Mutation | c.1769N>C | p.Cys590Ser | p.C590S | Q9Y2P5 | protein_coding | tolerated(0.38) | benign(0.416) | TCGA-EX-A69L-01 | Cervix | cervical & endocervical cancer | Female | <65 | I/II | Unknown | Unknown | SD | |
| SLC27A5 | SNV | Missense_Mutation | c.490N>C | p.Gly164Arg | p.G164R | Q9Y2P5 | protein_coding | deleterious(0.02) | benign(0.419) | TCGA-FU-A3NI-01 | Cervix | cervical & endocervical cancer | Female | <65 | I/II | Unknown | Unknown | SD | |
| SLC27A5 | SNV | Missense_Mutation | novel | c.1696G>A | p.Glu566Lys | p.E566K | Q9Y2P5 | protein_coding | deleterious(0) | probably_damaging(1) | TCGA-JW-A5VL-01 | Cervix | cervical & endocervical cancer | Female | <65 | I/II | Unknown | Unknown | SD |
| SLC27A5 | SNV | Missense_Mutation | rs780265922 | c.421G>A | p.Gly141Ser | p.G141S | Q9Y2P5 | protein_coding | tolerated(0.73) | benign(0) | TCGA-Q1-A6DV-01 | Cervix | cervical & endocervical cancer | Female | <65 | I/II | Unknown | Unknown | SD |
| SLC27A5 | SNV | Missense_Mutation | novel | c.615N>A | p.Asn205Lys | p.N205K | Q9Y2P5 | protein_coding | deleterious(0) | probably_damaging(0.999) | TCGA-VS-A8QC-01 | Cervix | cervical & endocervical cancer | Female | <65 | I/II | Chemotherapy | paclitaxel | PD |
| SLC27A5 | deletion | Frame_Shift_Del | novel | c.1809delN | p.Gly604AlafsTer40 | p.G604Afs*40 | Q9Y2P5 | protein_coding | TCGA-VS-A9U6-01 | Cervix | cervical & endocervical cancer | Female | <65 | I/II | Chemotherapy | cisplatin | PD | ||
| SLC27A5 | SNV | Missense_Mutation | rs371423777 | c.1159C>T | p.Arg387Trp | p.R387W | Q9Y2P5 | protein_coding | deleterious(0) | probably_damaging(1) | TCGA-A6-3810-01 | Colorectum | colon adenocarcinoma | Male | <65 | I/II | Unknown | Unknown | SD |
| Page: 1 2 3 4 5 6 7 |
Top |
Related drugs of malignant transformation related genes |
| Identification of chemicals and drugs interact with genes involved in malignant transfromation |
| (DGIdb 4.0) |
| Entrez ID | Symbol | Category | Interaction Types | Drug Claim Name | Drug Name | PMIDs |
| Page: 1 |

Copyright 2023-Present -The University of Texas Health Science Center at Houston |