
|
|||||
|
 | |
| |
| |
| |
| |
| |
|
Gene: SLC27A4 |
Gene summary for SLC27A4 |
| Gene information | Species | Human | Gene symbol | SLC27A4 | Gene ID | 10999 |
| Gene name | solute carrier family 27 member 4 | |
| Gene Alias | ACSVL4 | |
| Cytomap | 9q34.11 | |
| Gene Type | protein-coding | GO ID | GO:0000038 | UniProtAcc | A0A024R8D2 |
Top |
Malignant transformation analysis |
| Identification of the aberrant gene expression in precancerous and cancerous lesions by comparing the gene expression of stem-like cells in diseased tissues with normal stem cells |
| Entrez ID | Symbol | Replicates | Species | Organ | Tissue | Adj P-value | Log2FC | Malignancy |
| 10999 | SLC27A4 | HTA11_2487_2000001011 | Human | Colorectum | SER | 1.12e-10 | 4.77e-01 | -0.1808 |
| 10999 | SLC27A4 | HTA11_1938_2000001011 | Human | Colorectum | AD | 2.40e-05 | 4.48e-01 | -0.0811 |
| 10999 | SLC27A4 | HTA11_347_2000001011 | Human | Colorectum | AD | 5.16e-06 | 3.09e-01 | -0.1954 |
| 10999 | SLC27A4 | HTA11_2112_2000001011 | Human | Colorectum | SER | 3.93e-05 | 7.79e-01 | -0.2196 |
| 10999 | SLC27A4 | HTA11_3361_2000001011 | Human | Colorectum | AD | 3.34e-06 | 4.53e-01 | -0.1207 |
| 10999 | SLC27A4 | HTA11_83_2000001011 | Human | Colorectum | SER | 6.68e-12 | 7.58e-01 | -0.1526 |
| 10999 | SLC27A4 | HTA11_696_2000001011 | Human | Colorectum | AD | 2.16e-10 | 5.19e-01 | -0.1464 |
| 10999 | SLC27A4 | HTA11_866_2000001011 | Human | Colorectum | AD | 1.28e-09 | 4.03e-01 | -0.1001 |
| 10999 | SLC27A4 | HTA11_1391_2000001011 | Human | Colorectum | AD | 1.12e-12 | 6.94e-01 | -0.059 |
| 10999 | SLC27A4 | HTA11_546_2000001011 | Human | Colorectum | AD | 3.48e-03 | 3.16e-01 | -0.0842 |
| 10999 | SLC27A4 | HTA11_99999965104_69814 | Human | Colorectum | MSS | 5.08e-19 | 8.36e-01 | 0.281 |
| 10999 | SLC27A4 | HTA11_99999973899_84307 | Human | Colorectum | MSS | 8.61e-07 | 5.38e-01 | 0.2585 |
| 10999 | SLC27A4 | A015-C-104 | Human | Colorectum | FAP | 1.69e-03 | -1.68e-01 | -0.1899 |
| 10999 | SLC27A4 | A002-C-016 | Human | Colorectum | FAP | 2.15e-02 | -1.26e-01 | 0.0521 |
| 10999 | SLC27A4 | A002-C-116 | Human | Colorectum | FAP | 4.32e-04 | -1.53e-01 | -0.0452 |
| 10999 | SLC27A4 | F034 | Human | Colorectum | FAP | 1.01e-03 | -1.55e-01 | -0.0665 |
| 10999 | SLC27A4 | P2T-E | Human | Esophagus | ESCC | 5.20e-03 | 4.59e-02 | 0.1177 |
| 10999 | SLC27A4 | P4T-E | Human | Esophagus | ESCC | 6.74e-06 | 1.33e-01 | 0.1323 |
| 10999 | SLC27A4 | P5T-E | Human | Esophagus | ESCC | 1.77e-04 | 8.36e-02 | 0.1327 |
| 10999 | SLC27A4 | P8T-E | Human | Esophagus | ESCC | 1.36e-04 | 9.62e-02 | 0.0889 |
| Page: 1 2 3 4 5 |
| Tissue | Expression Dynamics | Abbreviation |
| Colorectum (GSE201348) |  | FAP: Familial adenomatous polyposis |
| CRC: Colorectal cancer | ||
| Colorectum (HTA11) |  | AD: Adenomas |
| SER: Sessile serrated lesions | ||
| MSI-H: Microsatellite-high colorectal cancer | ||
| MSS: Microsatellite stable colorectal cancer | ||
| Esophagus |  | ESCC: Esophageal squamous cell carcinoma |
| HGIN: High-grade intraepithelial neoplasias | ||
| LGIN: Low-grade intraepithelial neoplasias | ||
| Liver |  | HCC: Hepatocellular carcinoma |
| NAFLD: Non-alcoholic fatty liver disease | ||
| Oral Cavity | 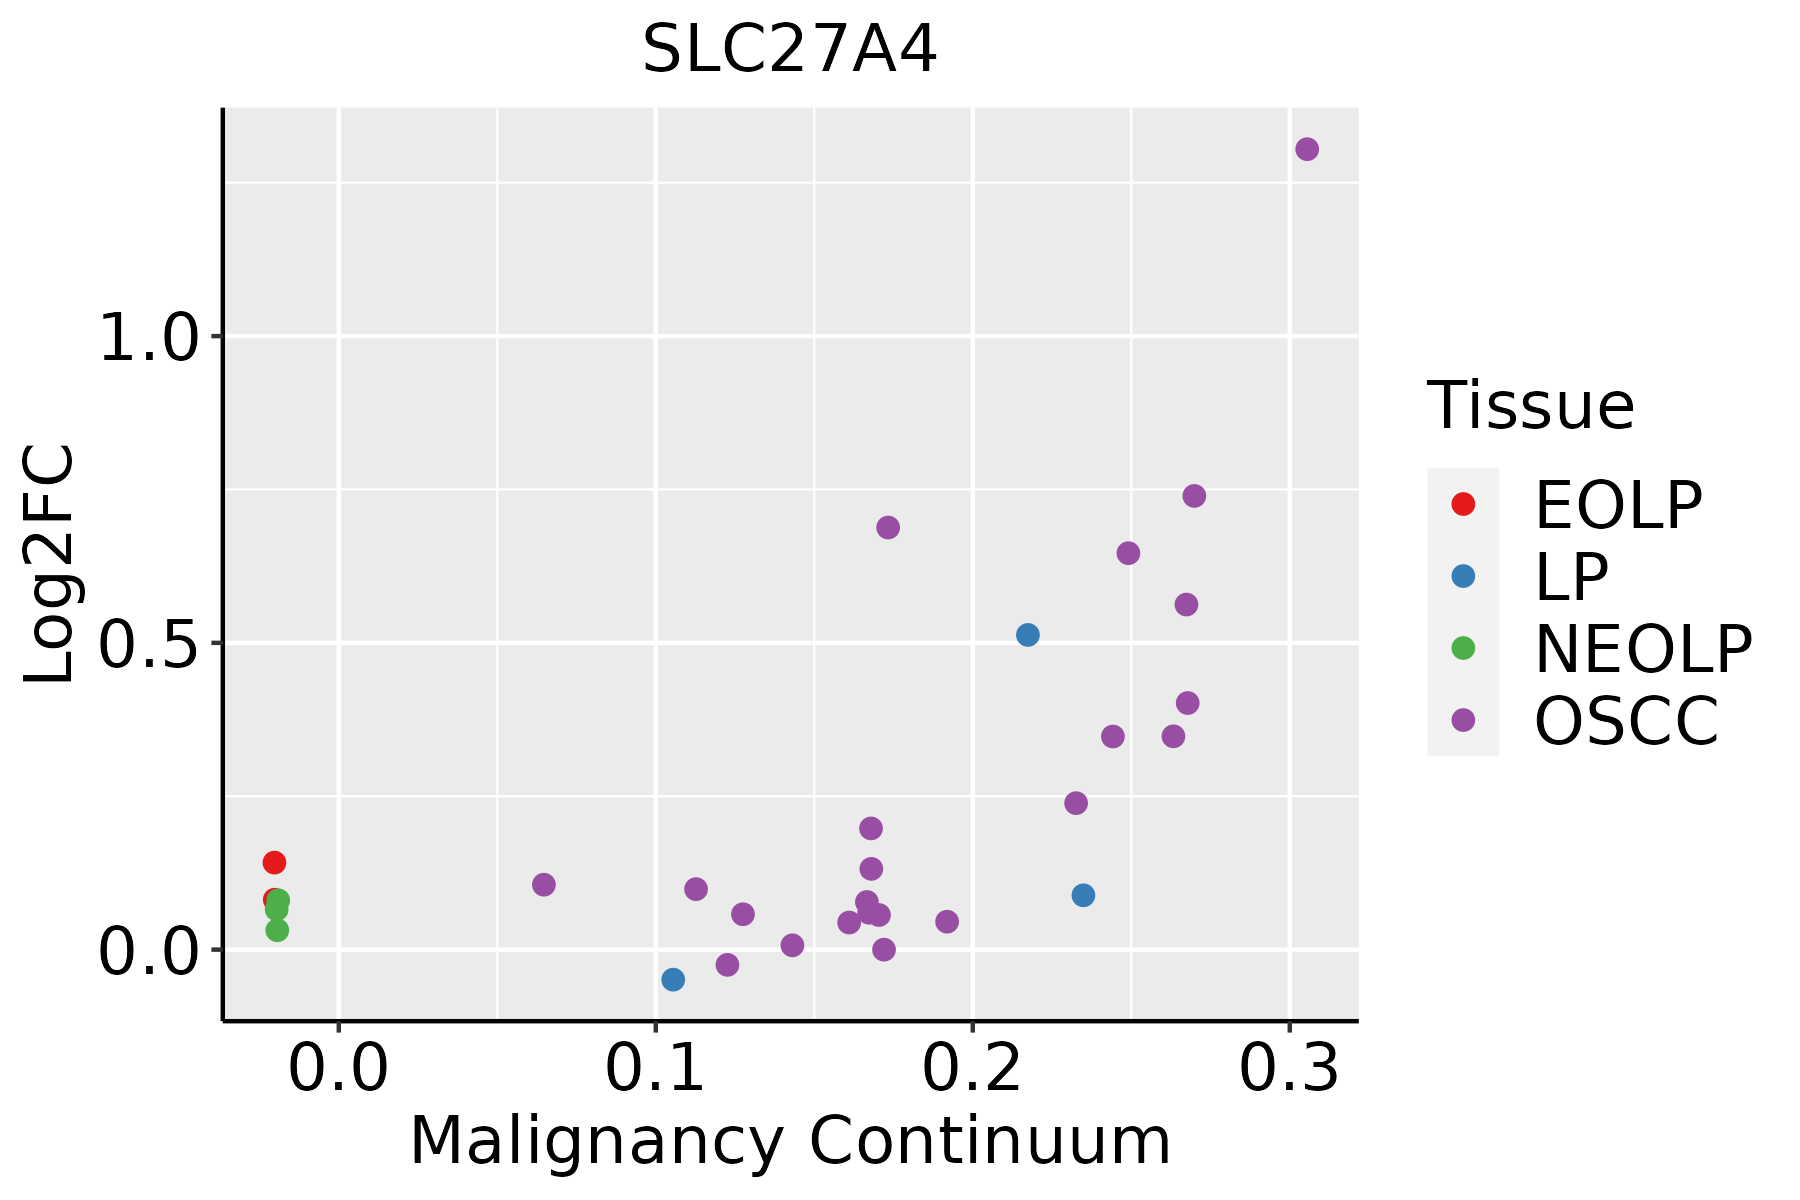 | EOLP: Erosive Oral lichen planus |
| LP: leukoplakia | ||
| NEOLP: Non-erosive oral lichen planus | ||
| OSCC: Oral squamous cell carcinoma |
| ∗log2FC in expression of this searched gene in stem-like cells from each diseased tissue sample relative to stem-like cells in normal samples in each tissue plotted against the malignancy continuum. Samples are colored based on if they are from different disease stage. |
Top |
Malignant transformation related pathway analysis |
| Find out the enriched GO biological processes and KEGG pathways involved in transition from healthy to precancer to cancer |
| Tissue | Disease Stage | Enriched GO biological Processes |
| Colorectum | AD |  |
| Colorectum | SER |  |
| Colorectum | MSS |  |
| Colorectum | MSI-H |  |
| Colorectum | FAP |  |
| ∗Top 15 enriched GO BP terms are showed in the bar plot of each disease state in each tissue. Each row represents a significant GO biological process which is colored according to the -log10(p.adjust). |
| Page: 1 2 3 4 5 6 7 8 9 |
| GO ID | Tissue | Disease Stage | Description | Gene Ratio | Bg Ratio | pvalue | p.adjust | Count |
| GO:0032868 | Colorectum | AD | response to insulin | 91/3918 | 264/18723 | 2.02e-07 | 8.48e-06 | 91 |
| GO:1901653 | Colorectum | AD | cellular response to peptide | 114/3918 | 359/18723 | 8.32e-07 | 2.88e-05 | 114 |
| GO:0044282 | Colorectum | AD | small molecule catabolic process | 118/3918 | 376/18723 | 1.05e-06 | 3.55e-05 | 118 |
| GO:0032869 | Colorectum | AD | cellular response to insulin stimulus | 72/3918 | 203/18723 | 1.10e-06 | 3.68e-05 | 72 |
| GO:0071375 | Colorectum | AD | cellular response to peptide hormone stimulus | 95/3918 | 290/18723 | 1.50e-06 | 4.66e-05 | 95 |
| GO:0043087 | Colorectum | AD | regulation of GTPase activity | 110/3918 | 348/18723 | 1.64e-06 | 5.03e-05 | 110 |
| GO:0043434 | Colorectum | AD | response to peptide hormone | 126/3918 | 414/18723 | 2.70e-06 | 7.86e-05 | 126 |
| GO:0009062 | Colorectum | AD | fatty acid catabolic process | 41/3918 | 100/18723 | 4.02e-06 | 1.09e-04 | 41 |
| GO:0031667 | Colorectum | AD | response to nutrient levels | 138/3918 | 474/18723 | 1.22e-05 | 2.68e-04 | 138 |
| GO:0016042 | Colorectum | AD | lipid catabolic process | 97/3918 | 320/18723 | 4.31e-05 | 7.56e-04 | 97 |
| GO:0006631 | Colorectum | AD | fatty acid metabolic process | 114/3918 | 390/18723 | 5.58e-05 | 9.44e-04 | 114 |
| GO:0072329 | Colorectum | AD | monocarboxylic acid catabolic process | 44/3918 | 122/18723 | 8.05e-05 | 1.28e-03 | 44 |
| GO:0016054 | Colorectum | AD | organic acid catabolic process | 73/3918 | 240/18723 | 3.20e-04 | 3.81e-03 | 73 |
| GO:0044242 | Colorectum | AD | cellular lipid catabolic process | 66/3918 | 214/18723 | 3.96e-04 | 4.50e-03 | 66 |
| GO:0043547 | Colorectum | AD | positive regulation of GTPase activity | 75/3918 | 255/18723 | 7.95e-04 | 7.91e-03 | 75 |
| GO:0046395 | Colorectum | AD | carboxylic acid catabolic process | 70/3918 | 236/18723 | 9.06e-04 | 8.71e-03 | 70 |
| GO:0062012 | Colorectum | AD | regulation of small molecule metabolic process | 93/3918 | 334/18723 | 1.46e-03 | 1.24e-02 | 93 |
| GO:0010876 | Colorectum | AD | lipid localization | 120/3918 | 448/18723 | 1.59e-03 | 1.33e-02 | 120 |
| GO:0006869 | Colorectum | AD | lipid transport | 108/3918 | 398/18723 | 1.67e-03 | 1.39e-02 | 108 |
| GO:00160421 | Colorectum | SER | lipid catabolic process | 77/2897 | 320/18723 | 3.52e-05 | 9.18e-04 | 77 |
| Page: 1 2 3 4 5 6 7 8 9 |
| Pathway ID | Tissue | Disease Stage | Description | Gene Ratio | Bg Ratio | pvalue | p.adjust | qvalue | Count |
| hsa04931 | Colorectum | MSS | Insulin resistance | 36/1875 | 108/8465 | 4.74e-03 | 2.01e-02 | 1.23e-02 | 36 |
| hsa049311 | Colorectum | MSS | Insulin resistance | 36/1875 | 108/8465 | 4.74e-03 | 2.01e-02 | 1.23e-02 | 36 |
| hsa049318 | Esophagus | ESCC | Insulin resistance | 69/4205 | 108/8465 | 1.92e-03 | 5.54e-03 | 2.84e-03 | 69 |
| hsa0493113 | Esophagus | ESCC | Insulin resistance | 69/4205 | 108/8465 | 1.92e-03 | 5.54e-03 | 2.84e-03 | 69 |
| hsa0493121 | Liver | HCC | Insulin resistance | 77/4020 | 108/8465 | 3.89e-07 | 4.46e-06 | 2.48e-06 | 77 |
| hsa033204 | Liver | HCC | PPAR signaling pathway | 48/4020 | 75/8465 | 2.83e-03 | 9.37e-03 | 5.21e-03 | 48 |
| hsa0493131 | Liver | HCC | Insulin resistance | 77/4020 | 108/8465 | 3.89e-07 | 4.46e-06 | 2.48e-06 | 77 |
| hsa033205 | Liver | HCC | PPAR signaling pathway | 48/4020 | 75/8465 | 2.83e-03 | 9.37e-03 | 5.21e-03 | 48 |
| hsa049317 | Oral cavity | OSCC | Insulin resistance | 60/3704 | 108/8465 | 8.66e-03 | 1.97e-02 | 1.00e-02 | 60 |
| hsa0493112 | Oral cavity | OSCC | Insulin resistance | 60/3704 | 108/8465 | 8.66e-03 | 1.97e-02 | 1.00e-02 | 60 |
| Page: 1 |
Top |
Cell-cell communication analysis |
| Identification of potential cell-cell interactions between two cell types and their ligand-receptor pairs for different disease states |
| Ligand | Receptor | LRpair | Pathway | Tissue | Disease Stage |
| Page: 1 |
Top |
Single-cell gene regulatory network inference analysis |
| Find out the significant the regulons (TFs) and the target genes of each regulon across cell types for different disease states |
| TF | Cell Type | Tissue | Disease Stage | Target Gene | RSS | Regulon Activity |
| ∗The dot plots of a searched regulon are shown for all cell subpopulations in each disease state of each tissue based on the regulon specific score inferred using pySCENIC and by calculating the average expression. |
| Page: 1 |
Top |
Somatic mutation of malignant transformation related genes |
| Annotation of somatic variants for genes involved in malignant transformation |
| Hugo Symbol | Variant Class | Variant Classification | dbSNP RS | HGVSc | HGVSp | HGVSp Short | SWISSPROT | BIOTYPE | SIFT | PolyPhen | Tumor Sample Barcode | Tissue | Histology | Sex | Age | Stage | Therapy Types | Drugs | Outcome |
| SLC27A4 | SNV | Missense_Mutation | rs759491973 | c.1217N>G | p.Asn406Ser | p.N406S | Q6P1M0 | protein_coding | tolerated(0.44) | possibly_damaging(0.474) | TCGA-A2-A0D0-01 | Breast | breast invasive carcinoma | Female | <65 | I/II | Chemotherapy | cytoxan | SD |
| SLC27A4 | SNV | Missense_Mutation | novel | c.445N>A | p.Leu149Ile | p.L149I | Q6P1M0 | protein_coding | tolerated(1) | benign(0.035) | TCGA-BH-A42U-01 | Breast | breast invasive carcinoma | Female | >=65 | I/II | Unknown | Unknown | SD |
| SLC27A4 | SNV | Missense_Mutation | c.1819N>T | p.Asp607Tyr | p.D607Y | Q6P1M0 | protein_coding | deleterious(0) | possibly_damaging(0.882) | TCGA-D8-A1JG-01 | Breast | breast invasive carcinoma | Female | <65 | I/II | Chemotherapy | doxorubicin | SD | |
| SLC27A4 | SNV | Missense_Mutation | c.1301N>A | p.Gly434Asp | p.G434D | Q6P1M0 | protein_coding | deleterious(0) | probably_damaging(0.999) | TCGA-D8-A1X7-01 | Breast | breast invasive carcinoma | Female | <65 | I/II | ChemotherapyHormone Therapy | doxorubicine+cyclophosphamide+tamoxifen | SD | |
| SLC27A4 | SNV | Missense_Mutation | novel | c.1882C>G | p.Leu628Val | p.L628V | Q6P1M0 | protein_coding | tolerated(0.13) | benign(0.104) | TCGA-LL-A8F5-01 | Breast | breast invasive carcinoma | Female | <65 | I/II | Chemotherapy | cyclophosphamide | SD |
| SLC27A4 | SNV | Missense_Mutation | novel | c.128G>T | p.Arg43Leu | p.R43L | Q6P1M0 | protein_coding | tolerated(0.55) | benign(0.006) | TCGA-OL-A6VO-01 | Breast | breast invasive carcinoma | Female | <65 | I/II | Chemotherapy | taxotere | CR |
| SLC27A4 | insertion | Frame_Shift_Ins | novel | c.112_113insT | p.Gly38ValfsTer72 | p.G38Vfs*72 | Q6P1M0 | protein_coding | TCGA-A8-A07R-01 | Breast | breast invasive carcinoma | Female | >=65 | III/IV | Ancillary | zoledronic | SD | ||
| SLC27A4 | insertion | Frame_Shift_Ins | novel | c.114_115insACCGCCAATATGCATTGTACATTCCACAAGTATTGCCTTC | p.Trp39ThrfsTer84 | p.W39Tfs*84 | Q6P1M0 | protein_coding | TCGA-A8-A07R-01 | Breast | breast invasive carcinoma | Female | >=65 | III/IV | Ancillary | zoledronic | SD | ||
| SLC27A4 | insertion | Frame_Shift_Ins | novel | c.1863_1864insCCAAGATCGTGCCACTGCATTCCAGCCCCGGTGACAGTGC | p.Lys622ProfsTer99 | p.K622Pfs*99 | Q6P1M0 | protein_coding | TCGA-AN-A0AS-01 | Breast | breast invasive carcinoma | Female | >=65 | III/IV | Unknown | Unknown | SD | ||
| SLC27A4 | insertion | Nonsense_Mutation | novel | c.787_788insTGTGATGGGAACAGGTGTTGAAGGGTGCAC | p.Tyr263delinsLeuTerTrpGluGlnValLeuLysGlyAlaHis | p.Y263delinsL*WEQVLKGAH | Q6P1M0 | protein_coding | TCGA-BH-A0B8-01 | Breast | breast invasive carcinoma | Female | <65 | I/II | Hormone Therapy | arimidex | SD |
| Page: 1 2 3 4 5 6 7 |
Top |
Related drugs of malignant transformation related genes |
| Identification of chemicals and drugs interact with genes involved in malignant transfromation |
| (DGIdb 4.0) |
| Entrez ID | Symbol | Category | Interaction Types | Drug Claim Name | Drug Name | PMIDs |
| 10999 | SLC27A4 | TRANSPORTER, DRUGGABLE GENOME, EXTERNAL SIDE OF PLASMA MEMBRANE | inhibitor | 252827468 |
| Page: 1 |

Copyright 2023-Present -The University of Texas Health Science Center at Houston |