
|
|||||
|
 | |
| |
| |
| |
| |
| |
|
Gene: SLC27A3 |
Gene summary for SLC27A3 |
| Gene information | Species | Human | Gene symbol | SLC27A3 | Gene ID | 11000 |
| Gene name | solute carrier family 27 member 3 | |
| Gene Alias | ACSVL3 | |
| Cytomap | 1q21.3 | |
| Gene Type | protein-coding | GO ID | GO:0001676 | UniProtAcc | Q5K4L6 |
Top |
Malignant transformation analysis |
| Identification of the aberrant gene expression in precancerous and cancerous lesions by comparing the gene expression of stem-like cells in diseased tissues with normal stem cells |
| Entrez ID | Symbol | Replicates | Species | Organ | Tissue | Adj P-value | Log2FC | Malignancy |
| 11000 | SLC27A3 | LZE22T | Human | Esophagus | ESCC | 1.77e-03 | 2.20e-01 | 0.068 |
| 11000 | SLC27A3 | LZE24T | Human | Esophagus | ESCC | 5.02e-06 | 1.87e-01 | 0.0596 |
| 11000 | SLC27A3 | P1T-E | Human | Esophagus | ESCC | 8.56e-04 | 2.27e-01 | 0.0875 |
| 11000 | SLC27A3 | P2T-E | Human | Esophagus | ESCC | 7.60e-20 | 4.11e-01 | 0.1177 |
| 11000 | SLC27A3 | P4T-E | Human | Esophagus | ESCC | 3.13e-17 | 3.20e-01 | 0.1323 |
| 11000 | SLC27A3 | P5T-E | Human | Esophagus | ESCC | 6.83e-06 | 1.71e-01 | 0.1327 |
| 11000 | SLC27A3 | P8T-E | Human | Esophagus | ESCC | 3.20e-11 | 2.63e-01 | 0.0889 |
| 11000 | SLC27A3 | P9T-E | Human | Esophagus | ESCC | 2.23e-15 | 3.41e-01 | 0.1131 |
| 11000 | SLC27A3 | P10T-E | Human | Esophagus | ESCC | 4.29e-07 | 1.31e-01 | 0.116 |
| 11000 | SLC27A3 | P11T-E | Human | Esophagus | ESCC | 2.52e-12 | 5.41e-01 | 0.1426 |
| 11000 | SLC27A3 | P12T-E | Human | Esophagus | ESCC | 5.87e-13 | 3.24e-01 | 0.1122 |
| 11000 | SLC27A3 | P15T-E | Human | Esophagus | ESCC | 7.39e-07 | 1.77e-01 | 0.1149 |
| 11000 | SLC27A3 | P16T-E | Human | Esophagus | ESCC | 1.55e-08 | 1.58e-01 | 0.1153 |
| 11000 | SLC27A3 | P20T-E | Human | Esophagus | ESCC | 1.54e-16 | 2.64e-01 | 0.1124 |
| 11000 | SLC27A3 | P21T-E | Human | Esophagus | ESCC | 3.74e-25 | 5.52e-01 | 0.1617 |
| 11000 | SLC27A3 | P22T-E | Human | Esophagus | ESCC | 2.22e-11 | 2.02e-01 | 0.1236 |
| 11000 | SLC27A3 | P23T-E | Human | Esophagus | ESCC | 4.92e-12 | 3.62e-01 | 0.108 |
| 11000 | SLC27A3 | P24T-E | Human | Esophagus | ESCC | 5.71e-10 | 3.40e-01 | 0.1287 |
| 11000 | SLC27A3 | P26T-E | Human | Esophagus | ESCC | 2.39e-09 | 1.73e-01 | 0.1276 |
| 11000 | SLC27A3 | P27T-E | Human | Esophagus | ESCC | 2.90e-14 | 2.07e-01 | 0.1055 |
| Page: 1 2 3 4 |
| Tissue | Expression Dynamics | Abbreviation |
| Esophagus | 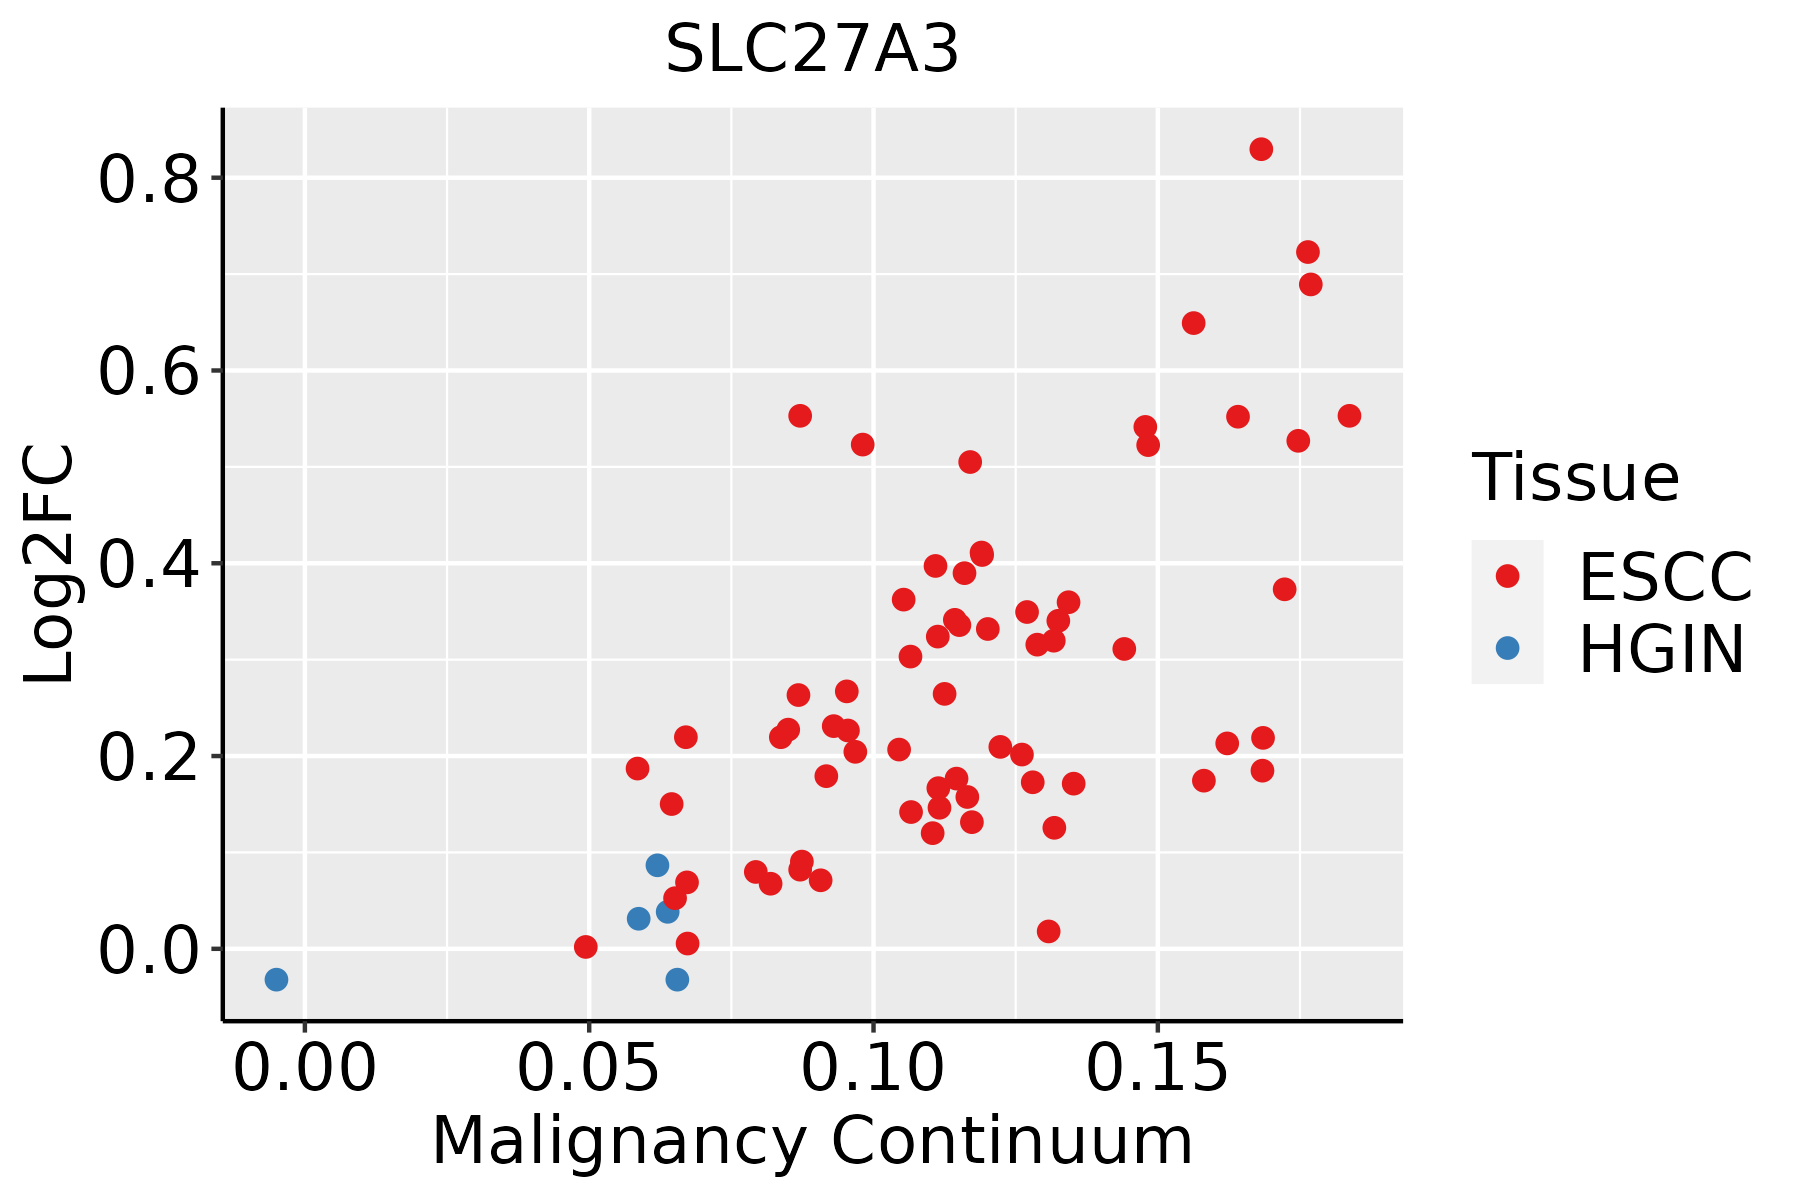 | ESCC: Esophageal squamous cell carcinoma |
| HGIN: High-grade intraepithelial neoplasias | ||
| LGIN: Low-grade intraepithelial neoplasias | ||
| Liver | 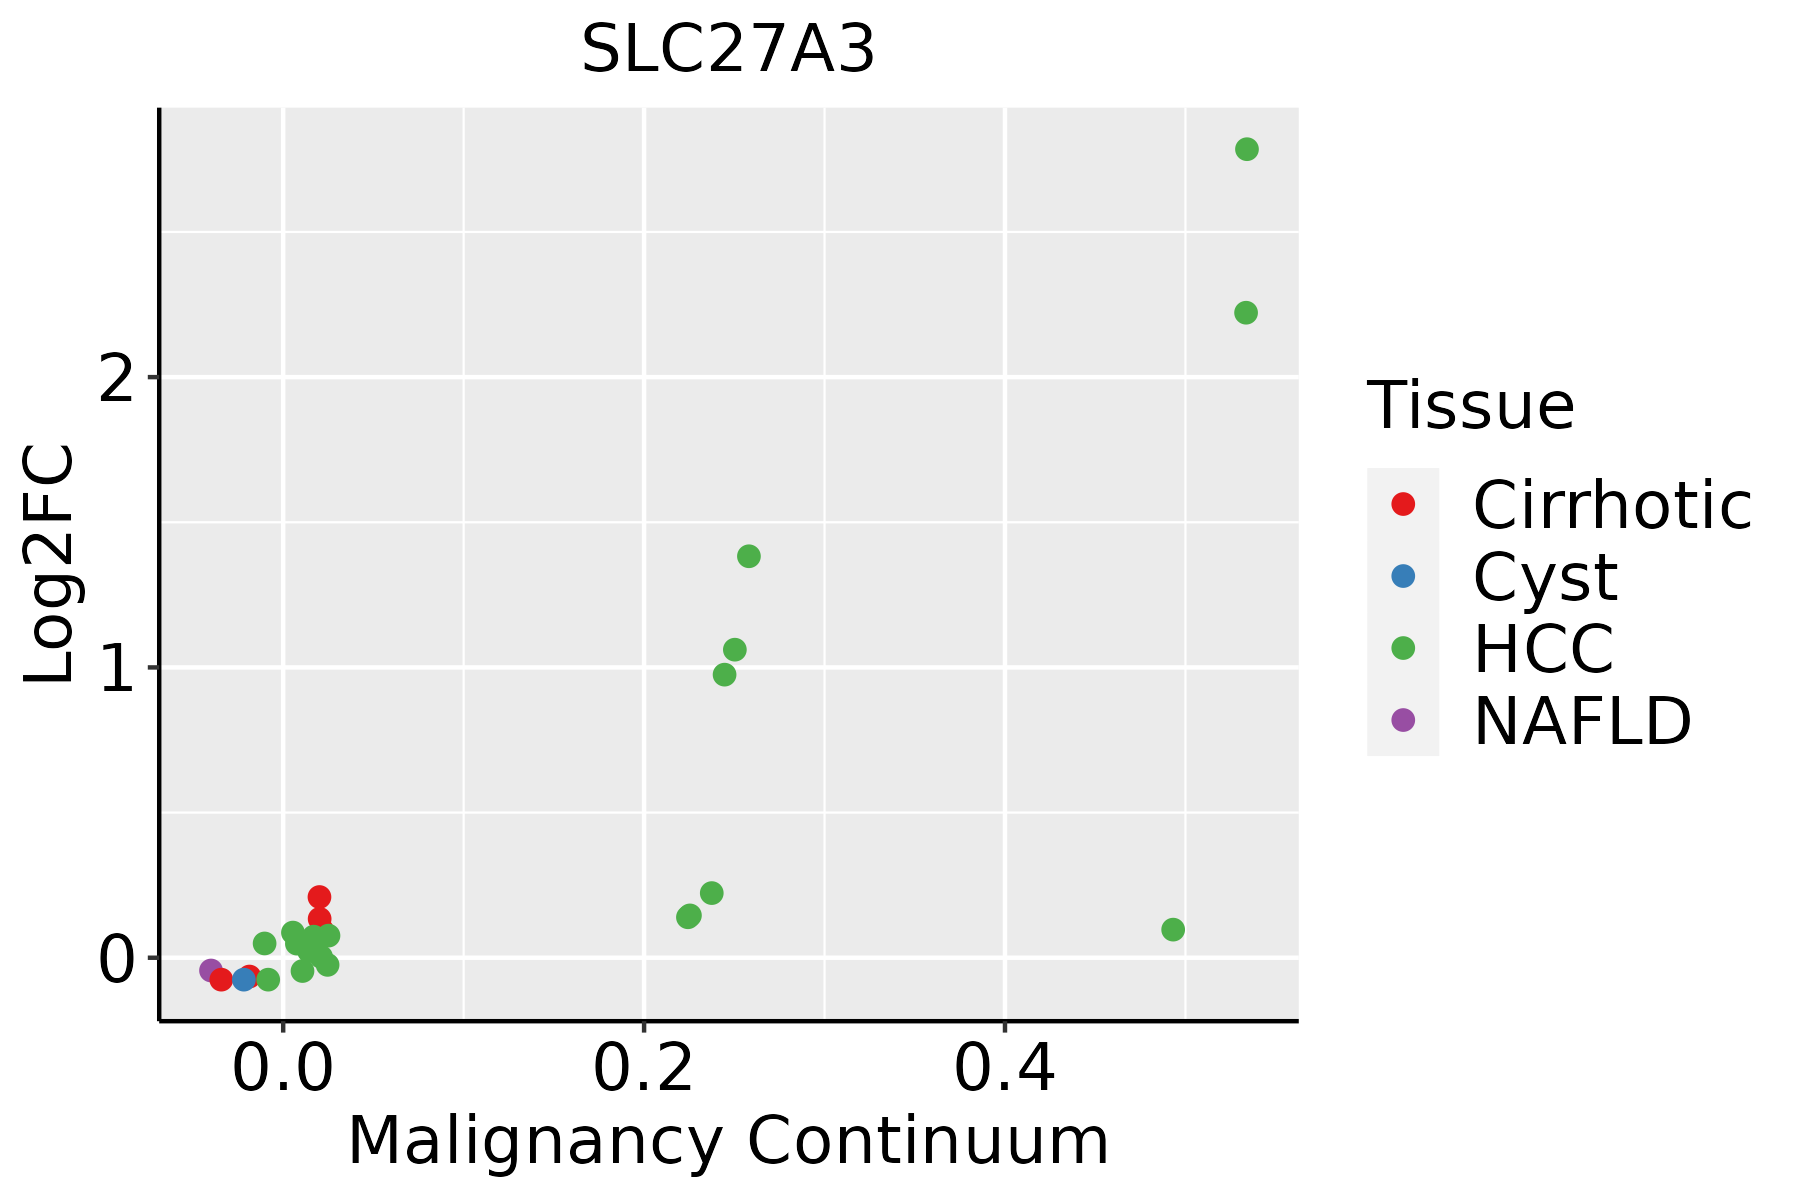 | HCC: Hepatocellular carcinoma |
| NAFLD: Non-alcoholic fatty liver disease | ||
| Skin |  | AK: Actinic keratosis |
| cSCC: Cutaneous squamous cell carcinoma | ||
| SCCIS:squamous cell carcinoma in situ |
| ∗log2FC in expression of this searched gene in stem-like cells from each diseased tissue sample relative to stem-like cells in normal samples in each tissue plotted against the malignancy continuum. Samples are colored based on if they are from different disease stage. |
Top |
Malignant transformation related pathway analysis |
| Find out the enriched GO biological processes and KEGG pathways involved in transition from healthy to precancer to cancer |
| Tissue | Disease Stage | Enriched GO biological Processes |
| Colorectum | AD |  |
| Colorectum | SER |  |
| Colorectum | MSS |  |
| Colorectum | MSI-H |  |
| Colorectum | FAP |  |
| ∗Top 15 enriched GO BP terms are showed in the bar plot of each disease state in each tissue. Each row represents a significant GO biological process which is colored according to the -log10(p.adjust). |
| Page: 1 2 3 4 5 6 7 8 9 |
| GO ID | Tissue | Disease Stage | Description | Gene Ratio | Bg Ratio | pvalue | p.adjust | Count |
| GO:00066318 | Esophagus | ESCC | fatty acid metabolic process | 217/8552 | 390/18723 | 4.21e-05 | 3.39e-04 | 217 |
| GO:000663112 | Liver | Cirrhotic | fatty acid metabolic process | 165/4634 | 390/18723 | 1.29e-14 | 1.26e-12 | 165 |
| GO:001087611 | Liver | Cirrhotic | lipid localization | 147/4634 | 448/18723 | 6.24e-05 | 7.12e-04 | 147 |
| GO:000686911 | Liver | Cirrhotic | lipid transport | 128/4634 | 398/18723 | 4.54e-04 | 3.69e-03 | 128 |
| GO:000167611 | Liver | Cirrhotic | long-chain fatty acid metabolic process | 40/4634 | 112/18723 | 6.16e-03 | 3.06e-02 | 40 |
| GO:000663122 | Liver | HCC | fatty acid metabolic process | 238/7958 | 390/18723 | 8.24e-14 | 4.84e-12 | 238 |
| GO:001087621 | Liver | HCC | lipid localization | 228/7958 | 448/18723 | 1.80e-04 | 1.41e-03 | 228 |
| GO:000686921 | Liver | HCC | lipid transport | 198/7958 | 398/18723 | 1.92e-03 | 9.78e-03 | 198 |
| GO:000167621 | Liver | HCC | long-chain fatty acid metabolic process | 60/7958 | 112/18723 | 1.17e-02 | 4.28e-02 | 60 |
| Page: 1 |
| Pathway ID | Tissue | Disease Stage | Description | Gene Ratio | Bg Ratio | pvalue | p.adjust | qvalue | Count |
| hsa049318 | Esophagus | ESCC | Insulin resistance | 69/4205 | 108/8465 | 1.92e-03 | 5.54e-03 | 2.84e-03 | 69 |
| hsa0493113 | Esophagus | ESCC | Insulin resistance | 69/4205 | 108/8465 | 1.92e-03 | 5.54e-03 | 2.84e-03 | 69 |
| hsa0493121 | Liver | HCC | Insulin resistance | 77/4020 | 108/8465 | 3.89e-07 | 4.46e-06 | 2.48e-06 | 77 |
| hsa0493131 | Liver | HCC | Insulin resistance | 77/4020 | 108/8465 | 3.89e-07 | 4.46e-06 | 2.48e-06 | 77 |
| Page: 1 |
Top |
Cell-cell communication analysis |
| Identification of potential cell-cell interactions between two cell types and their ligand-receptor pairs for different disease states |
| Ligand | Receptor | LRpair | Pathway | Tissue | Disease Stage |
| Page: 1 |
Top |
Single-cell gene regulatory network inference analysis |
| Find out the significant the regulons (TFs) and the target genes of each regulon across cell types for different disease states |
| TF | Cell Type | Tissue | Disease Stage | Target Gene | RSS | Regulon Activity |
| ∗The dot plots of a searched regulon are shown for all cell subpopulations in each disease state of each tissue based on the regulon specific score inferred using pySCENIC and by calculating the average expression. |
| Page: 1 |
Top |
Somatic mutation of malignant transformation related genes |
| Annotation of somatic variants for genes involved in malignant transformation |
| Hugo Symbol | Variant Class | Variant Classification | dbSNP RS | HGVSc | HGVSp | HGVSp Short | SWISSPROT | BIOTYPE | SIFT | PolyPhen | Tumor Sample Barcode | Tissue | Histology | Sex | Age | Stage | Therapy Types | Drugs | Outcome |
| SLC27A3 | SNV | Missense_Mutation | novel | c.19A>C | p.Thr7Pro | p.T7P | Q5K4L6 | protein_coding | deleterious_low_confidence(0.01) | benign(0.094) | TCGA-B6-A0WY-01 | Breast | breast invasive carcinoma | Female | <65 | III/IV | Unknown | Unknown | PD |
| SLC27A3 | SNV | Missense_Mutation | c.1484C>A | p.Ser495Tyr | p.S495Y | Q5K4L6 | protein_coding | deleterious(0) | probably_damaging(0.979) | TCGA-EK-A2PG-01 | Cervix | cervical & endocervical cancer | Female | >=65 | I/II | Unknown | Unknown | SD | |
| SLC27A3 | SNV | Missense_Mutation | novel | c.1871N>A | p.Gly624Glu | p.G624E | Q5K4L6 | protein_coding | deleterious(0) | probably_damaging(1) | TCGA-MA-AA43-01 | Cervix | cervical & endocervical cancer | Female | <65 | III/IV | Unknown | Unknown | SD |
| SLC27A3 | SNV | Missense_Mutation | novel | c.2043N>G | p.Phe681Leu | p.F681L | Q5K4L6 | protein_coding | deleterious(0.01) | probably_damaging(0.917) | TCGA-VS-A8EI-01 | Cervix | cervical & endocervical cancer | Female | <65 | I/II | Chemotherapy | cisplatin | CR |
| SLC27A3 | SNV | Missense_Mutation | c.1659G>T | p.Glu553Asp | p.E553D | Q5K4L6 | protein_coding | deleterious(0.05) | possibly_damaging(0.739) | TCGA-A6-5661-01 | Colorectum | colon adenocarcinoma | Female | >=65 | I/II | Unknown | Unknown | SD | |
| SLC27A3 | SNV | Missense_Mutation | rs745383068 | c.1567N>T | p.His523Tyr | p.H523Y | Q5K4L6 | protein_coding | tolerated(1) | benign(0.407) | TCGA-A6-6780-01 | Colorectum | colon adenocarcinoma | Male | >=65 | I/II | Unknown | Unknown | SD |
| SLC27A3 | SNV | Missense_Mutation | novel | c.1408N>A | p.Glu470Lys | p.E470K | Q5K4L6 | protein_coding | deleterious(0) | probably_damaging(1) | TCGA-AA-3952-01 | Colorectum | colon adenocarcinoma | Male | >=65 | III/IV | Unknown | Unknown | PD |
| SLC27A3 | SNV | Missense_Mutation | rs749428513 | c.2059C>T | p.Arg687Trp | p.R687W | Q5K4L6 | protein_coding | deleterious(0.01) | probably_damaging(0.96) | TCGA-AA-A00N-01 | Colorectum | colon adenocarcinoma | Male | >=65 | I/II | Unknown | Unknown | PD |
| SLC27A3 | SNV | Missense_Mutation | rs201939587 | c.1373G>A | p.Arg458His | p.R458H | Q5K4L6 | protein_coding | deleterious(0) | probably_damaging(0.97) | TCGA-AZ-4615-01 | Colorectum | colon adenocarcinoma | Male | >=65 | III/IV | Chemotherapy | xeloda | PD |
| SLC27A3 | SNV | Missense_Mutation | c.1976A>T | p.Asn659Ile | p.N659I | Q5K4L6 | protein_coding | tolerated(0.29) | benign(0) | TCGA-CK-4951-01 | Colorectum | colon adenocarcinoma | Female | >=65 | I/II | Unknown | Unknown | PD |
| Page: 1 2 3 4 5 6 7 |
Top |
Related drugs of malignant transformation related genes |
| Identification of chemicals and drugs interact with genes involved in malignant transfromation |
| (DGIdb 4.0) |
| Entrez ID | Symbol | Category | Interaction Types | Drug Claim Name | Drug Name | PMIDs |
| Page: 1 |

Copyright 2023-Present -The University of Texas Health Science Center at Houston |