
|
|||||
|
 | |
| |
| |
| |
| |
| |
|
Gene: SLC27A1 |
Gene summary for SLC27A1 |
| Gene information | Species | Human | Gene symbol | SLC27A1 | Gene ID | 376497 |
| Gene name | solute carrier family 27 member 1 | |
| Gene Alias | ACSVL5 | |
| Cytomap | 19p13.11 | |
| Gene Type | protein-coding | GO ID | GO:0001579 | UniProtAcc | Q6PCB7 |
Top |
Malignant transformation analysis |
| Identification of the aberrant gene expression in precancerous and cancerous lesions by comparing the gene expression of stem-like cells in diseased tissues with normal stem cells |
| Entrez ID | Symbol | Replicates | Species | Organ | Tissue | Adj P-value | Log2FC | Malignancy |
| 376497 | SLC27A1 | LZE4T | Human | Esophagus | ESCC | 1.38e-02 | 4.97e-02 | 0.0811 |
| 376497 | SLC27A1 | LZE24T | Human | Esophagus | ESCC | 6.16e-06 | 7.84e-02 | 0.0596 |
| 376497 | SLC27A1 | P2T-E | Human | Esophagus | ESCC | 3.19e-08 | 9.28e-02 | 0.1177 |
| 376497 | SLC27A1 | P4T-E | Human | Esophagus | ESCC | 1.48e-08 | 6.57e-02 | 0.1323 |
| 376497 | SLC27A1 | P8T-E | Human | Esophagus | ESCC | 3.51e-06 | 1.36e-01 | 0.0889 |
| 376497 | SLC27A1 | P9T-E | Human | Esophagus | ESCC | 1.13e-05 | 4.42e-02 | 0.1131 |
| 376497 | SLC27A1 | P11T-E | Human | Esophagus | ESCC | 1.95e-09 | 2.44e-01 | 0.1426 |
| 376497 | SLC27A1 | P12T-E | Human | Esophagus | ESCC | 9.07e-08 | 8.90e-02 | 0.1122 |
| 376497 | SLC27A1 | P15T-E | Human | Esophagus | ESCC | 2.36e-09 | 9.06e-02 | 0.1149 |
| 376497 | SLC27A1 | P16T-E | Human | Esophagus | ESCC | 3.19e-19 | 2.79e-01 | 0.1153 |
| 376497 | SLC27A1 | P19T-E | Human | Esophagus | ESCC | 1.08e-06 | 4.13e-01 | 0.1662 |
| 376497 | SLC27A1 | P20T-E | Human | Esophagus | ESCC | 6.80e-05 | 9.02e-02 | 0.1124 |
| 376497 | SLC27A1 | P21T-E | Human | Esophagus | ESCC | 1.02e-08 | 1.50e-01 | 0.1617 |
| 376497 | SLC27A1 | P22T-E | Human | Esophagus | ESCC | 5.29e-08 | 5.68e-02 | 0.1236 |
| 376497 | SLC27A1 | P23T-E | Human | Esophagus | ESCC | 1.12e-09 | 8.39e-02 | 0.108 |
| 376497 | SLC27A1 | P24T-E | Human | Esophagus | ESCC | 1.74e-05 | 7.97e-02 | 0.1287 |
| 376497 | SLC27A1 | P26T-E | Human | Esophagus | ESCC | 6.41e-03 | 8.11e-02 | 0.1276 |
| 376497 | SLC27A1 | P27T-E | Human | Esophagus | ESCC | 1.09e-05 | 6.36e-02 | 0.1055 |
| 376497 | SLC27A1 | P28T-E | Human | Esophagus | ESCC | 1.09e-15 | 2.14e-01 | 0.1149 |
| 376497 | SLC27A1 | P30T-E | Human | Esophagus | ESCC | 4.59e-08 | 1.39e-01 | 0.137 |
| Page: 1 2 3 |
| Tissue | Expression Dynamics | Abbreviation |
| Esophagus | 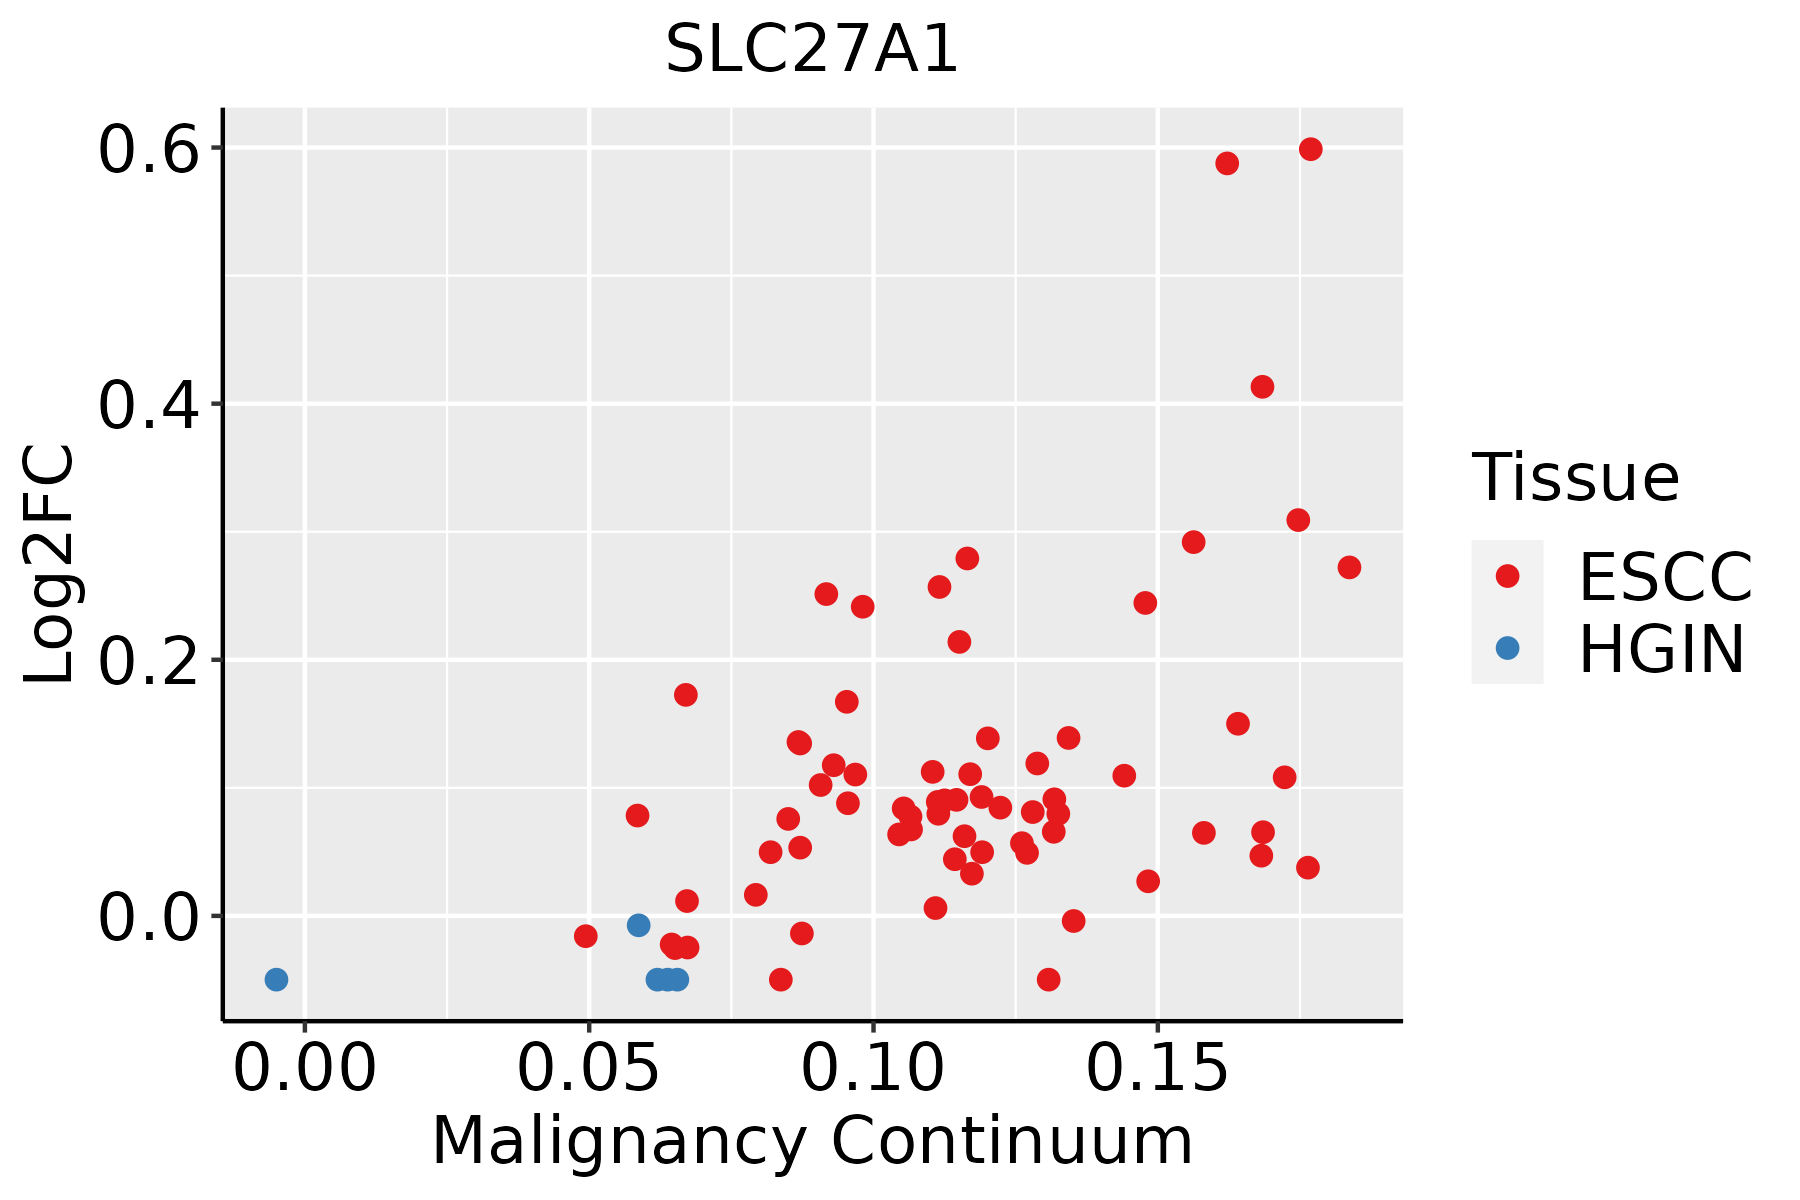 | ESCC: Esophageal squamous cell carcinoma |
| HGIN: High-grade intraepithelial neoplasias | ||
| LGIN: Low-grade intraepithelial neoplasias |
| ∗log2FC in expression of this searched gene in stem-like cells from each diseased tissue sample relative to stem-like cells in normal samples in each tissue plotted against the malignancy continuum. Samples are colored based on if they are from different disease stage. |
Top |
Malignant transformation related pathway analysis |
| Find out the enriched GO biological processes and KEGG pathways involved in transition from healthy to precancer to cancer |
| Tissue | Disease Stage | Enriched GO biological Processes |
| Colorectum | AD |  |
| Colorectum | SER |  |
| Colorectum | MSS |  |
| Colorectum | MSI-H |  |
| Colorectum | FAP |  |
| ∗Top 15 enriched GO BP terms are showed in the bar plot of each disease state in each tissue. Each row represents a significant GO biological process which is colored according to the -log10(p.adjust). |
| Page: 1 2 3 4 5 6 7 8 9 |
| GO ID | Tissue | Disease Stage | Description | Gene Ratio | Bg Ratio | pvalue | p.adjust | Count |
| GO:0010563111 | Esophagus | ESCC | negative regulation of phosphorus metabolic process | 274/8552 | 442/18723 | 2.32e-12 | 9.41e-11 | 274 |
| GO:0045936111 | Esophagus | ESCC | negative regulation of phosphate metabolic process | 273/8552 | 441/18723 | 3.18e-12 | 1.25e-10 | 273 |
| GO:007190016 | Esophagus | ESCC | regulation of protein serine/threonine kinase activity | 227/8552 | 359/18723 | 1.12e-11 | 4.10e-10 | 227 |
| GO:00086544 | Esophagus | ESCC | phospholipid biosynthetic process | 162/8552 | 253/18723 | 2.59e-09 | 5.73e-08 | 162 |
| GO:00464744 | Esophagus | ESCC | glycerophospholipid biosynthetic process | 135/8552 | 211/18723 | 5.75e-08 | 1.02e-06 | 135 |
| GO:00450175 | Esophagus | ESCC | glycerolipid biosynthetic process | 154/8552 | 252/18723 | 5.20e-07 | 6.96e-06 | 154 |
| GO:190165319 | Esophagus | ESCC | cellular response to peptide | 208/8552 | 359/18723 | 1.68e-06 | 2.01e-05 | 208 |
| GO:00719029 | Esophagus | ESCC | positive regulation of protein serine/threonine kinase activity | 124/8552 | 200/18723 | 2.27e-06 | 2.61e-05 | 124 |
| GO:0043434111 | Esophagus | ESCC | response to peptide hormone | 234/8552 | 414/18723 | 4.93e-06 | 5.21e-05 | 234 |
| GO:00066446 | Esophagus | ESCC | phospholipid metabolic process | 218/8552 | 383/18723 | 5.37e-06 | 5.59e-05 | 218 |
| GO:003286918 | Esophagus | ESCC | cellular response to insulin stimulus | 124/8552 | 203/18723 | 6.63e-06 | 6.75e-05 | 124 |
| GO:004586018 | Esophagus | ESCC | positive regulation of protein kinase activity | 219/8552 | 386/18723 | 6.91e-06 | 6.97e-05 | 219 |
| GO:003286818 | Esophagus | ESCC | response to insulin | 156/8552 | 264/18723 | 7.21e-06 | 7.20e-05 | 156 |
| GO:003367420 | Esophagus | ESCC | positive regulation of kinase activity | 260/8552 | 467/18723 | 7.26e-06 | 7.22e-05 | 260 |
| GO:00066318 | Esophagus | ESCC | fatty acid metabolic process | 217/8552 | 390/18723 | 4.21e-05 | 3.39e-04 | 217 |
| GO:007137516 | Esophagus | ESCC | cellular response to peptide hormone stimulus | 166/8552 | 290/18723 | 4.48e-05 | 3.55e-04 | 166 |
| GO:00066561 | Esophagus | ESCC | phosphatidylcholine biosynthetic process | 24/8552 | 29/18723 | 4.50e-05 | 3.55e-04 | 24 |
| GO:00066505 | Esophagus | ESCC | glycerophospholipid metabolic process | 174/8552 | 306/18723 | 4.92e-05 | 3.85e-04 | 174 |
| GO:00065757 | Esophagus | ESCC | cellular modified amino acid metabolic process | 112/8552 | 188/18723 | 8.31e-05 | 6.06e-04 | 112 |
| GO:00423986 | Esophagus | ESCC | cellular modified amino acid biosynthetic process | 34/8552 | 46/18723 | 9.39e-05 | 6.70e-04 | 34 |
| Page: 1 2 |
| Pathway ID | Tissue | Disease Stage | Description | Gene Ratio | Bg Ratio | pvalue | p.adjust | qvalue | Count |
| hsa049318 | Esophagus | ESCC | Insulin resistance | 69/4205 | 108/8465 | 1.92e-03 | 5.54e-03 | 2.84e-03 | 69 |
| hsa0493113 | Esophagus | ESCC | Insulin resistance | 69/4205 | 108/8465 | 1.92e-03 | 5.54e-03 | 2.84e-03 | 69 |
| Page: 1 |
Top |
Cell-cell communication analysis |
| Identification of potential cell-cell interactions between two cell types and their ligand-receptor pairs for different disease states |
| Ligand | Receptor | LRpair | Pathway | Tissue | Disease Stage |
| Page: 1 |
Top |
Single-cell gene regulatory network inference analysis |
| Find out the significant the regulons (TFs) and the target genes of each regulon across cell types for different disease states |
| TF | Cell Type | Tissue | Disease Stage | Target Gene | RSS | Regulon Activity |
| ∗The dot plots of a searched regulon are shown for all cell subpopulations in each disease state of each tissue based on the regulon specific score inferred using pySCENIC and by calculating the average expression. |
| Page: 1 |
Top |
Somatic mutation of malignant transformation related genes |
| Annotation of somatic variants for genes involved in malignant transformation |
| Hugo Symbol | Variant Class | Variant Classification | dbSNP RS | HGVSc | HGVSp | HGVSp Short | SWISSPROT | BIOTYPE | SIFT | PolyPhen | Tumor Sample Barcode | Tissue | Histology | Sex | Age | Stage | Therapy Types | Drugs | Outcome |
| SLC27A1 | SNV | Missense_Mutation | rs369713751 | c.631N>A | p.Glu211Lys | p.E211K | Q6PCB7 | protein_coding | tolerated(0.46) | benign(0.015) | TCGA-AN-A0FL-01 | Breast | breast invasive carcinoma | Female | <65 | I/II | Unknown | Unknown | SD |
| SLC27A1 | SNV | Missense_Mutation | c.1141C>T | p.Arg381Cys | p.R381C | Q6PCB7 | protein_coding | deleterious(0.01) | possibly_damaging(0.717) | TCGA-AO-A0J5-01 | Breast | breast invasive carcinoma | Female | <65 | III/IV | Other, specify in notesBisphosphonate | zoledronic | PD | |
| SLC27A1 | SNV | Missense_Mutation | c.1334N>A | p.Gly445Glu | p.G445E | Q6PCB7 | protein_coding | deleterious(0) | probably_damaging(1) | TCGA-BH-A0HF-01 | Breast | breast invasive carcinoma | Female | >=65 | I/II | Hormone Therapy | arimidex | SD | |
| SLC27A1 | insertion | Frame_Shift_Ins | novel | c.1066_1067insGGCTCACACCTGGAATCTCACACTTTGGG | p.His356ArgfsTer77 | p.H356Rfs*77 | Q6PCB7 | protein_coding | TCGA-BH-A0B1-01 | Breast | breast invasive carcinoma | Female | >=65 | I/II | Chemotherapy | adriamycin | SD | ||
| SLC27A1 | SNV | Missense_Mutation | c.503N>G | p.Ala168Gly | p.A168G | Q6PCB7 | protein_coding | tolerated(0.11) | benign(0.219) | TCGA-DS-A7WF-01 | Cervix | cervical & endocervical cancer | Female | <65 | I/II | Chemotherapy | cisplatin | PD | |
| SLC27A1 | SNV | Missense_Mutation | c.945N>T | p.Lys315Asn | p.K315N | Q6PCB7 | protein_coding | deleterious(0) | probably_damaging(0.916) | TCGA-FU-A3HZ-01 | Cervix | cervical & endocervical cancer | Female | <65 | I/II | Chemotherapy | cisplatin | CR | |
| SLC27A1 | SNV | Missense_Mutation | novel | c.746N>T | p.Thr249Met | p.T249M | Q6PCB7 | protein_coding | deleterious(0) | probably_damaging(1) | TCGA-VS-A8EL-01 | Cervix | cervical & endocervical cancer | Female | <65 | I/II | Chemotherapy | cisplatin | CR |
| SLC27A1 | SNV | Missense_Mutation | rs753383046 | c.1297N>T | p.Arg433Trp | p.R433W | Q6PCB7 | protein_coding | deleterious(0.02) | possibly_damaging(0.841) | TCGA-A6-5665-01 | Colorectum | colon adenocarcinoma | Female | >=65 | I/II | Unknown | Unknown | PD |
| SLC27A1 | SNV | Missense_Mutation | c.1197G>A | p.Met399Ile | p.M399I | Q6PCB7 | protein_coding | tolerated(0.82) | benign(0.006) | TCGA-AA-3489-01 | Colorectum | colon adenocarcinoma | Male | >=65 | I/II | Unknown | Unknown | PD | |
| SLC27A1 | SNV | Missense_Mutation | c.1024N>T | p.Arg342Cys | p.R342C | Q6PCB7 | protein_coding | deleterious(0) | probably_damaging(0.999) | TCGA-AA-3492-01 | Colorectum | colon adenocarcinoma | Female | >=65 | I/II | Unknown | Unknown | SD |
| Page: 1 2 3 4 5 6 7 |
Top |
Related drugs of malignant transformation related genes |
| Identification of chemicals and drugs interact with genes involved in malignant transfromation |
| (DGIdb 4.0) |
| Entrez ID | Symbol | Category | Interaction Types | Drug Claim Name | Drug Name | PMIDs |
| 376497 | SLC27A1 | DRUGGABLE GENOME, EXTERNAL SIDE OF PLASMA MEMBRANE, TRANSPORTER | inhibitor | 252827459 |
| Page: 1 |

Copyright 2023-Present -The University of Texas Health Science Center at Houston |