
|
|||||
|
 | |
| |
| |
| |
| |
| |
|
Gene: SLC26A7 |
Gene summary for SLC26A7 |
| Gene information | Species | Human | Gene symbol | SLC26A7 | Gene ID | 115111 |
| Gene name | solute carrier family 26 member 7 | |
| Gene Alias | SUT2 | |
| Cytomap | 8q21.3 | |
| Gene Type | protein-coding | GO ID | GO:0001696 | UniProtAcc | Q8TE54 |
Top |
Malignant transformation analysis |
| Identification of the aberrant gene expression in precancerous and cancerous lesions by comparing the gene expression of stem-like cells in diseased tissues with normal stem cells |
| Entrez ID | Symbol | Replicates | Species | Organ | Tissue | Adj P-value | Log2FC | Malignancy |
| 115111 | SLC26A7 | Adj_PTCwithHT_6 | Human | Thyroid | HT | 9.30e-59 | -1.41e+00 | 0.02 |
| 115111 | SLC26A7 | Adj_PTCwithHT_8 | Human | Thyroid | HT | 7.13e-24 | -9.70e-01 | 0.0267 |
| 115111 | SLC26A7 | PTCwithHT_1 | Human | Thyroid | HT | 1.65e-24 | -1.43e+00 | 0.0238 |
| 115111 | SLC26A7 | PTCwithHT_6 | Human | Thyroid | HT | 5.97e-59 | -1.43e+00 | 0.02 |
| 115111 | SLC26A7 | PTCwithHT_8 | Human | Thyroid | HT | 1.67e-56 | -1.39e+00 | 0.0351 |
| 115111 | SLC26A7 | PTCwithoutHT_2 | Human | Thyroid | PTC | 4.79e-52 | -1.36e+00 | 0.0419 |
| 115111 | SLC26A7 | PTCwithoutHT_4_2 | Human | Thyroid | PTC | 3.08e-05 | -8.84e-01 | 0.0455 |
| 115111 | SLC26A7 | PTCwithoutHT_7 | Human | Thyroid | PTC | 2.31e-21 | -1.38e+00 | 0.0381 |
| 115111 | SLC26A7 | male-WTA | Human | Thyroid | PTC | 6.34e-45 | -5.67e-01 | 0.1037 |
| 115111 | SLC26A7 | female-WTA | Human | Thyroid | PTC | 2.47e-10 | -9.04e-01 | 0.0726 |
| 115111 | SLC26A7 | PTC01 | Human | Thyroid | PTC | 5.55e-14 | -8.20e-01 | 0.1899 |
| 115111 | SLC26A7 | ATC08 | Human | Thyroid | ATC | 7.77e-24 | -1.40e+00 | 0.0541 |
| 115111 | SLC26A7 | ATC09 | Human | Thyroid | ATC | 1.52e-25 | -1.43e+00 | 0.2871 |
| 115111 | SLC26A7 | ATC11 | Human | Thyroid | ATC | 1.60e-07 | -1.43e+00 | 0.3386 |
| 115111 | SLC26A7 | ATC12 | Human | Thyroid | ATC | 4.36e-64 | -1.43e+00 | 0.34 |
| 115111 | SLC26A7 | ATC13 | Human | Thyroid | ATC | 2.80e-44 | -1.35e+00 | 0.34 |
| 115111 | SLC26A7 | ATC1 | Human | Thyroid | ATC | 7.48e-22 | -1.43e+00 | 0.2878 |
| 115111 | SLC26A7 | ATC2 | Human | Thyroid | ATC | 1.60e-07 | -1.43e+00 | 0.34 |
| 115111 | SLC26A7 | ATC3 | Human | Thyroid | ATC | 1.06e-11 | -1.43e+00 | 0.338 |
| 115111 | SLC26A7 | ATC4 | Human | Thyroid | ATC | 3.14e-60 | -1.43e+00 | 0.34 |
| Page: 1 2 |
| Tissue | Expression Dynamics | Abbreviation |
| Thyroid | 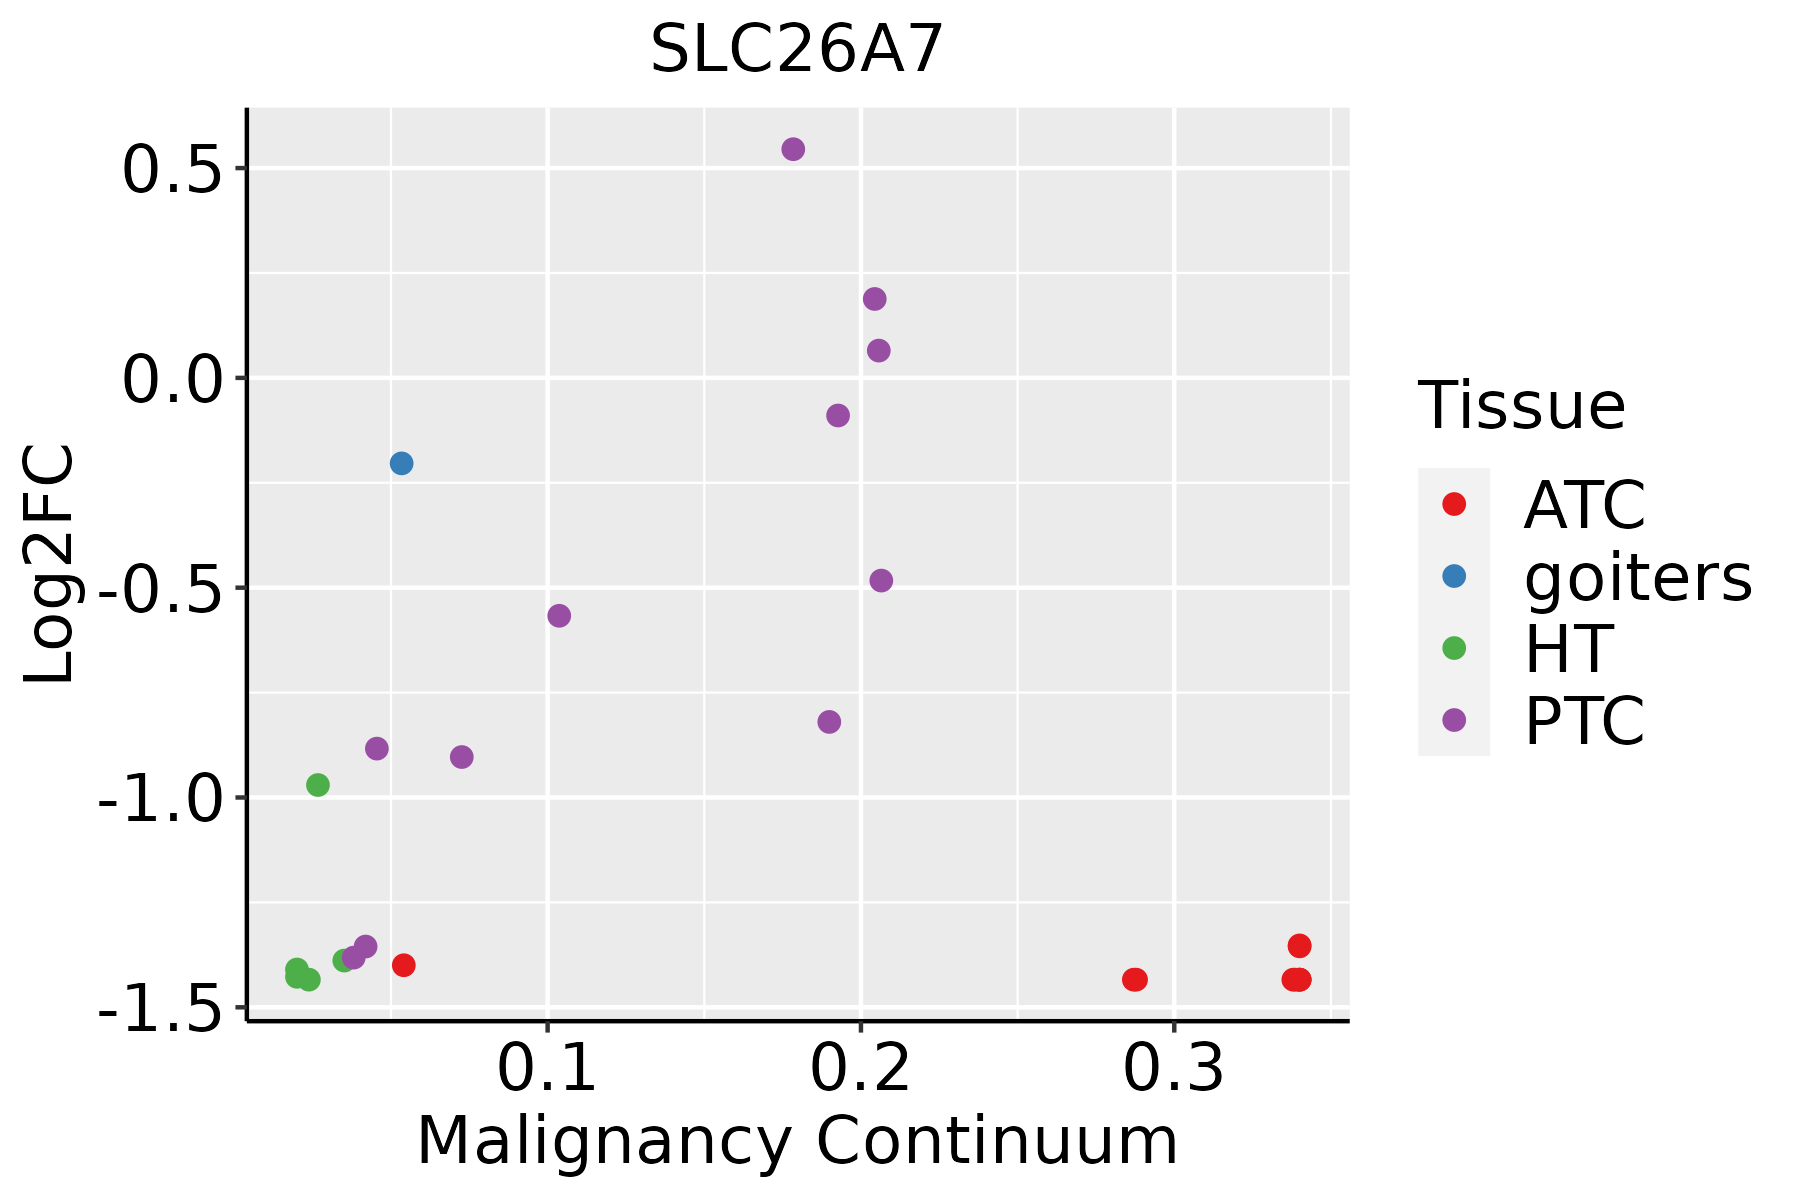 | ATC: Anaplastic thyroid cancer |
| HT: Hashimoto's thyroiditis | ||
| PTC: Papillary thyroid cancer |
| ∗log2FC in expression of this searched gene in stem-like cells from each diseased tissue sample relative to stem-like cells in normal samples in each tissue plotted against the malignancy continuum. Samples are colored based on if they are from different disease stage. |
Top |
Malignant transformation related pathway analysis |
| Find out the enriched GO biological processes and KEGG pathways involved in transition from healthy to precancer to cancer |
| Tissue | Disease Stage | Enriched GO biological Processes |
| Colorectum | AD |  |
| Colorectum | SER |  |
| Colorectum | MSS |  |
| Colorectum | MSI-H |  |
| Colorectum | FAP |  |
| ∗Top 15 enriched GO BP terms are showed in the bar plot of each disease state in each tissue. Each row represents a significant GO biological process which is colored according to the -log10(p.adjust). |
| Page: 1 2 3 4 5 6 7 8 9 |
| GO ID | Tissue | Disease Stage | Description | Gene Ratio | Bg Ratio | pvalue | p.adjust | Count |
| Page: 1 |
| Pathway ID | Tissue | Disease Stage | Description | Gene Ratio | Bg Ratio | pvalue | p.adjust | qvalue | Count |
| Page: 1 |
Top |
Cell-cell communication analysis |
| Identification of potential cell-cell interactions between two cell types and their ligand-receptor pairs for different disease states |
| Ligand | Receptor | LRpair | Pathway | Tissue | Disease Stage |
| Page: 1 |
Top |
Single-cell gene regulatory network inference analysis |
| Find out the significant the regulons (TFs) and the target genes of each regulon across cell types for different disease states |
| TF | Cell Type | Tissue | Disease Stage | Target Gene | RSS | Regulon Activity |
| ∗The dot plots of a searched regulon are shown for all cell subpopulations in each disease state of each tissue based on the regulon specific score inferred using pySCENIC and by calculating the average expression. |
| Page: 1 |
Top |
Somatic mutation of malignant transformation related genes |
| Annotation of somatic variants for genes involved in malignant transformation |
| Hugo Symbol | Variant Class | Variant Classification | dbSNP RS | HGVSc | HGVSp | HGVSp Short | SWISSPROT | BIOTYPE | SIFT | PolyPhen | Tumor Sample Barcode | Tissue | Histology | Sex | Age | Stage | Therapy Types | Drugs | Outcome |
| SLC26A7 | SNV | Missense_Mutation | novel | c.1515C>G | p.Ile505Met | p.I505M | Q8TE54 | protein_coding | tolerated(0.07) | benign(0.277) | TCGA-3C-AALI-01 | Breast | breast invasive carcinoma | Female | <65 | I/II | Unspecific | Poly E | Complete Response |
| SLC26A7 | SNV | Missense_Mutation | novel | c.614A>C | p.Tyr205Ser | p.Y205S | Q8TE54 | protein_coding | tolerated(0.1) | possibly_damaging(0.526) | TCGA-B6-A0I6-01 | Breast | breast invasive carcinoma | Female | <65 | I/II | Unknown | Unknown | PD |
| SLC26A7 | SNV | Missense_Mutation | c.1237N>G | p.Ile413Val | p.I413V | Q8TE54 | protein_coding | tolerated(0.95) | probably_damaging(0.978) | TCGA-BH-A0H7-01 | Breast | breast invasive carcinoma | Female | >=65 | III/IV | Chemotherapy | doxorubicin | SD | |
| SLC26A7 | SNV | Missense_Mutation | c.1969N>A | p.Leu657Ile | p.L657I | Q8TE54 | protein_coding | tolerated_low_confidence(0.11) | benign(0.001) | TCGA-BH-A0HI-01 | Breast | breast invasive carcinoma | Female | >=65 | I/II | Hormone Therapy | arimidex | SD | |
| SLC26A7 | SNV | Missense_Mutation | novel | c.1213N>G | p.Pro405Ala | p.P405A | Q8TE54 | protein_coding | deleterious(0) | probably_damaging(0.997) | TCGA-C8-A12X-01 | Breast | breast invasive carcinoma | Female | <65 | I/II | Unknown | Unknown | SD |
| SLC26A7 | SNV | Missense_Mutation | c.727N>T | p.Leu243Phe | p.L243F | Q8TE54 | protein_coding | tolerated(0.17) | probably_damaging(0.999) | TCGA-C8-A1HM-01 | Breast | breast invasive carcinoma | Female | >=65 | I/II | Chemotherapy | doxorubicin | CR | |
| SLC26A7 | deletion | Frame_Shift_Del | rs749030792 | c.58delC | p.Gln20SerfsTer24 | p.Q20Sfs*24 | Q8TE54 | protein_coding | TCGA-AO-A03O-01 | Breast | breast invasive carcinoma | Female | >=65 | I/II | Chemotherapy | doxorubicin | SD | ||
| SLC26A7 | insertion | Frame_Shift_Ins | novel | c.1409_1410insGACTCAGAGTCATCATGGGAAGCTAAAAT | p.Arg471ThrfsTer16 | p.R471Tfs*16 | Q8TE54 | protein_coding | TCGA-BH-A0DP-01 | Breast | breast invasive carcinoma | Female | <65 | I/II | Hormone Therapy | arimidex | SD | ||
| SLC26A7 | insertion | Frame_Shift_Ins | novel | c.1280_1281insA | p.Tyr430IlefsTer6 | p.Y430Ifs*6 | Q8TE54 | protein_coding | TCGA-D8-A1X5-01 | Breast | breast invasive carcinoma | Female | >=65 | III/IV | Hormone Therapy | tamoxiphen | SD | ||
| SLC26A7 | SNV | Missense_Mutation | novel | c.1276N>T | p.Asp426Tyr | p.D426Y | Q8TE54 | protein_coding | deleterious(0) | probably_damaging(0.999) | TCGA-2W-A8YY-01 | Cervix | cervical & endocervical cancer | Female | <65 | I/II | Chemotherapy | cisplatin | CR |
| Page: 1 2 3 4 5 6 7 8 9 10 11 12 13 14 |
Top |
Related drugs of malignant transformation related genes |
| Identification of chemicals and drugs interact with genes involved in malignant transfromation |
| (DGIdb 4.0) |
| Entrez ID | Symbol | Category | Interaction Types | Drug Claim Name | Drug Name | PMIDs |
| Page: 1 |

Copyright 2023-Present -The University of Texas Health Science Center at Houston |