
|
|||||
|
 | |
| |
| |
| |
| |
| |
|
Gene: SLC26A3 |
Gene summary for SLC26A3 |
| Gene information | Species | Human | Gene symbol | SLC26A3 | Gene ID | 1811 |
| Gene name | solute carrier family 26 member 3 | |
| Gene Alias | CLD | |
| Cytomap | 7q22.3-q31.1 | |
| Gene Type | protein-coding | GO ID | GO:0000003 | UniProtAcc | P40879 |
Top |
Malignant transformation analysis |
| Identification of the aberrant gene expression in precancerous and cancerous lesions by comparing the gene expression of stem-like cells in diseased tissues with normal stem cells |
| Entrez ID | Symbol | Replicates | Species | Organ | Tissue | Adj P-value | Log2FC | Malignancy |
| 1811 | SLC26A3 | HTA11_3410_2000001011 | Human | Colorectum | AD | 4.11e-31 | -8.94e-01 | 0.0155 |
| 1811 | SLC26A3 | HTA11_2487_2000001011 | Human | Colorectum | SER | 4.00e-02 | 1.28e+00 | -0.1808 |
| 1811 | SLC26A3 | HTA11_78_2000001011 | Human | Colorectum | AD | 2.33e-04 | 9.43e-01 | -0.1088 |
| 1811 | SLC26A3 | HTA11_347_2000001011 | Human | Colorectum | AD | 1.11e-06 | 1.60e+00 | -0.1954 |
| 1811 | SLC26A3 | HTA11_411_2000001011 | Human | Colorectum | SER | 8.36e-03 | 8.03e-01 | -0.2602 |
| 1811 | SLC26A3 | HTA11_2112_2000001011 | Human | Colorectum | SER | 3.63e-10 | 1.20e+00 | -0.2196 |
| 1811 | SLC26A3 | HTA11_3361_2000001011 | Human | Colorectum | AD | 7.81e-15 | 1.11e+00 | -0.1207 |
| 1811 | SLC26A3 | HTA11_83_2000001011 | Human | Colorectum | SER | 2.41e-05 | 7.40e-01 | -0.1526 |
| 1811 | SLC26A3 | HTA11_696_2000001011 | Human | Colorectum | AD | 2.90e-07 | 1.05e+00 | -0.1464 |
| 1811 | SLC26A3 | HTA11_2992_2000001011 | Human | Colorectum | SER | 1.87e-03 | 1.05e+00 | -0.1706 |
| 1811 | SLC26A3 | HTA11_5212_2000001011 | Human | Colorectum | AD | 1.87e-15 | 1.71e+00 | -0.2061 |
| 1811 | SLC26A3 | HTA11_7862_2000001011 | Human | Colorectum | AD | 2.79e-05 | -7.41e-01 | -0.0179 |
| 1811 | SLC26A3 | HTA11_866_3004761011 | Human | Colorectum | AD | 5.54e-26 | -8.57e-01 | 0.096 |
| 1811 | SLC26A3 | HTA11_4255_2000001011 | Human | Colorectum | SER | 8.72e-05 | -9.32e-01 | 0.0446 |
| 1811 | SLC26A3 | HTA11_9408_2000001011 | Human | Colorectum | AD | 4.54e-04 | -9.80e-01 | 0.0451 |
| 1811 | SLC26A3 | HTA11_8622_2000001021 | Human | Colorectum | SER | 1.96e-05 | -7.76e-01 | 0.0528 |
| 1811 | SLC26A3 | HTA11_10623_2000001011 | Human | Colorectum | AD | 5.25e-10 | -9.56e-01 | -0.0177 |
| 1811 | SLC26A3 | HTA11_10711_2000001011 | Human | Colorectum | AD | 2.85e-23 | -9.99e-01 | 0.0338 |
| 1811 | SLC26A3 | HTA11_7696_3000711011 | Human | Colorectum | AD | 1.98e-41 | -1.01e+00 | 0.0674 |
| 1811 | SLC26A3 | HTA11_6818_2000001011 | Human | Colorectum | AD | 6.14e-03 | -6.37e-01 | 0.0112 |
| Page: 1 2 3 |
| Tissue | Expression Dynamics | Abbreviation |
| Colorectum (GSE201348) |  | FAP: Familial adenomatous polyposis |
| CRC: Colorectal cancer | ||
| Colorectum (HTA11) |  | AD: Adenomas |
| SER: Sessile serrated lesions | ||
| MSI-H: Microsatellite-high colorectal cancer | ||
| MSS: Microsatellite stable colorectal cancer | ||
| GC | 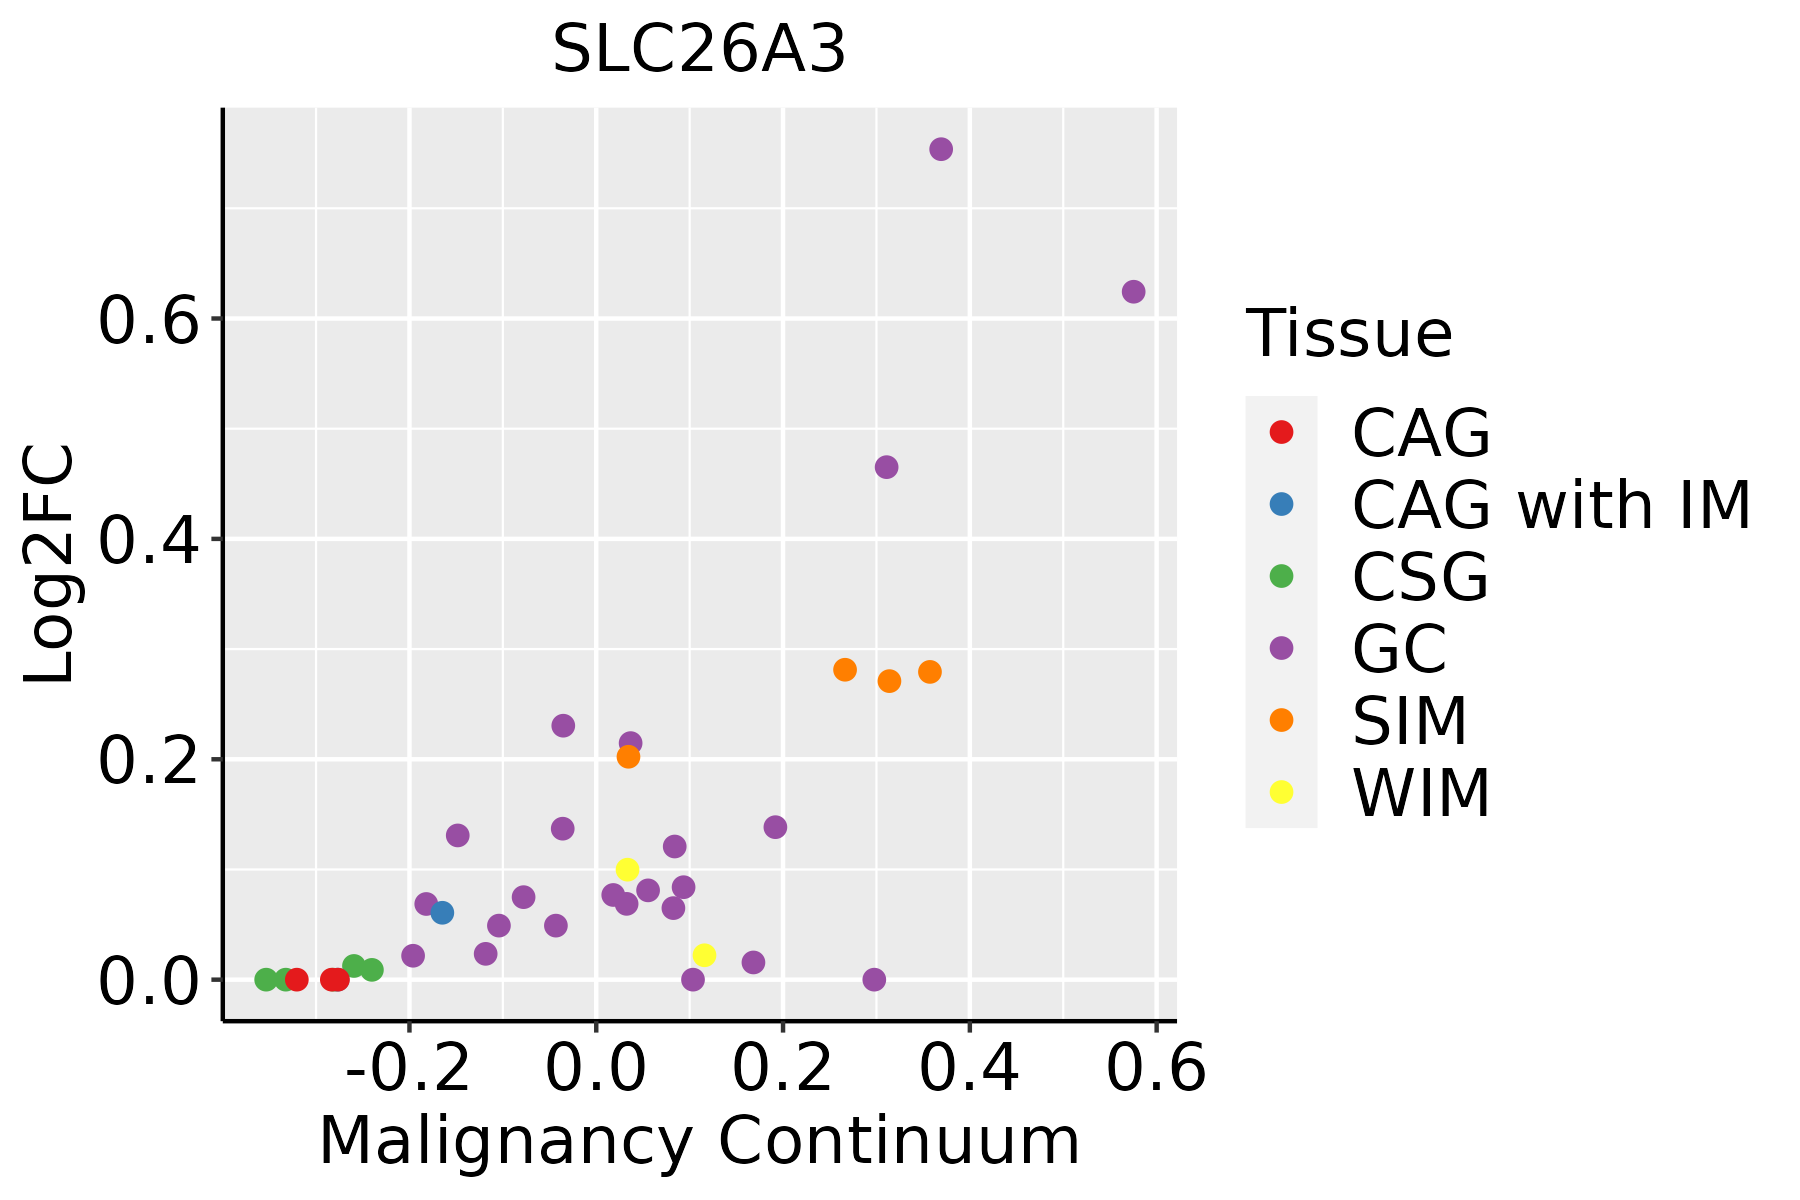 | CAG: Chronic atrophic gastritis |
| CAG with IM: Chronic atrophic gastritis with intestinal metaplasia | ||
| CSG: Chronic superficial gastritis | ||
| GC: Gastric cancer | ||
| SIM: Severe intestinal metaplasia | ||
| WIM: Wild intestinal metaplasia |
| ∗log2FC in expression of this searched gene in stem-like cells from each diseased tissue sample relative to stem-like cells in normal samples in each tissue plotted against the malignancy continuum. Samples are colored based on if they are from different disease stage. |
Top |
Malignant transformation related pathway analysis |
| Find out the enriched GO biological processes and KEGG pathways involved in transition from healthy to precancer to cancer |
| Tissue | Disease Stage | Enriched GO biological Processes |
| Colorectum | AD |  |
| Colorectum | SER |  |
| Colorectum | MSS |  |
| Colorectum | MSI-H |  |
| Colorectum | FAP |  |
| ∗Top 15 enriched GO BP terms are showed in the bar plot of each disease state in each tissue. Each row represents a significant GO biological process which is colored according to the -log10(p.adjust). |
| Page: 1 2 3 4 5 6 7 8 9 |
| GO ID | Tissue | Disease Stage | Description | Gene Ratio | Bg Ratio | pvalue | p.adjust | Count |
| GO:0030004 | Colorectum | AD | cellular monovalent inorganic cation homeostasis | 36/3918 | 103/18723 | 6.80e-04 | 6.95e-03 | 36 |
| GO:0030641 | Colorectum | AD | regulation of cellular pH | 29/3918 | 81/18723 | 1.42e-03 | 1.22e-02 | 29 |
| GO:0051591 | Colorectum | AD | response to cAMP | 31/3918 | 93/18723 | 3.59e-03 | 2.58e-02 | 31 |
| GO:0071320 | Colorectum | AD | cellular response to cAMP | 20/3918 | 53/18723 | 3.71e-03 | 2.62e-02 | 20 |
| GO:0051453 | Colorectum | AD | regulation of intracellular pH | 26/3918 | 75/18723 | 4.04e-03 | 2.82e-02 | 26 |
| GO:0006885 | Colorectum | AD | regulation of pH | 30/3918 | 91/18723 | 4.95e-03 | 3.32e-02 | 30 |
| GO:0055067 | Colorectum | AD | monovalent inorganic cation homeostasis | 45/3918 | 151/18723 | 6.19e-03 | 3.88e-02 | 45 |
| GO:0015698 | Colorectum | AD | inorganic anion transport | 52/3918 | 180/18723 | 6.83e-03 | 4.22e-02 | 52 |
| GO:00300041 | Colorectum | SER | cellular monovalent inorganic cation homeostasis | 31/2897 | 103/18723 | 1.31e-04 | 2.66e-03 | 31 |
| GO:00306411 | Colorectum | SER | regulation of cellular pH | 24/2897 | 81/18723 | 9.20e-04 | 1.11e-02 | 24 |
| GO:00550671 | Colorectum | SER | monovalent inorganic cation homeostasis | 37/2897 | 151/18723 | 2.48e-03 | 2.33e-02 | 37 |
| GO:00514531 | Colorectum | SER | regulation of intracellular pH | 21/2897 | 75/18723 | 3.97e-03 | 3.26e-02 | 21 |
| GO:00068851 | Colorectum | SER | regulation of pH | 24/2897 | 91/18723 | 5.03e-03 | 3.88e-02 | 24 |
| GO:00713201 | Colorectum | SER | cellular response to cAMP | 16/2897 | 53/18723 | 5.09e-03 | 3.91e-02 | 16 |
| GO:00300042 | Colorectum | MSS | cellular monovalent inorganic cation homeostasis | 31/3467 | 103/18723 | 2.94e-03 | 2.27e-02 | 31 |
| GO:00306412 | Colorectum | MSS | regulation of cellular pH | 25/3467 | 81/18723 | 4.97e-03 | 3.46e-02 | 25 |
| GO:00515911 | Colorectum | FAP | response to cAMP | 27/2622 | 93/18723 | 1.26e-04 | 2.03e-03 | 27 |
| GO:00300043 | Colorectum | FAP | cellular monovalent inorganic cation homeostasis | 28/2622 | 103/18723 | 3.23e-04 | 4.15e-03 | 28 |
| GO:00514532 | Colorectum | FAP | regulation of intracellular pH | 22/2622 | 75/18723 | 4.38e-04 | 5.21e-03 | 22 |
| GO:0046683 | Colorectum | FAP | response to organophosphorus | 33/2622 | 131/18723 | 4.61e-04 | 5.39e-03 | 33 |
| Page: 1 2 3 |
| Pathway ID | Tissue | Disease Stage | Description | Gene Ratio | Bg Ratio | pvalue | p.adjust | qvalue | Count |
| hsa04972 | Colorectum | AD | Pancreatic secretion | 36/2092 | 102/8465 | 1.06e-02 | 3.98e-02 | 2.54e-02 | 36 |
| hsa049721 | Colorectum | AD | Pancreatic secretion | 36/2092 | 102/8465 | 1.06e-02 | 3.98e-02 | 2.54e-02 | 36 |
| hsa049722 | Colorectum | SER | Pancreatic secretion | 30/1580 | 102/8465 | 5.41e-03 | 3.28e-02 | 2.38e-02 | 30 |
| hsa049723 | Colorectum | SER | Pancreatic secretion | 30/1580 | 102/8465 | 5.41e-03 | 3.28e-02 | 2.38e-02 | 30 |
| hsa049724 | Colorectum | MSS | Pancreatic secretion | 33/1875 | 102/8465 | 1.09e-02 | 3.75e-02 | 2.30e-02 | 33 |
| hsa049725 | Colorectum | MSS | Pancreatic secretion | 33/1875 | 102/8465 | 1.09e-02 | 3.75e-02 | 2.30e-02 | 33 |
| hsa049726 | Colorectum | FAP | Pancreatic secretion | 34/1404 | 102/8465 | 2.43e-05 | 2.78e-04 | 1.69e-04 | 34 |
| hsa049727 | Colorectum | FAP | Pancreatic secretion | 34/1404 | 102/8465 | 2.43e-05 | 2.78e-04 | 1.69e-04 | 34 |
| hsa049728 | Colorectum | CRC | Pancreatic secretion | 32/1091 | 102/8465 | 7.86e-07 | 4.37e-05 | 2.96e-05 | 32 |
| hsa049729 | Colorectum | CRC | Pancreatic secretion | 32/1091 | 102/8465 | 7.86e-07 | 4.37e-05 | 2.96e-05 | 32 |
| hsa04978 | Stomach | GC | Mineral absorption | 15/708 | 60/8465 | 8.88e-05 | 9.80e-04 | 6.90e-04 | 15 |
| hsa049781 | Stomach | GC | Mineral absorption | 15/708 | 60/8465 | 8.88e-05 | 9.80e-04 | 6.90e-04 | 15 |
| hsa049788 | Stomach | SIM | Mineral absorption | 11/465 | 60/8465 | 3.61e-04 | 3.41e-03 | 2.74e-03 | 11 |
| hsa049789 | Stomach | SIM | Mineral absorption | 11/465 | 60/8465 | 3.61e-04 | 3.41e-03 | 2.74e-03 | 11 |
| Page: 1 |
Top |
Cell-cell communication analysis |
| Identification of potential cell-cell interactions between two cell types and their ligand-receptor pairs for different disease states |
| Ligand | Receptor | LRpair | Pathway | Tissue | Disease Stage |
| Page: 1 |
Top |
Single-cell gene regulatory network inference analysis |
| Find out the significant the regulons (TFs) and the target genes of each regulon across cell types for different disease states |
| TF | Cell Type | Tissue | Disease Stage | Target Gene | RSS | Regulon Activity |
| ∗The dot plots of a searched regulon are shown for all cell subpopulations in each disease state of each tissue based on the regulon specific score inferred using pySCENIC and by calculating the average expression. |
| Page: 1 |
Top |
Somatic mutation of malignant transformation related genes |
| Annotation of somatic variants for genes involved in malignant transformation |
| Hugo Symbol | Variant Class | Variant Classification | dbSNP RS | HGVSc | HGVSp | HGVSp Short | SWISSPROT | BIOTYPE | SIFT | PolyPhen | Tumor Sample Barcode | Tissue | Histology | Sex | Age | Stage | Therapy Types | Drugs | Outcome |
| SLC26A3 | SNV | Missense_Mutation | c.955G>T | p.Gly319Trp | p.G319W | P40879 | protein_coding | deleterious(0) | probably_damaging(0.999) | TCGA-A7-A0CE-01 | Breast | breast invasive carcinoma | Female | <65 | I/II | Chemotherapy | adriamycin | SD | |
| SLC26A3 | SNV | Missense_Mutation | rs746185703 | c.1697G>A | p.Arg566Gln | p.R566Q | P40879 | protein_coding | tolerated(0.06) | probably_damaging(0.981) | TCGA-AN-A046-01 | Breast | breast invasive carcinoma | Female | >=65 | I/II | Unknown | Unknown | SD |
| SLC26A3 | SNV | Missense_Mutation | rs776026508 | c.877G>A | p.Glu293Lys | p.E293K | P40879 | protein_coding | deleterious(0) | probably_damaging(1) | TCGA-AN-A046-01 | Breast | breast invasive carcinoma | Female | >=65 | I/II | Unknown | Unknown | SD |
| SLC26A3 | SNV | Missense_Mutation | c.1388N>T | p.Arg463Leu | p.R463L | P40879 | protein_coding | deleterious(0.03) | possibly_damaging(0.877) | TCGA-AN-A0XN-01 | Breast | breast invasive carcinoma | Female | >=65 | III/IV | Unknown | Unknown | SD | |
| SLC26A3 | SNV | Missense_Mutation | rs765288477 | c.2255N>A | p.Arg752His | p.R752H | P40879 | protein_coding | deleterious_low_confidence(0.01) | benign(0.031) | TCGA-AR-A24T-01 | Breast | breast invasive carcinoma | Female | <65 | III/IV | Chemotherapy | cytoxan | SD |
| SLC26A3 | SNV | Missense_Mutation | c.446N>A | p.Val149Asp | p.V149D | P40879 | protein_coding | deleterious(0.04) | benign(0.273) | TCGA-C8-A274-01 | Breast | breast invasive carcinoma | Female | <65 | I/II | Hormone Therapy | tamoxiphen | SD | |
| SLC26A3 | SNV | Missense_Mutation | novel | c.533C>A | p.Ala178Glu | p.A178E | P40879 | protein_coding | deleterious(0) | benign(0) | TCGA-D8-A73X-01 | Breast | breast invasive carcinoma | Female | <65 | I/II | Hormone Therapy | tamoxiphen | SD |
| SLC26A3 | insertion | Nonsense_Mutation | novel | c.2292_2293insAACTGGCACCTGGAAGAAGACAGAAAGTTCTTGTAGGTGCCAGTTGAAACAAAATTC | P40879 | protein_coding | TCGA-A7-A0DB-01 | Breast | breast invasive carcinoma | Female | <65 | I/II | Hormone Therapy | arimidex | SD | ||||
| SLC26A3 | deletion | Frame_Shift_Del | novel | c.466delN | p.Thr156LeufsTer19 | p.T156Lfs*19 | P40879 | protein_coding | TCGA-EW-A2FV-01 | Breast | breast invasive carcinoma | Female | <65 | III/IV | Chemotherapy | docetaxel | SD | ||
| SLC26A3 | SNV | Missense_Mutation | novel | c.976N>A | p.Gln326Lys | p.Q326K | P40879 | protein_coding | tolerated(0.79) | benign(0.005) | TCGA-C5-A8YT-01 | Cervix | cervical & endocervical cancer | Female | <65 | I/II | Chemotherapy | cisplatin | PD |
| Page: 1 2 3 4 5 6 7 8 9 10 11 12 |
Top |
Related drugs of malignant transformation related genes |
| Identification of chemicals and drugs interact with genes involved in malignant transfromation |
| (DGIdb 4.0) |
| Entrez ID | Symbol | Category | Interaction Types | Drug Claim Name | Drug Name | PMIDs |
| Page: 1 |

Copyright 2023-Present -The University of Texas Health Science Center at Houston |