
|
|||||
|
 | |
| |
| |
| |
| |
| |
|
Gene: SLC25A51 |
Gene summary for SLC25A51 |
| Gene information | Species | Human | Gene symbol | SLC25A51 | Gene ID | 92014 |
| Gene name | solute carrier family 25 member 51 | |
| Gene Alias | CG7943 | |
| Cytomap | 9p13.2-p13.1 | |
| Gene Type | protein-coding | GO ID | GO:0006091 | UniProtAcc | Q9H1U9 |
Top |
Malignant transformation analysis |
| Identification of the aberrant gene expression in precancerous and cancerous lesions by comparing the gene expression of stem-like cells in diseased tissues with normal stem cells |
| Entrez ID | Symbol | Replicates | Species | Organ | Tissue | Adj P-value | Log2FC | Malignancy |
| 92014 | SLC25A51 | LZE4T | Human | Esophagus | ESCC | 4.16e-09 | 2.13e-01 | 0.0811 |
| 92014 | SLC25A51 | LZE7T | Human | Esophagus | ESCC | 6.13e-07 | 2.30e-01 | 0.0667 |
| 92014 | SLC25A51 | LZE24T | Human | Esophagus | ESCC | 8.32e-07 | 1.86e-01 | 0.0596 |
| 92014 | SLC25A51 | LZE6T | Human | Esophagus | ESCC | 1.62e-03 | 1.53e-01 | 0.0845 |
| 92014 | SLC25A51 | P2T-E | Human | Esophagus | ESCC | 4.98e-16 | 2.88e-01 | 0.1177 |
| 92014 | SLC25A51 | P4T-E | Human | Esophagus | ESCC | 3.86e-05 | 1.90e-01 | 0.1323 |
| 92014 | SLC25A51 | P5T-E | Human | Esophagus | ESCC | 1.20e-02 | 9.43e-02 | 0.1327 |
| 92014 | SLC25A51 | P8T-E | Human | Esophagus | ESCC | 9.81e-08 | 8.91e-02 | 0.0889 |
| 92014 | SLC25A51 | P9T-E | Human | Esophagus | ESCC | 2.11e-05 | 1.16e-01 | 0.1131 |
| 92014 | SLC25A51 | P10T-E | Human | Esophagus | ESCC | 1.05e-13 | 2.50e-01 | 0.116 |
| 92014 | SLC25A51 | P11T-E | Human | Esophagus | ESCC | 2.89e-10 | 4.09e-01 | 0.1426 |
| 92014 | SLC25A51 | P12T-E | Human | Esophagus | ESCC | 7.67e-06 | 1.22e-01 | 0.1122 |
| 92014 | SLC25A51 | P15T-E | Human | Esophagus | ESCC | 8.58e-10 | 2.28e-01 | 0.1149 |
| 92014 | SLC25A51 | P16T-E | Human | Esophagus | ESCC | 1.32e-06 | 1.42e-01 | 0.1153 |
| 92014 | SLC25A51 | P20T-E | Human | Esophagus | ESCC | 6.33e-07 | 1.27e-01 | 0.1124 |
| 92014 | SLC25A51 | P21T-E | Human | Esophagus | ESCC | 3.00e-12 | 2.28e-01 | 0.1617 |
| 92014 | SLC25A51 | P22T-E | Human | Esophagus | ESCC | 1.44e-07 | 1.46e-01 | 0.1236 |
| 92014 | SLC25A51 | P23T-E | Human | Esophagus | ESCC | 2.96e-02 | 8.42e-02 | 0.108 |
| 92014 | SLC25A51 | P24T-E | Human | Esophagus | ESCC | 6.29e-10 | 2.10e-01 | 0.1287 |
| 92014 | SLC25A51 | P26T-E | Human | Esophagus | ESCC | 2.81e-12 | 1.78e-01 | 0.1276 |
| Page: 1 2 3 4 |
| Tissue | Expression Dynamics | Abbreviation |
| Esophagus | 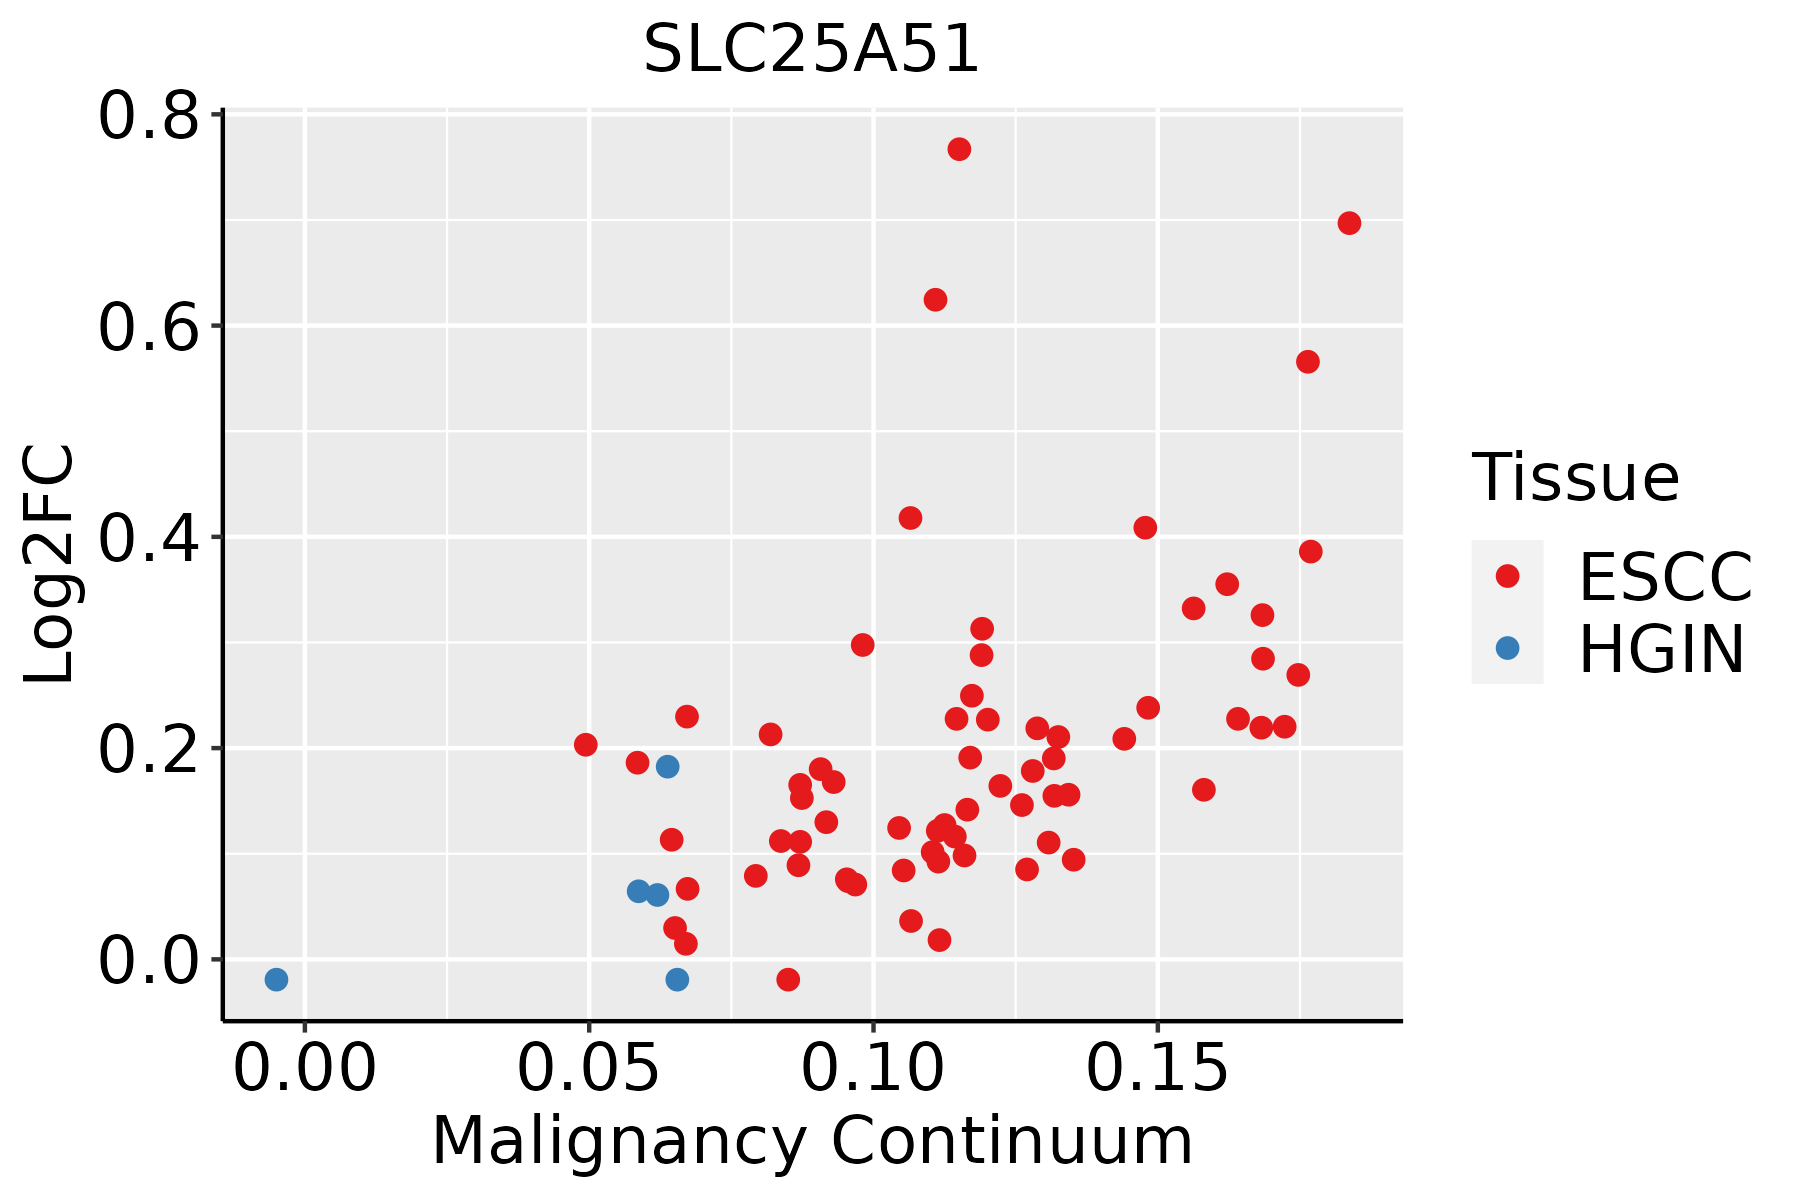 | ESCC: Esophageal squamous cell carcinoma |
| HGIN: High-grade intraepithelial neoplasias | ||
| LGIN: Low-grade intraepithelial neoplasias | ||
| Liver | 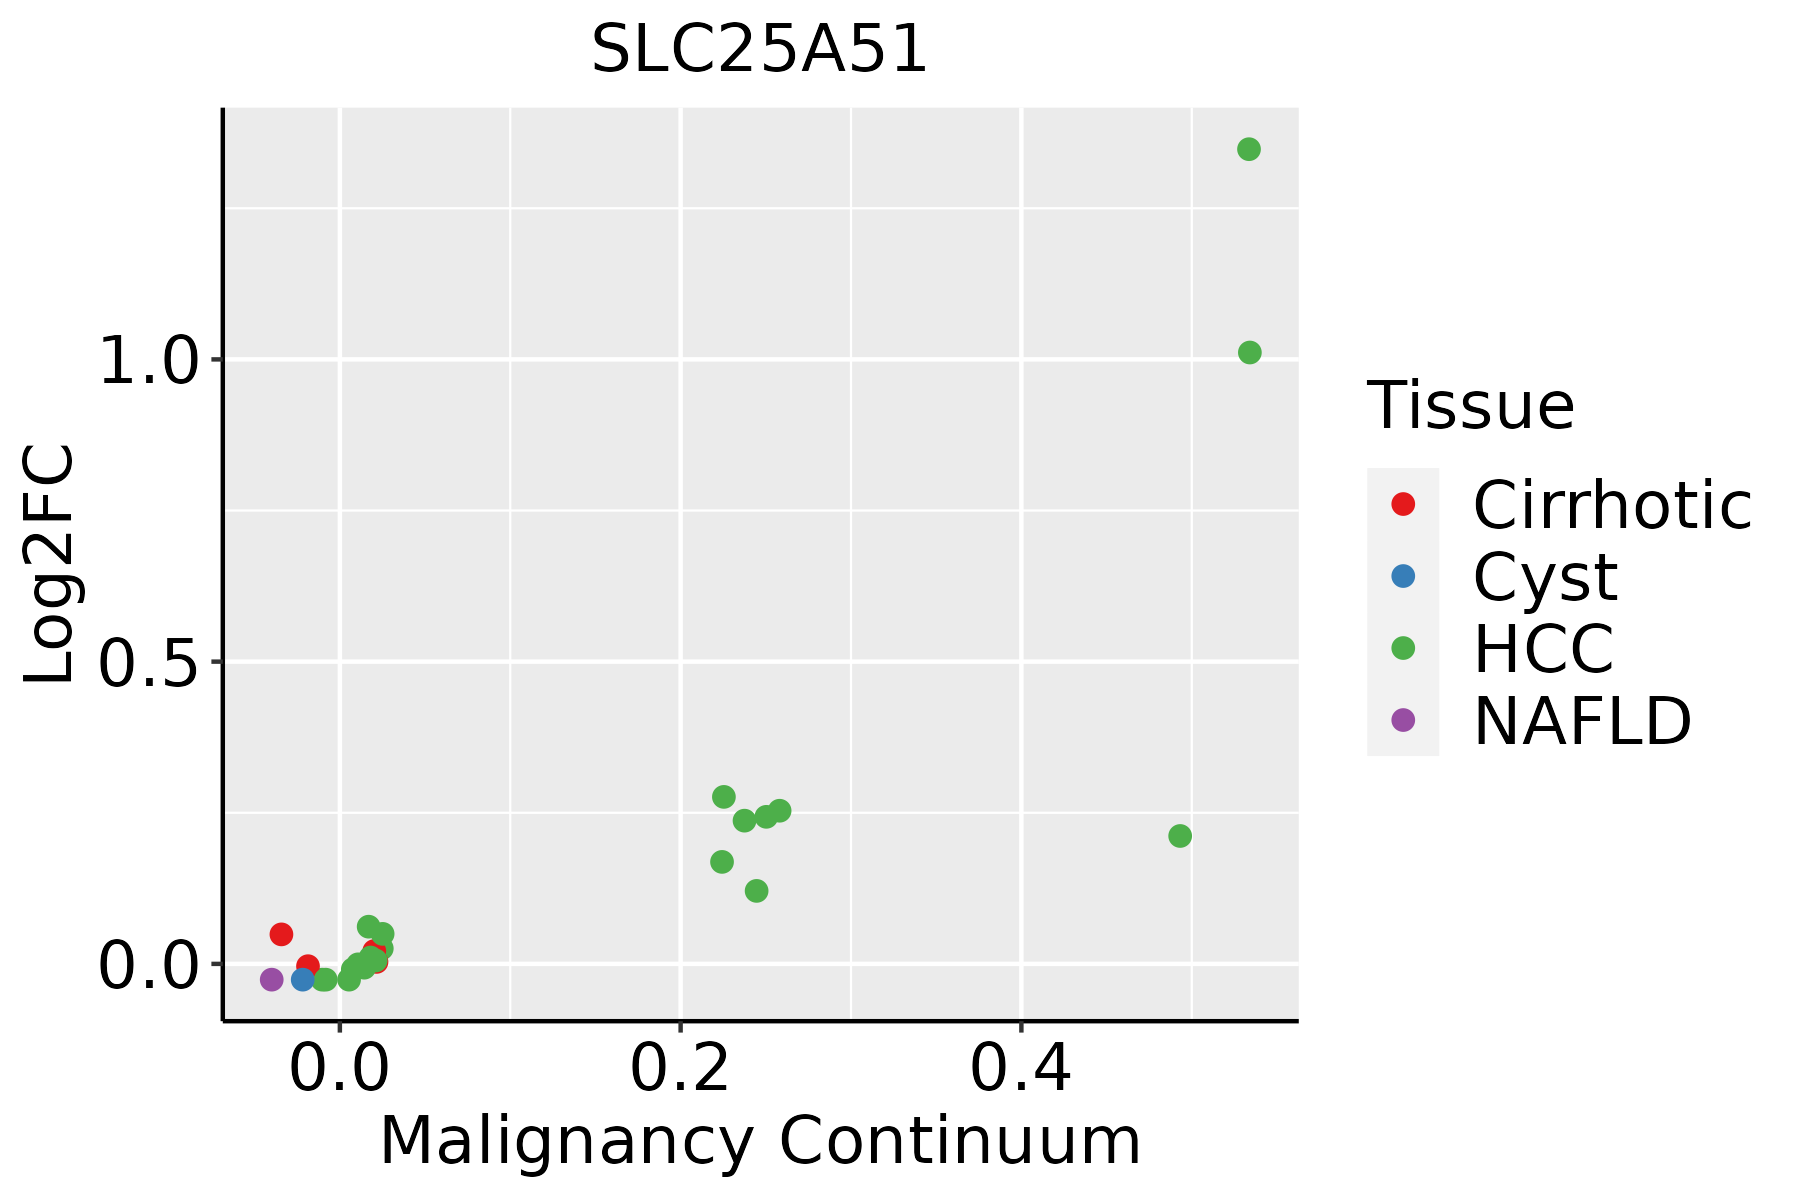 | HCC: Hepatocellular carcinoma |
| NAFLD: Non-alcoholic fatty liver disease | ||
| Oral Cavity | 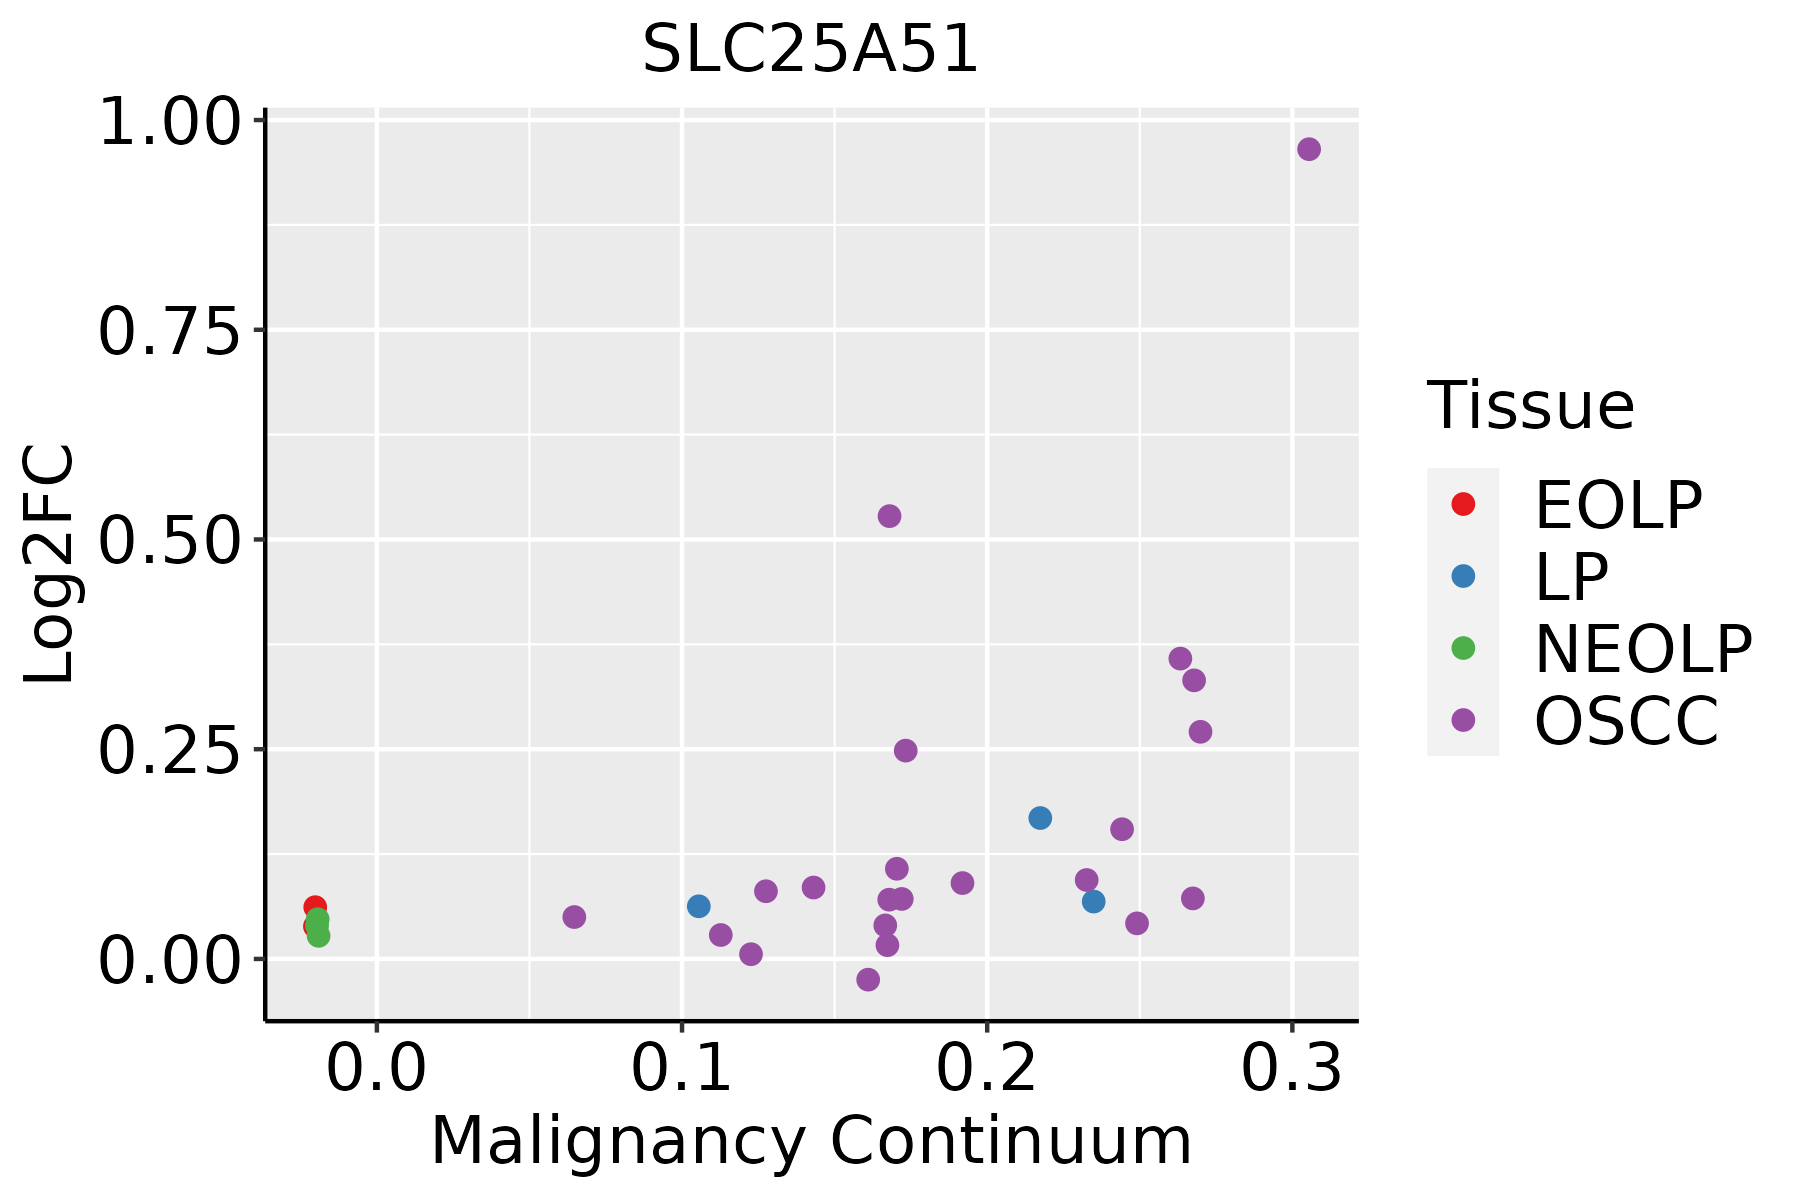 | EOLP: Erosive Oral lichen planus |
| LP: leukoplakia | ||
| NEOLP: Non-erosive oral lichen planus | ||
| OSCC: Oral squamous cell carcinoma |
| ∗log2FC in expression of this searched gene in stem-like cells from each diseased tissue sample relative to stem-like cells in normal samples in each tissue plotted against the malignancy continuum. Samples are colored based on if they are from different disease stage. |
Top |
Malignant transformation related pathway analysis |
| Find out the enriched GO biological processes and KEGG pathways involved in transition from healthy to precancer to cancer |
| Tissue | Disease Stage | Enriched GO biological Processes |
| Colorectum | AD |  |
| Colorectum | SER |  |
| Colorectum | MSS |  |
| Colorectum | MSI-H |  |
| Colorectum | FAP |  |
| ∗Top 15 enriched GO BP terms are showed in the bar plot of each disease state in each tissue. Each row represents a significant GO biological process which is colored according to the -log10(p.adjust). |
| Page: 1 2 3 4 5 6 7 8 9 |
| GO ID | Tissue | Disease Stage | Description | Gene Ratio | Bg Ratio | pvalue | p.adjust | Count |
| GO:0006091110 | Esophagus | ESCC | generation of precursor metabolites and energy | 331/8552 | 490/18723 | 3.86e-23 | 8.45e-21 | 331 |
| GO:0045333110 | Esophagus | ESCC | cellular respiration | 173/8552 | 230/18723 | 4.53e-20 | 5.99e-18 | 173 |
| GO:0006839110 | Esophagus | ESCC | mitochondrial transport | 187/8552 | 254/18723 | 8.35e-20 | 9.81e-18 | 187 |
| GO:0009060110 | Esophagus | ESCC | aerobic respiration | 145/8552 | 189/18723 | 2.16e-18 | 2.21e-16 | 145 |
| GO:0015980110 | Esophagus | ESCC | energy derivation by oxidation of organic compounds | 220/8552 | 318/18723 | 1.20e-17 | 1.09e-15 | 220 |
| GO:001593117 | Esophagus | ESCC | nucleobase-containing compound transport | 162/8552 | 222/18723 | 9.87e-17 | 7.93e-15 | 162 |
| GO:0022900110 | Esophagus | ESCC | electron transport chain | 133/8552 | 175/18723 | 2.18e-16 | 1.67e-14 | 133 |
| GO:0046034111 | Esophagus | ESCC | ATP metabolic process | 189/8552 | 277/18723 | 1.99e-14 | 1.04e-12 | 189 |
| GO:0006119111 | Esophagus | ESCC | oxidative phosphorylation | 106/8552 | 141/18723 | 8.19e-13 | 3.63e-11 | 106 |
| GO:0022904110 | Esophagus | ESCC | respiratory electron transport chain | 89/8552 | 114/18723 | 1.36e-12 | 5.80e-11 | 89 |
| GO:0019646110 | Esophagus | ESCC | aerobic electron transport chain | 67/8552 | 87/18723 | 2.30e-09 | 5.14e-08 | 67 |
| GO:1990542110 | Esophagus | ESCC | mitochondrial transmembrane transport | 72/8552 | 102/18723 | 2.94e-07 | 4.23e-06 | 72 |
| GO:000609122 | Liver | HCC | generation of precursor metabolites and energy | 340/7958 | 490/18723 | 4.04e-34 | 2.85e-31 | 340 |
| GO:000906012 | Liver | HCC | aerobic respiration | 147/7958 | 189/18723 | 3.13e-23 | 6.61e-21 | 147 |
| GO:004533312 | Liver | HCC | cellular respiration | 171/7958 | 230/18723 | 6.35e-23 | 1.26e-20 | 171 |
| GO:004603422 | Liver | HCC | ATP metabolic process | 198/7958 | 277/18723 | 8.30e-23 | 1.55e-20 | 198 |
| GO:001598022 | Liver | HCC | energy derivation by oxidation of organic compounds | 221/7958 | 318/18723 | 1.02e-22 | 1.86e-20 | 221 |
| GO:000683912 | Liver | HCC | mitochondrial transport | 184/7958 | 254/18723 | 2.30e-22 | 3.83e-20 | 184 |
| GO:002290022 | Liver | HCC | electron transport chain | 134/7958 | 175/18723 | 3.32e-20 | 4.68e-18 | 134 |
| GO:000611912 | Liver | HCC | oxidative phosphorylation | 110/7958 | 141/18723 | 6.58e-18 | 7.45e-16 | 110 |
| Page: 1 2 |
| Pathway ID | Tissue | Disease Stage | Description | Gene Ratio | Bg Ratio | pvalue | p.adjust | qvalue | Count |
| Page: 1 |
Top |
Cell-cell communication analysis |
| Identification of potential cell-cell interactions between two cell types and their ligand-receptor pairs for different disease states |
| Ligand | Receptor | LRpair | Pathway | Tissue | Disease Stage |
| Page: 1 |
Top |
Single-cell gene regulatory network inference analysis |
| Find out the significant the regulons (TFs) and the target genes of each regulon across cell types for different disease states |
| TF | Cell Type | Tissue | Disease Stage | Target Gene | RSS | Regulon Activity |
| ∗The dot plots of a searched regulon are shown for all cell subpopulations in each disease state of each tissue based on the regulon specific score inferred using pySCENIC and by calculating the average expression. |
| Page: 1 |
Top |
Somatic mutation of malignant transformation related genes |
| Annotation of somatic variants for genes involved in malignant transformation |
| Hugo Symbol | Variant Class | Variant Classification | dbSNP RS | HGVSc | HGVSp | HGVSp Short | SWISSPROT | BIOTYPE | SIFT | PolyPhen | Tumor Sample Barcode | Tissue | Histology | Sex | Age | Stage | Therapy Types | Drugs | Outcome |
| SLC25A51 | SNV | Missense_Mutation | novel | c.260N>A | p.Pro87Gln | p.P87Q | Q9H1U9 | protein_coding | deleterious(0) | probably_damaging(0.98) | TCGA-A7-A0DB-01 | Breast | breast invasive carcinoma | Female | <65 | I/II | Hormone Therapy | arimidex | SD |
| SLC25A51 | SNV | Missense_Mutation | rs747952145 | c.367G>A | p.Val123Met | p.V123M | Q9H1U9 | protein_coding | tolerated(0.34) | benign(0.015) | TCGA-GM-A2DB-01 | Breast | breast invasive carcinoma | Female | <65 | I/II | Chemotherapy | taxol | CR |
| SLC25A51 | SNV | Missense_Mutation | rs370897815 | c.136N>A | p.Ala46Thr | p.A46T | Q9H1U9 | protein_coding | tolerated(0.4) | benign(0.003) | TCGA-EA-A3HU-01 | Cervix | cervical & endocervical cancer | Female | <65 | I/II | Unknown | Unknown | SD |
| SLC25A51 | SNV | Missense_Mutation | novel | c.544N>T | p.Arg182Trp | p.R182W | Q9H1U9 | protein_coding | deleterious(0) | probably_damaging(0.997) | TCGA-AA-3877-01 | Colorectum | colon adenocarcinoma | Female | >=65 | I/II | Unknown | Unknown | SD |
| SLC25A51 | SNV | Missense_Mutation | rs551338195 | c.478N>A | p.Ala160Thr | p.A160T | Q9H1U9 | protein_coding | tolerated(0.2) | benign(0.311) | TCGA-AD-A5EJ-01 | Colorectum | colon adenocarcinoma | Female | >=65 | I/II | Unknown | Unknown | SD |
| SLC25A51 | SNV | Missense_Mutation | rs371433133 | c.712N>T | p.Arg238Cys | p.R238C | Q9H1U9 | protein_coding | tolerated(0.08) | benign(0.12) | TCGA-AZ-4315-01 | Colorectum | colon adenocarcinoma | Male | <65 | I/II | Unknown | Unknown | SD |
| SLC25A51 | SNV | Missense_Mutation | novel | c.439N>T | p.Asp147Tyr | p.D147Y | Q9H1U9 | protein_coding | deleterious(0) | probably_damaging(0.961) | TCGA-F5-6814-01 | Colorectum | rectum adenocarcinoma | Male | <65 | I/II | Unknown | Unknown | SD |
| SLC25A51 | insertion | Frame_Shift_Ins | novel | c.851_852insG | p.Ile285HisfsTer7 | p.I285Hfs*7 | Q9H1U9 | protein_coding | TCGA-AA-3947-01 | Colorectum | colon adenocarcinoma | Female | <65 | I/II | Unknown | Unknown | SD | ||
| SLC25A51 | insertion | Frame_Shift_Ins | novel | c.690dupT | p.Pro231SerfsTer3 | p.P231Sfs*3 | Q9H1U9 | protein_coding | TCGA-CM-4746-01 | Colorectum | colon adenocarcinoma | Male | <65 | I/II | Unknown | Unknown | SD | ||
| SLC25A51 | SNV | Missense_Mutation | novel | c.602N>C | p.Leu201Pro | p.L201P | Q9H1U9 | protein_coding | deleterious(0) | probably_damaging(0.996) | TCGA-A5-A0G2-01 | Endometrium | uterine corpus endometrioid carcinoma | Female | <65 | III/IV | Unknown | Unknown | SD |
| Page: 1 2 3 4 |
Top |
Related drugs of malignant transformation related genes |
| Identification of chemicals and drugs interact with genes involved in malignant transfromation |
| (DGIdb 4.0) |
| Entrez ID | Symbol | Category | Interaction Types | Drug Claim Name | Drug Name | PMIDs |
| Page: 1 |

Copyright 2023-Present -The University of Texas Health Science Center at Houston |