
|
|||||
|
 | |
| |
| |
| |
| |
| |
|
Gene: SLC25A5 |
Gene summary for SLC25A5 |
| Gene information | Species | Human | Gene symbol | SLC25A5 | Gene ID | 292 |
| Gene name | solute carrier family 25 member 5 | |
| Gene Alias | 2F1 | |
| Cytomap | Xq24 | |
| Gene Type | protein-coding | GO ID | GO:0000422 | UniProtAcc | P05141 |
Top |
Malignant transformation analysis |
| Identification of the aberrant gene expression in precancerous and cancerous lesions by comparing the gene expression of stem-like cells in diseased tissues with normal stem cells |
| Entrez ID | Symbol | Replicates | Species | Organ | Tissue | Adj P-value | Log2FC | Malignancy |
| 292 | SLC25A5 | GSM4909282 | Human | Breast | IDC | 1.72e-91 | 7.74e-01 | -0.0288 |
| 292 | SLC25A5 | GSM4909285 | Human | Breast | IDC | 3.62e-33 | 5.55e-01 | 0.21 |
| 292 | SLC25A5 | GSM4909286 | Human | Breast | IDC | 1.46e-08 | -1.30e-01 | 0.1081 |
| 292 | SLC25A5 | GSM4909287 | Human | Breast | IDC | 4.02e-02 | -2.84e-01 | 0.2057 |
| 292 | SLC25A5 | GSM4909292 | Human | Breast | IDC | 5.48e-05 | -7.79e-01 | 0.1236 |
| 292 | SLC25A5 | GSM4909293 | Human | Breast | IDC | 2.49e-12 | -3.55e-01 | 0.1581 |
| 292 | SLC25A5 | GSM4909294 | Human | Breast | IDC | 1.36e-10 | -2.46e-01 | 0.2022 |
| 292 | SLC25A5 | GSM4909296 | Human | Breast | IDC | 2.82e-23 | 1.29e-01 | 0.1524 |
| 292 | SLC25A5 | GSM4909297 | Human | Breast | IDC | 1.29e-29 | -3.74e-01 | 0.1517 |
| 292 | SLC25A5 | GSM4909298 | Human | Breast | IDC | 6.78e-10 | -2.90e-01 | 0.1551 |
| 292 | SLC25A5 | GSM4909301 | Human | Breast | IDC | 7.92e-15 | -4.64e-01 | 0.1577 |
| 292 | SLC25A5 | GSM4909302 | Human | Breast | IDC | 2.02e-03 | -2.79e-01 | 0.1545 |
| 292 | SLC25A5 | GSM4909306 | Human | Breast | IDC | 6.88e-04 | 2.85e-01 | 0.1564 |
| 292 | SLC25A5 | GSM4909308 | Human | Breast | IDC | 7.66e-04 | 3.00e-01 | 0.158 |
| 292 | SLC25A5 | GSM4909309 | Human | Breast | IDC | 2.93e-04 | -2.76e-01 | 0.0483 |
| 292 | SLC25A5 | GSM4909311 | Human | Breast | IDC | 5.42e-60 | -5.35e-01 | 0.1534 |
| 292 | SLC25A5 | GSM4909312 | Human | Breast | IDC | 1.79e-14 | -6.07e-04 | 0.1552 |
| 292 | SLC25A5 | GSM4909313 | Human | Breast | IDC | 1.12e-02 | -2.08e-01 | 0.0391 |
| 292 | SLC25A5 | GSM4909315 | Human | Breast | IDC | 1.57e-14 | -4.73e-01 | 0.21 |
| 292 | SLC25A5 | GSM4909316 | Human | Breast | IDC | 7.80e-05 | -4.13e-01 | 0.21 |
| Page: 1 2 3 4 5 6 7 8 9 10 11 12 13 14 15 16 17 |
| Tissue | Expression Dynamics | Abbreviation |
| Breast | 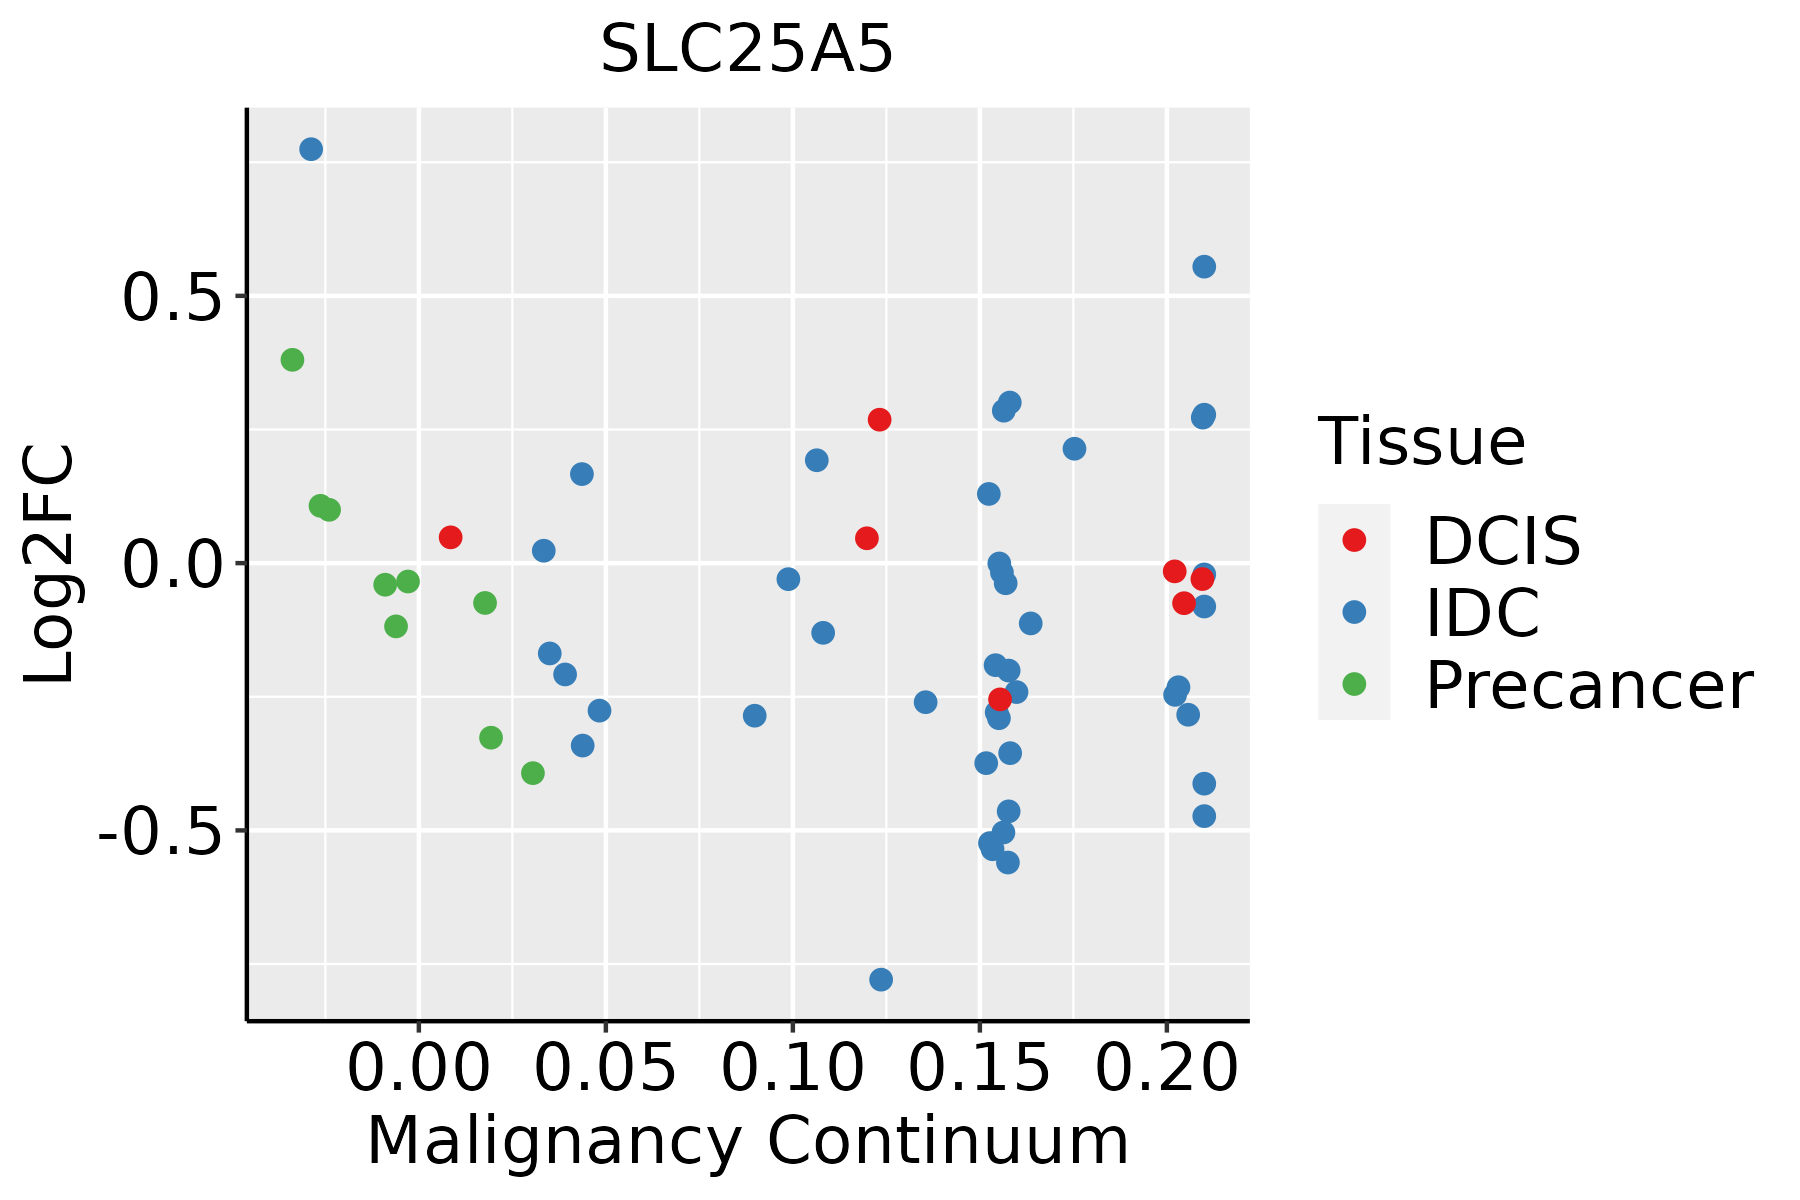 | IDC: Invasive ductal carcinoma |
| DCIS: Ductal carcinoma in situ | ||
| Precancer(BRCA1-mut): Precancerous lesion from BRCA1 mutation carriers | ||
| Cervix | 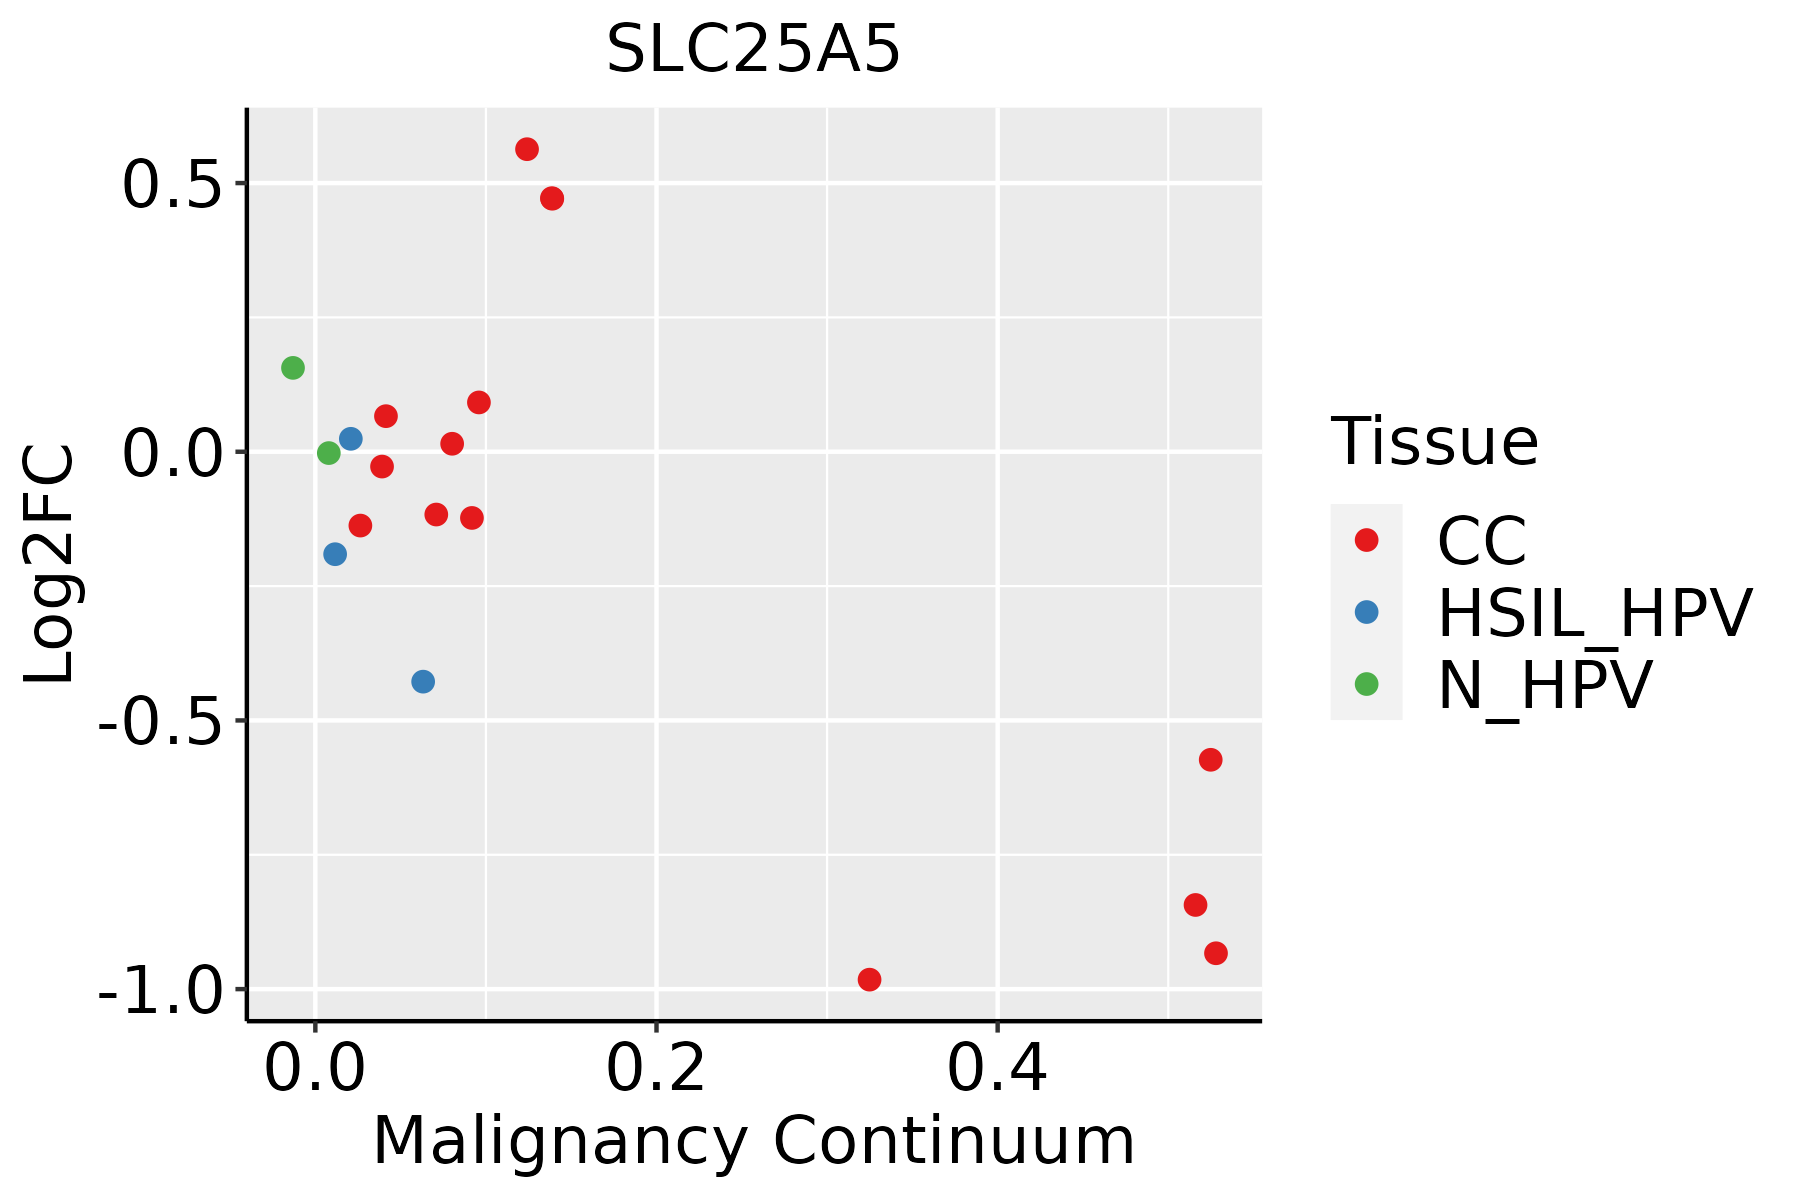 | CC: Cervix cancer |
| HSIL_HPV: HPV-infected high-grade squamous intraepithelial lesions | ||
| N_HPV: HPV-infected normal cervix | ||
| Colorectum (GSE201348) |  | FAP: Familial adenomatous polyposis |
| CRC: Colorectal cancer | ||
| Colorectum (HTA11) |  | AD: Adenomas |
| SER: Sessile serrated lesions | ||
| MSI-H: Microsatellite-high colorectal cancer | ||
| MSS: Microsatellite stable colorectal cancer | ||
| Endometrium |  | AEH: Atypical endometrial hyperplasia |
| EEC: Endometrioid Cancer | ||
| Esophagus | 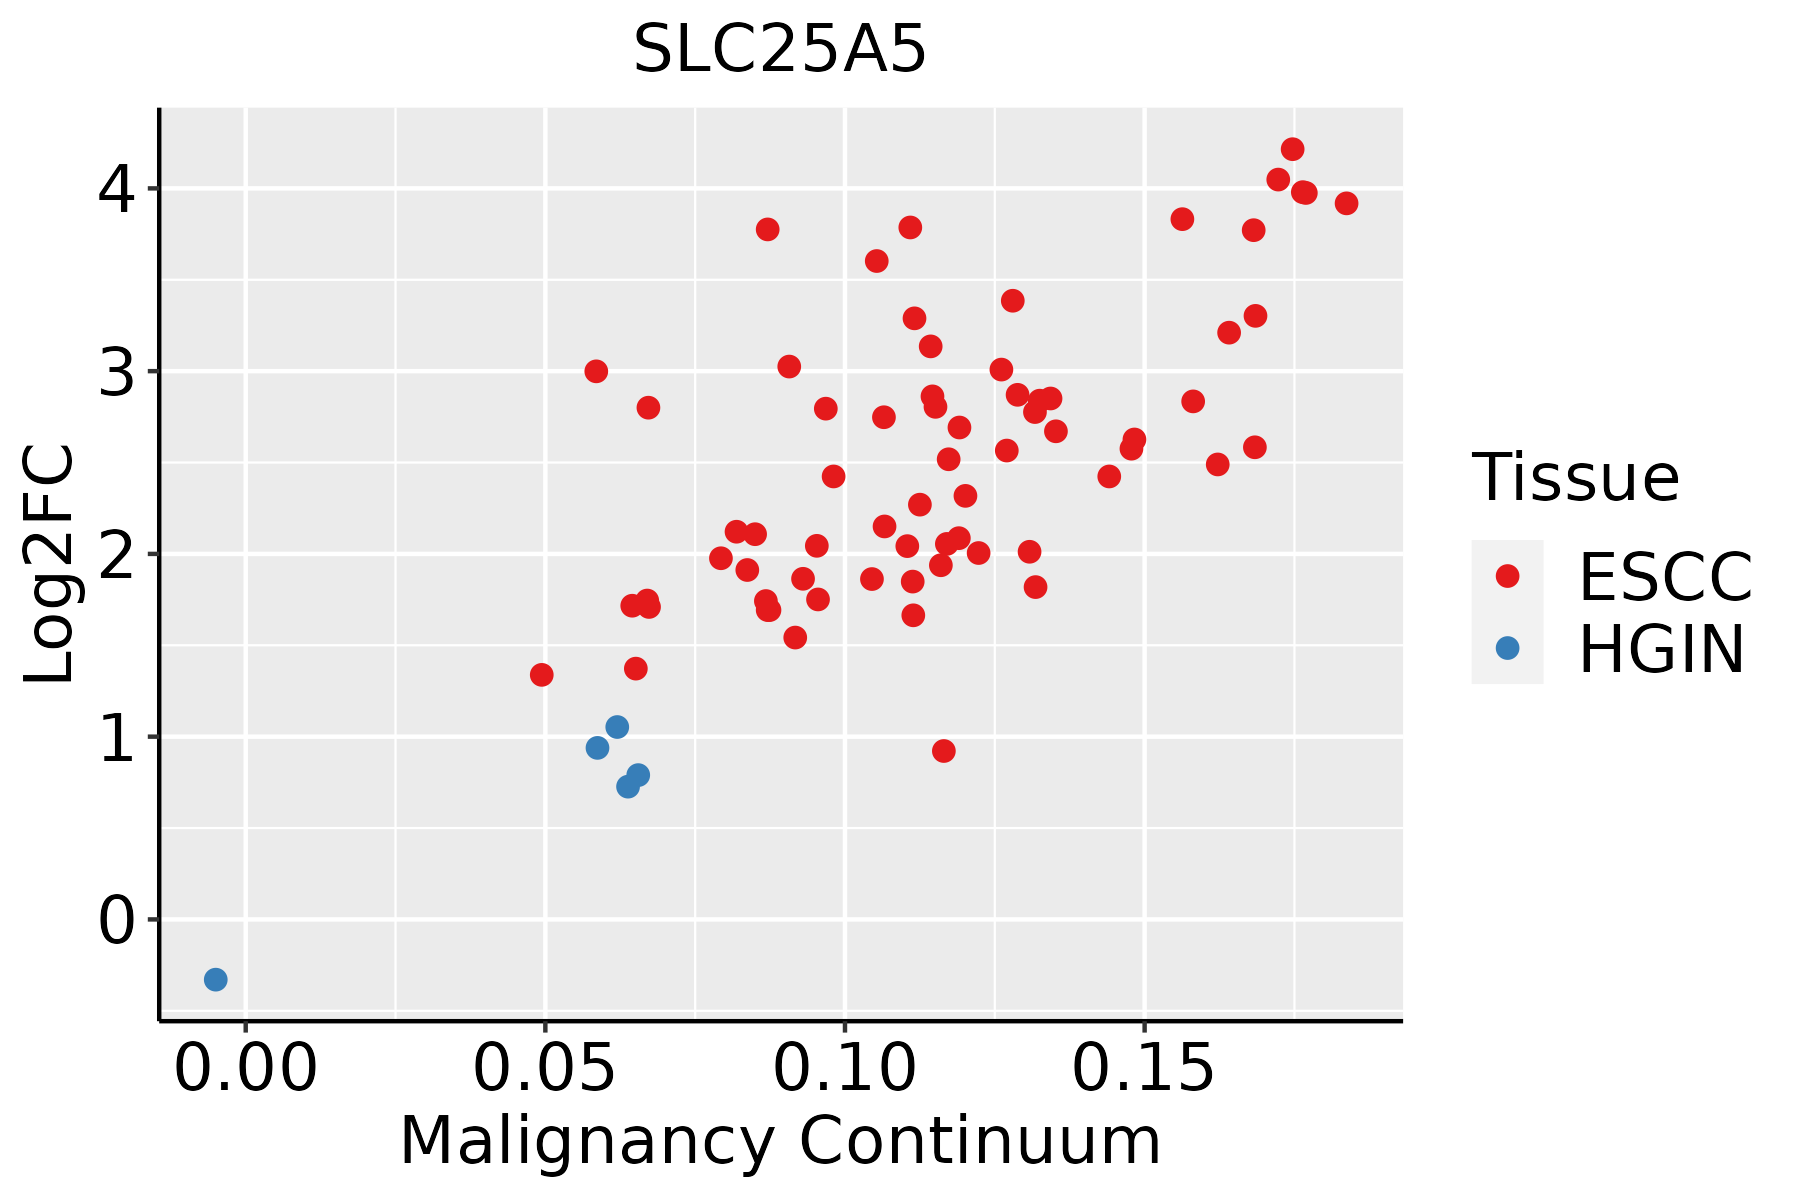 | ESCC: Esophageal squamous cell carcinoma |
| HGIN: High-grade intraepithelial neoplasias | ||
| LGIN: Low-grade intraepithelial neoplasias | ||
| GC | 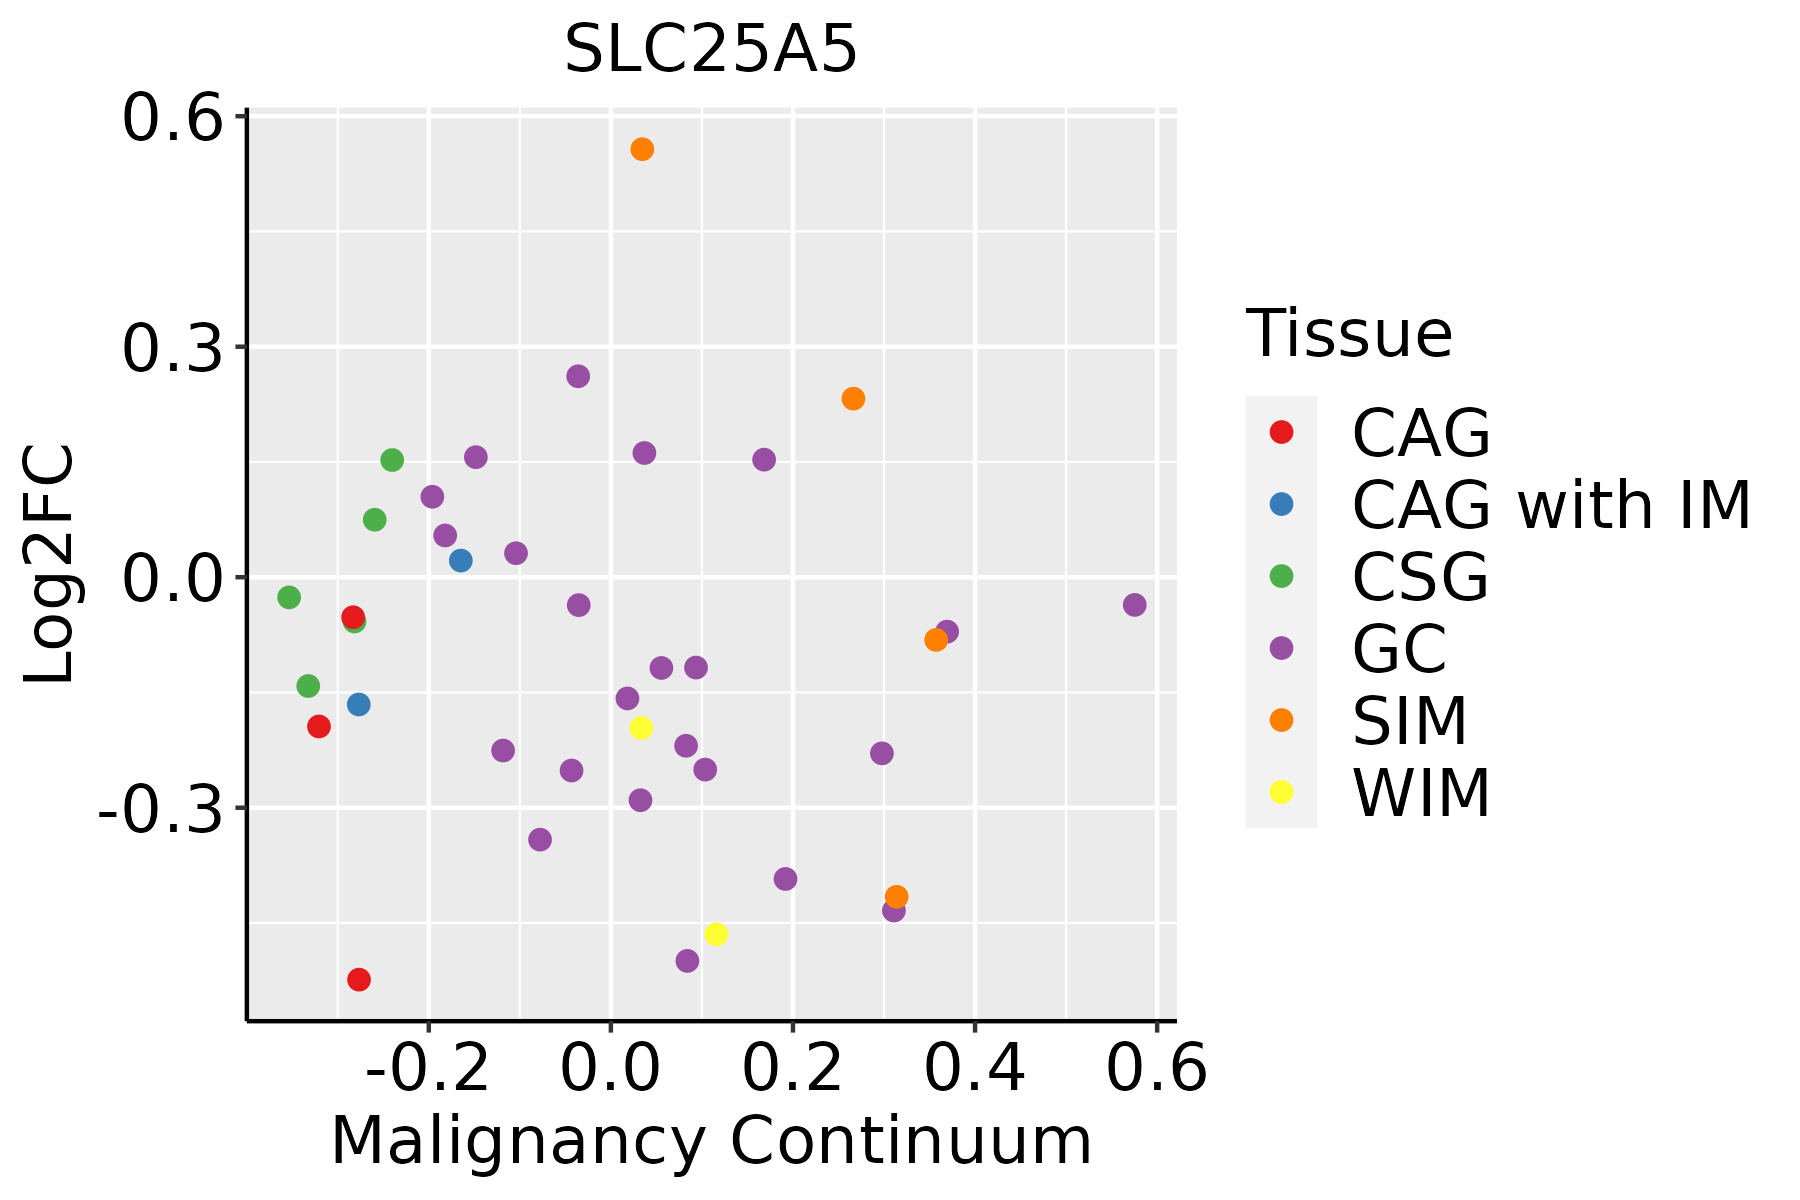 | CAG: Chronic atrophic gastritis |
| CAG with IM: Chronic atrophic gastritis with intestinal metaplasia | ||
| CSG: Chronic superficial gastritis | ||
| GC: Gastric cancer | ||
| SIM: Severe intestinal metaplasia | ||
| WIM: Wild intestinal metaplasia | ||
| Liver | 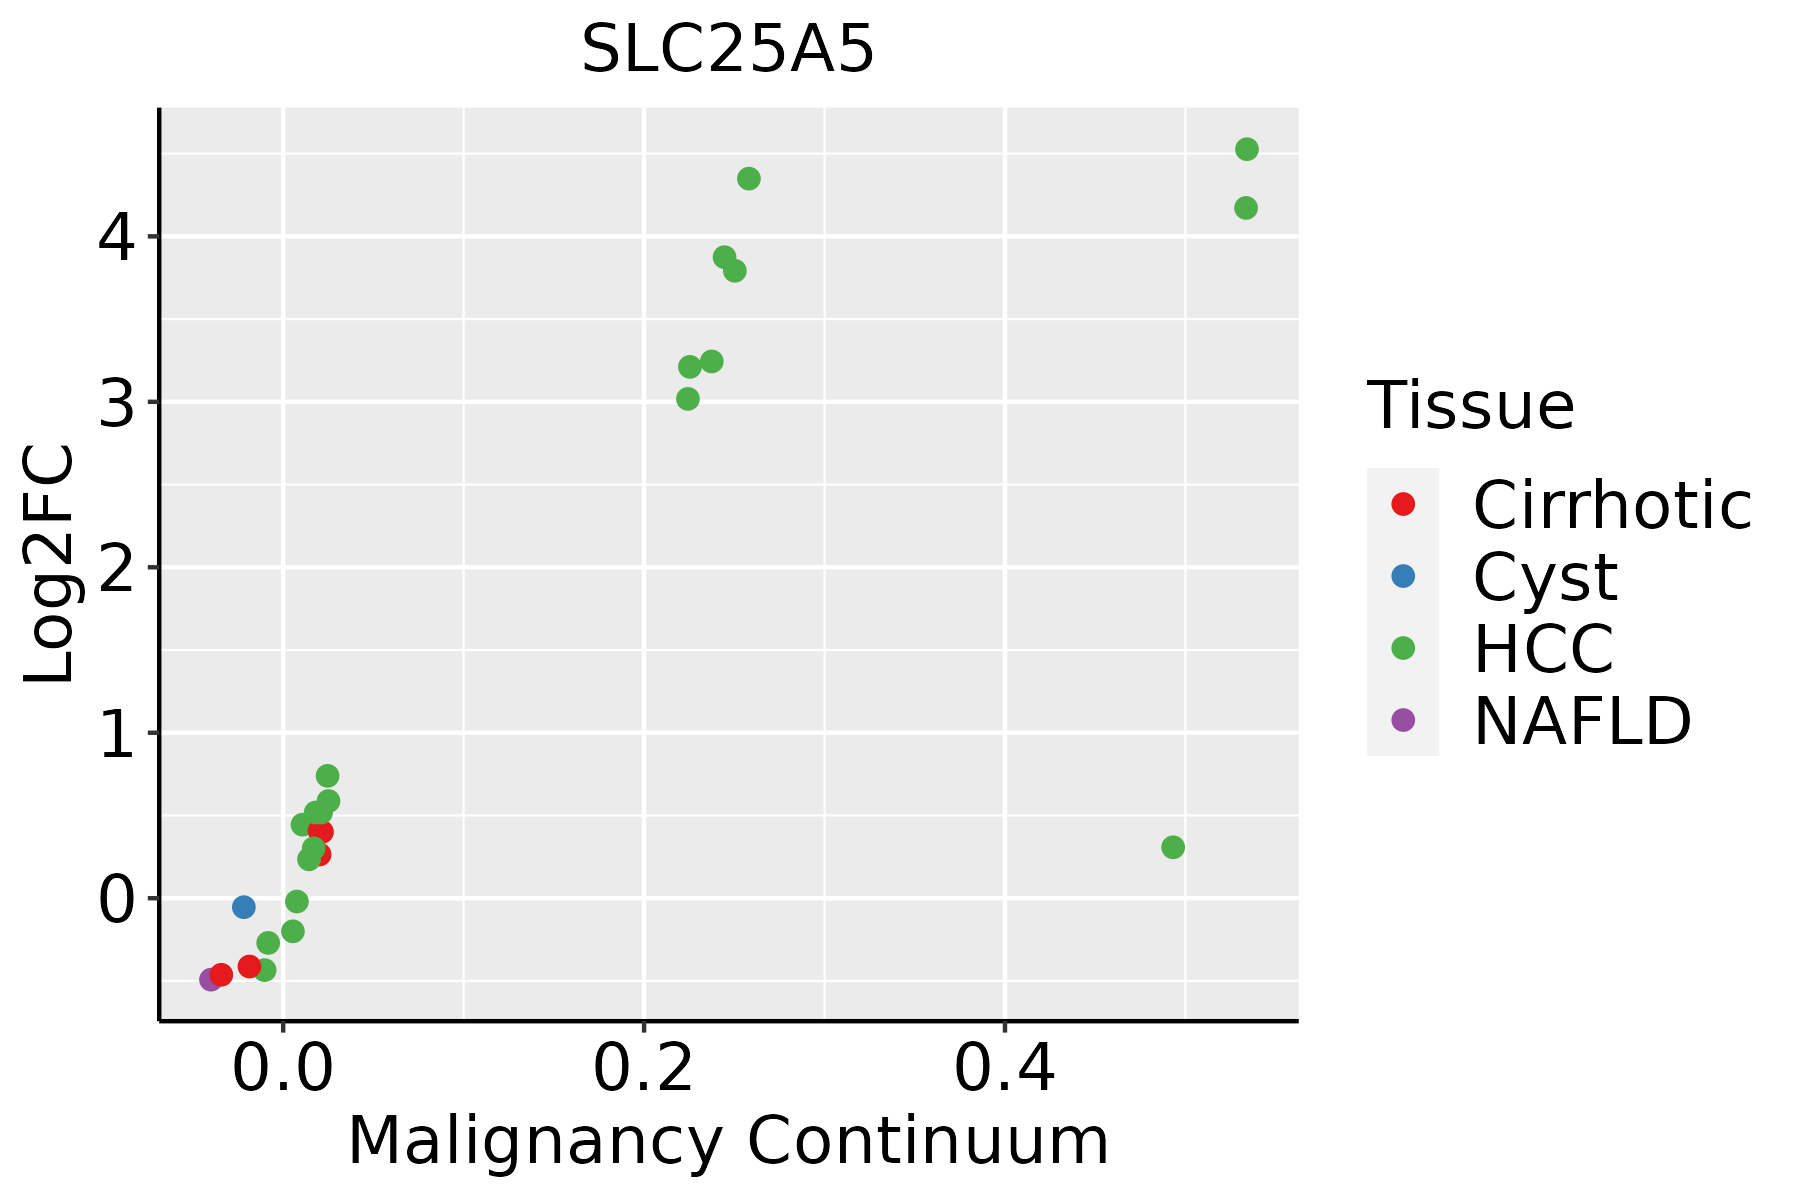 | HCC: Hepatocellular carcinoma |
| NAFLD: Non-alcoholic fatty liver disease | ||
| Lung | 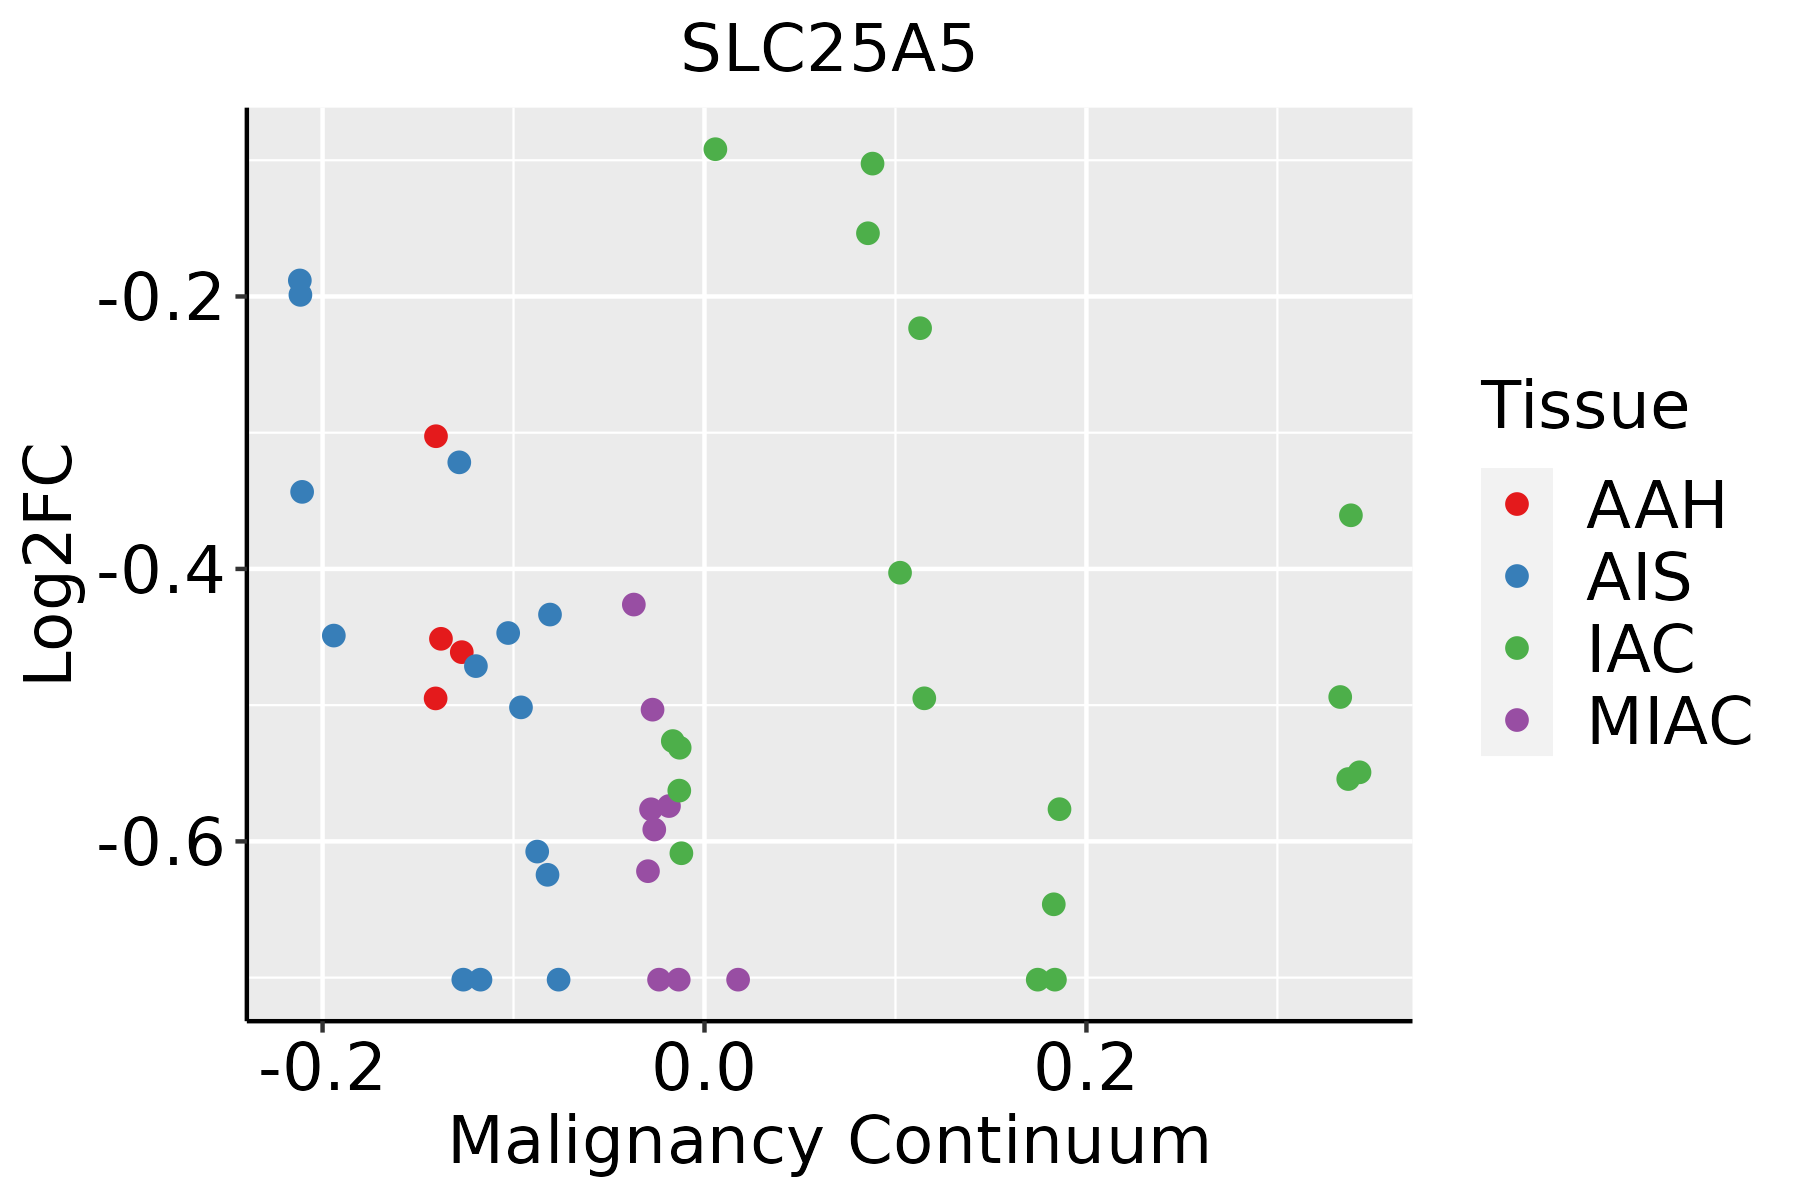 | AAH: Atypical adenomatous hyperplasia |
| AIS: Adenocarcinoma in situ | ||
| IAC: Invasive lung adenocarcinoma | ||
| MIA: Minimally invasive adenocarcinoma | ||
| Oral Cavity | 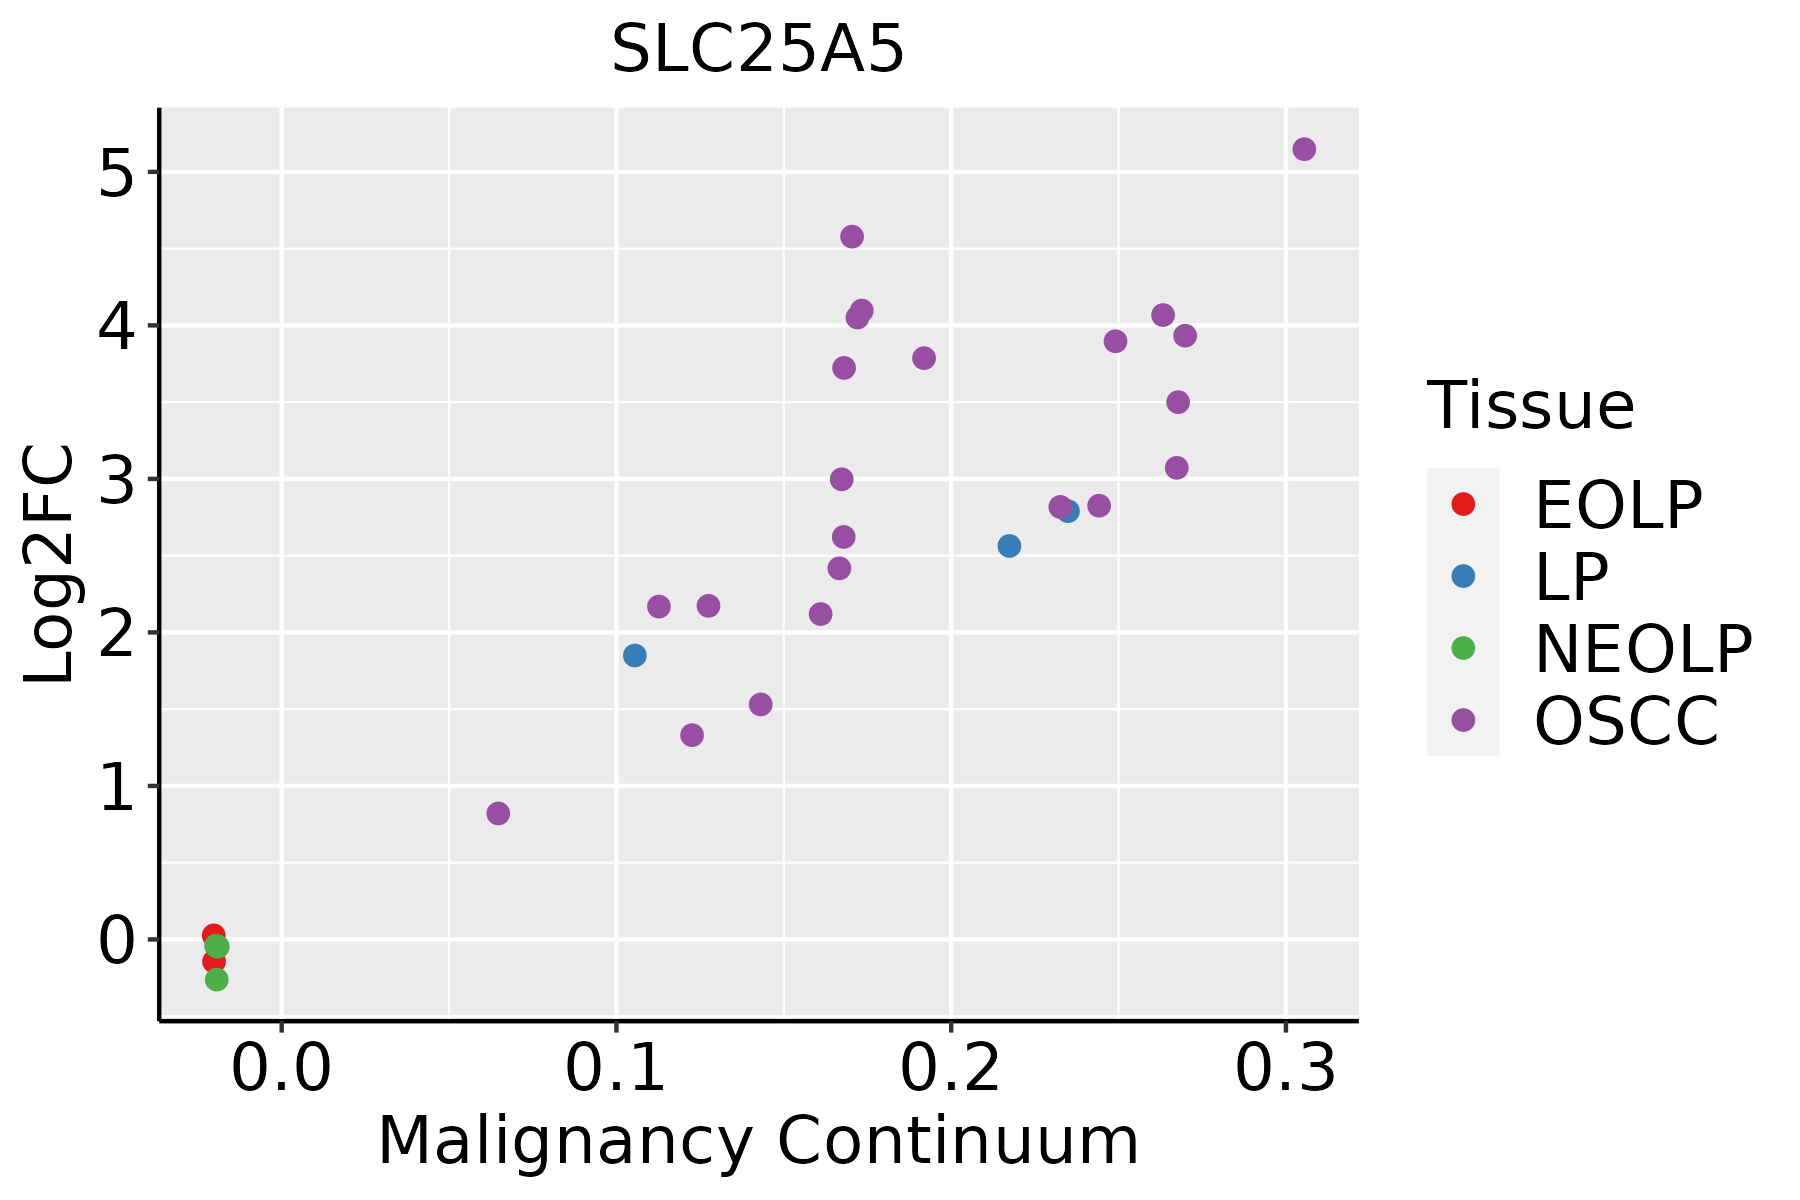 | EOLP: Erosive Oral lichen planus |
| LP: leukoplakia | ||
| NEOLP: Non-erosive oral lichen planus | ||
| OSCC: Oral squamous cell carcinoma | ||
| Prostate |  | BPH: Benign Prostatic Hyperplasia |
| Skin |  | AK: Actinic keratosis |
| cSCC: Cutaneous squamous cell carcinoma | ||
| SCCIS:squamous cell carcinoma in situ | ||
| Thyroid | 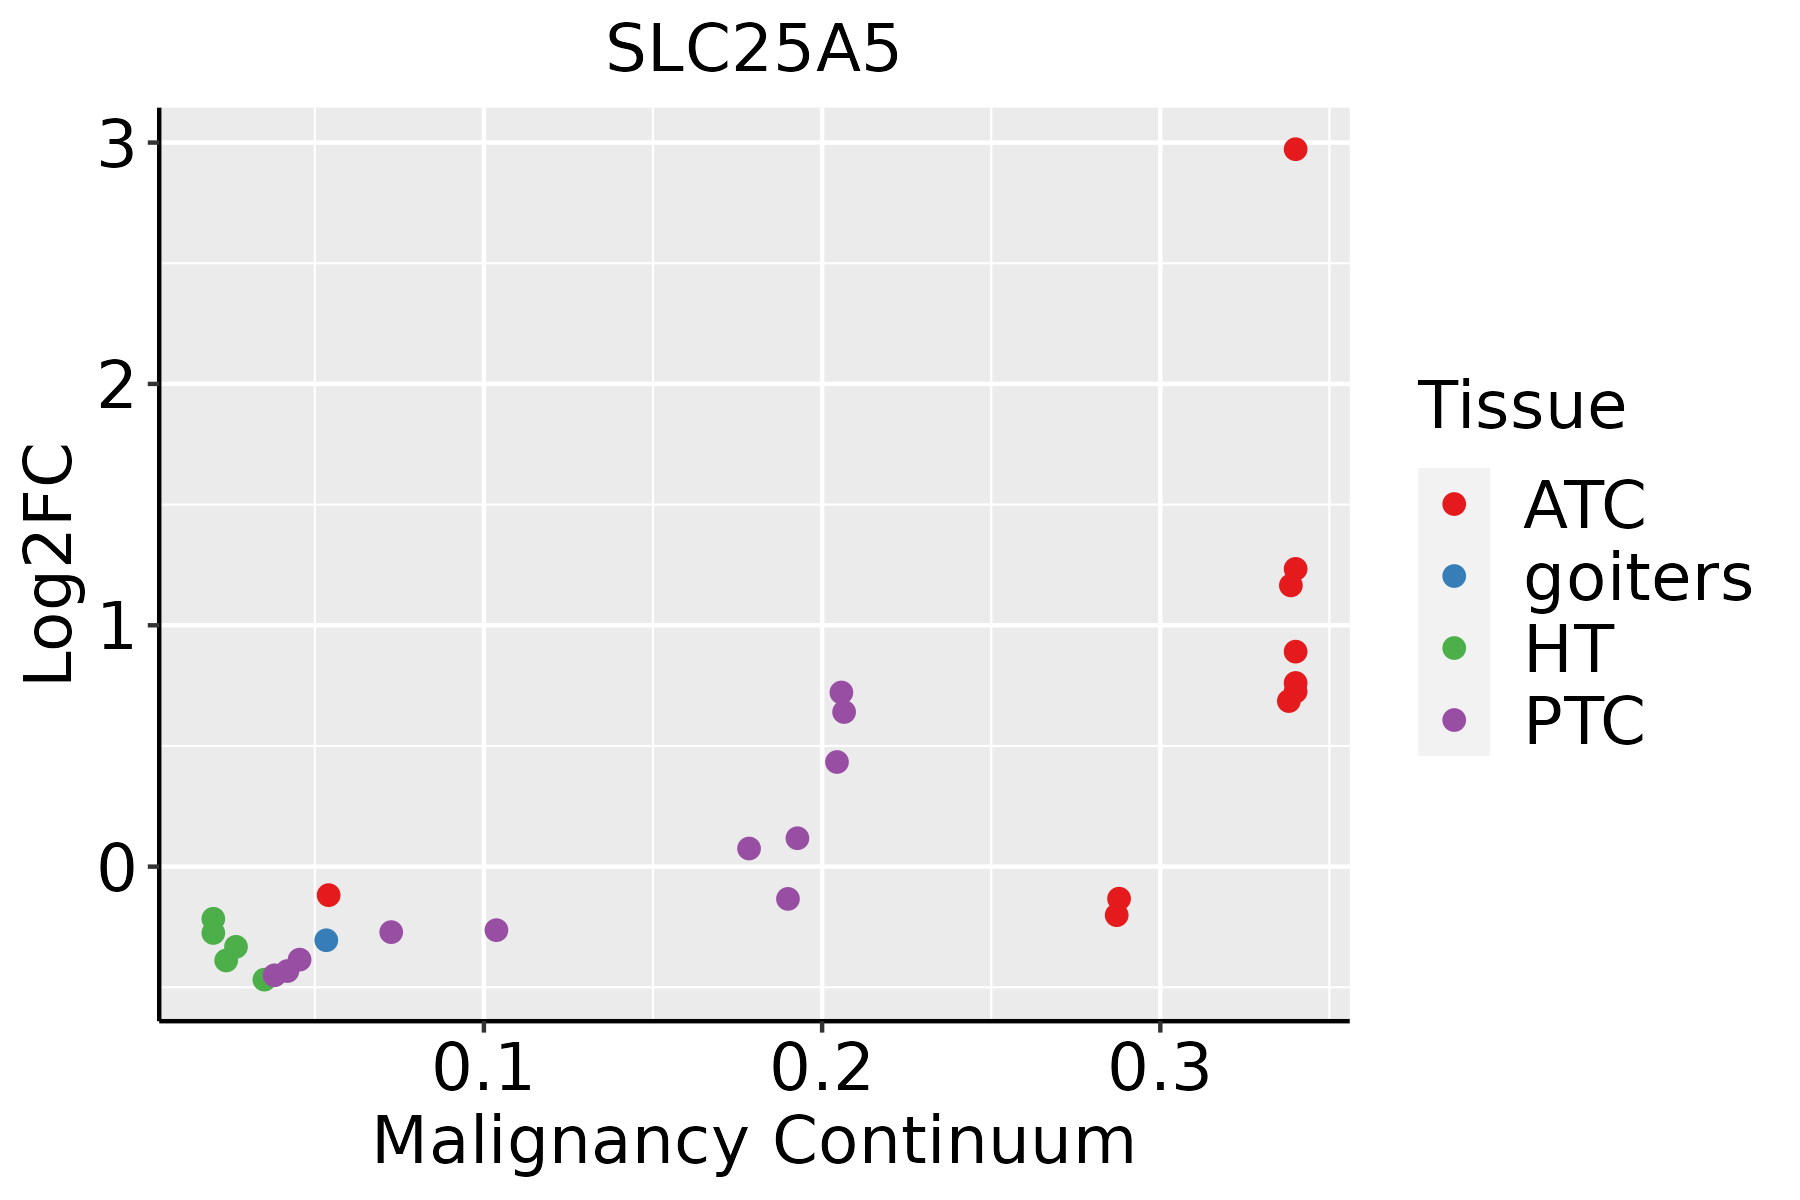 | ATC: Anaplastic thyroid cancer |
| HT: Hashimoto's thyroiditis | ||
| PTC: Papillary thyroid cancer |
| ∗log2FC in expression of this searched gene in stem-like cells from each diseased tissue sample relative to stem-like cells in normal samples in each tissue plotted against the malignancy continuum. Samples are colored based on if they are from different disease stage. |
Top |
Malignant transformation related pathway analysis |
| Find out the enriched GO biological processes and KEGG pathways involved in transition from healthy to precancer to cancer |
| Tissue | Disease Stage | Enriched GO biological Processes |
| Colorectum | AD |  |
| Colorectum | SER |  |
| Colorectum | MSS |  |
| Colorectum | MSI-H |  |
| Colorectum | FAP |  |
| ∗Top 15 enriched GO BP terms are showed in the bar plot of each disease state in each tissue. Each row represents a significant GO biological process which is colored according to the -log10(p.adjust). |
| Page: 1 2 3 4 5 6 7 8 9 |
| GO ID | Tissue | Disease Stage | Description | Gene Ratio | Bg Ratio | pvalue | p.adjust | Count |
| GO:20012339 | Breast | Precancer | regulation of apoptotic signaling pathway | 65/1080 | 356/18723 | 7.70e-17 | 3.17e-14 | 65 |
| GO:19026008 | Breast | Precancer | proton transmembrane transport | 39/1080 | 157/18723 | 4.18e-15 | 1.18e-12 | 39 |
| GO:00068398 | Breast | Precancer | mitochondrial transport | 45/1080 | 254/18723 | 1.37e-11 | 1.88e-09 | 45 |
| GO:20012349 | Breast | Precancer | negative regulation of apoptotic signaling pathway | 39/1080 | 224/18723 | 5.35e-10 | 4.77e-08 | 39 |
| GO:00086378 | Breast | Precancer | apoptotic mitochondrial changes | 23/1080 | 107/18723 | 3.44e-08 | 2.12e-06 | 23 |
| GO:19905427 | Breast | Precancer | mitochondrial transmembrane transport | 22/1080 | 102/18723 | 6.38e-08 | 3.80e-06 | 22 |
| GO:00022629 | Breast | Precancer | myeloid cell homeostasis | 27/1080 | 157/18723 | 3.10e-07 | 1.49e-05 | 27 |
| GO:00341019 | Breast | Precancer | erythrocyte homeostasis | 23/1080 | 129/18723 | 1.20e-06 | 4.60e-05 | 23 |
| GO:00300999 | Breast | Precancer | myeloid cell differentiation | 45/1080 | 381/18723 | 4.00e-06 | 1.25e-04 | 45 |
| GO:00070066 | Breast | Precancer | mitochondrial membrane organization | 20/1080 | 116/18723 | 9.88e-06 | 2.61e-04 | 20 |
| GO:00905595 | Breast | Precancer | regulation of membrane permeability | 15/1080 | 78/18723 | 3.35e-05 | 7.29e-04 | 15 |
| GO:00469025 | Breast | Precancer | regulation of mitochondrial membrane permeability | 13/1080 | 63/18723 | 5.13e-05 | 1.07e-03 | 13 |
| GO:00488729 | Breast | Precancer | homeostasis of number of cells | 32/1080 | 272/18723 | 1.03e-04 | 1.89e-03 | 32 |
| GO:00302189 | Breast | Precancer | erythrocyte differentiation | 18/1080 | 120/18723 | 1.76e-04 | 2.87e-03 | 18 |
| GO:00004226 | Breast | Precancer | autophagy of mitochondrion | 14/1080 | 81/18723 | 2.01e-04 | 3.16e-03 | 14 |
| GO:00617266 | Breast | Precancer | mitochondrion disassembly | 14/1080 | 81/18723 | 2.01e-04 | 3.16e-03 | 14 |
| GO:19031313 | Breast | Precancer | mononuclear cell differentiation | 43/1080 | 426/18723 | 2.61e-04 | 3.84e-03 | 43 |
| GO:00098969 | Breast | Precancer | positive regulation of catabolic process | 48/1080 | 492/18723 | 2.62e-04 | 3.84e-03 | 48 |
| GO:00313319 | Breast | Precancer | positive regulation of cellular catabolic process | 43/1080 | 427/18723 | 2.75e-04 | 4.00e-03 | 43 |
| GO:00224119 | Breast | Precancer | cellular component disassembly | 44/1080 | 443/18723 | 3.17e-04 | 4.51e-03 | 44 |
| Page: 1 2 3 4 5 6 7 8 9 10 11 12 13 14 15 16 17 18 19 20 21 22 23 24 25 26 27 28 29 30 31 32 33 34 35 36 37 38 39 40 41 42 43 44 45 46 47 48 49 50 51 52 53 54 55 56 |
| Pathway ID | Tissue | Disease Stage | Description | Gene Ratio | Bg Ratio | pvalue | p.adjust | qvalue | Count |
| hsa0501218 | Breast | Precancer | Parkinson disease | 99/684 | 266/8465 | 3.58e-42 | 5.65e-40 | 4.33e-40 | 99 |
| hsa0502016 | Breast | Precancer | Prion disease | 95/684 | 273/8465 | 1.39e-37 | 1.46e-35 | 1.12e-35 | 95 |
| hsa0501616 | Breast | Precancer | Huntington disease | 98/684 | 306/8465 | 2.85e-35 | 2.25e-33 | 1.72e-33 | 98 |
| hsa0501016 | Breast | Precancer | Alzheimer disease | 103/684 | 384/8465 | 1.03e-29 | 4.66e-28 | 3.57e-28 | 103 |
| hsa0502216 | Breast | Precancer | Pathways of neurodegeneration - multiple diseases | 112/684 | 476/8465 | 6.96e-27 | 2.44e-25 | 1.87e-25 | 112 |
| hsa0520818 | Breast | Precancer | Chemical carcinogenesis - reactive oxygen species | 68/684 | 223/8465 | 3.61e-23 | 1.14e-21 | 8.73e-22 | 68 |
| hsa0541518 | Breast | Precancer | Diabetic cardiomyopathy | 63/684 | 203/8465 | 5.63e-22 | 1.48e-20 | 1.14e-20 | 63 |
| hsa0501714 | Breast | Precancer | Spinocerebellar ataxia | 29/684 | 143/8465 | 2.79e-06 | 3.83e-05 | 2.94e-05 | 29 |
| hsa042189 | Breast | Precancer | Cellular senescence | 29/684 | 156/8465 | 1.66e-05 | 1.69e-04 | 1.30e-04 | 29 |
| hsa0516618 | Breast | Precancer | Human T-cell leukemia virus 1 infection | 33/684 | 222/8465 | 4.29e-04 | 3.31e-03 | 2.53e-03 | 33 |
| hsa0501219 | Breast | Precancer | Parkinson disease | 99/684 | 266/8465 | 3.58e-42 | 5.65e-40 | 4.33e-40 | 99 |
| hsa0502017 | Breast | Precancer | Prion disease | 95/684 | 273/8465 | 1.39e-37 | 1.46e-35 | 1.12e-35 | 95 |
| hsa0501617 | Breast | Precancer | Huntington disease | 98/684 | 306/8465 | 2.85e-35 | 2.25e-33 | 1.72e-33 | 98 |
| hsa0501017 | Breast | Precancer | Alzheimer disease | 103/684 | 384/8465 | 1.03e-29 | 4.66e-28 | 3.57e-28 | 103 |
| hsa0502217 | Breast | Precancer | Pathways of neurodegeneration - multiple diseases | 112/684 | 476/8465 | 6.96e-27 | 2.44e-25 | 1.87e-25 | 112 |
| hsa0520819 | Breast | Precancer | Chemical carcinogenesis - reactive oxygen species | 68/684 | 223/8465 | 3.61e-23 | 1.14e-21 | 8.73e-22 | 68 |
| hsa0541519 | Breast | Precancer | Diabetic cardiomyopathy | 63/684 | 203/8465 | 5.63e-22 | 1.48e-20 | 1.14e-20 | 63 |
| hsa0501715 | Breast | Precancer | Spinocerebellar ataxia | 29/684 | 143/8465 | 2.79e-06 | 3.83e-05 | 2.94e-05 | 29 |
| hsa0421814 | Breast | Precancer | Cellular senescence | 29/684 | 156/8465 | 1.66e-05 | 1.69e-04 | 1.30e-04 | 29 |
| hsa0516619 | Breast | Precancer | Human T-cell leukemia virus 1 infection | 33/684 | 222/8465 | 4.29e-04 | 3.31e-03 | 2.53e-03 | 33 |
| Page: 1 2 3 4 5 6 7 8 9 10 11 12 13 14 15 16 17 18 19 20 21 22 23 24 25 26 27 28 29 30 31 |
Top |
Cell-cell communication analysis |
| Identification of potential cell-cell interactions between two cell types and their ligand-receptor pairs for different disease states |
| Ligand | Receptor | LRpair | Pathway | Tissue | Disease Stage |
| Page: 1 |
Top |
Single-cell gene regulatory network inference analysis |
| Find out the significant the regulons (TFs) and the target genes of each regulon across cell types for different disease states |
| TF | Cell Type | Tissue | Disease Stage | Target Gene | RSS | Regulon Activity |
| ∗The dot plots of a searched regulon are shown for all cell subpopulations in each disease state of each tissue based on the regulon specific score inferred using pySCENIC and by calculating the average expression. |
| Page: 1 |
Top |
Somatic mutation of malignant transformation related genes |
| Annotation of somatic variants for genes involved in malignant transformation |
| Hugo Symbol | Variant Class | Variant Classification | dbSNP RS | HGVSc | HGVSp | HGVSp Short | SWISSPROT | BIOTYPE | SIFT | PolyPhen | Tumor Sample Barcode | Tissue | Histology | Sex | Age | Stage | Therapy Types | Drugs | Outcome |
| SLC25A5 | insertion | Frame_Shift_Ins | novel | c.249_250insA | p.Thr84AsnfsTer5 | p.T84Nfs*5 | P05141 | protein_coding | TCGA-AN-A0AK-01 | Breast | breast invasive carcinoma | Female | >=65 | I/II | Unknown | Unknown | SD | ||
| SLC25A5 | SNV | Missense_Mutation | novel | c.618N>T | p.Lys206Asn | p.K206N | P05141 | protein_coding | deleterious(0.05) | benign(0.033) | TCGA-2W-A8YY-01 | Cervix | cervical & endocervical cancer | Female | <65 | I/II | Chemotherapy | cisplatin | CR |
| SLC25A5 | SNV | Missense_Mutation | c.858N>G | p.Phe286Leu | p.F286L | P05141 | protein_coding | tolerated(1) | benign(0.003) | TCGA-C5-A2M2-01 | Cervix | cervical & endocervical cancer | Female | <65 | I/II | Unknown | Unknown | SD | |
| SLC25A5 | SNV | Missense_Mutation | novel | c.839N>A | p.Arg280Lys | p.R280K | P05141 | protein_coding | deleterious(0.01) | possibly_damaging(0.532) | TCGA-C5-A8XJ-01 | Cervix | cervical & endocervical cancer | Female | >=65 | I/II | Chemotherapy | cisplatin | SD |
| SLC25A5 | SNV | Missense_Mutation | c.439N>G | p.Lys147Glu | p.K147E | P05141 | protein_coding | deleterious(0) | possibly_damaging(0.488) | TCGA-AD-6964-01 | Colorectum | colon adenocarcinoma | Male | <65 | III/IV | Chemotherapy | folfox | PD | |
| SLC25A5 | SNV | Missense_Mutation | c.317G>T | p.Arg106Ile | p.R106I | P05141 | protein_coding | deleterious(0.01) | benign(0.015) | TCGA-CA-6717-01 | Colorectum | colon adenocarcinoma | Male | <65 | I/II | Chemotherapy | oxaliplatin | CR | |
| SLC25A5 | SNV | Missense_Mutation | c.91N>T | p.Arg31Trp | p.R31W | P05141 | protein_coding | tolerated(0.09) | benign(0.209) | TCGA-CM-6678-01 | Colorectum | colon adenocarcinoma | Female | <65 | I/II | Chemotherapy | fluorouracil | SD | |
| SLC25A5 | SNV | Missense_Mutation | c.703N>T | p.Arg235Cys | p.R235C | P05141 | protein_coding | deleterious(0.05) | possibly_damaging(0.835) | TCGA-D5-6541-01 | Colorectum | colon adenocarcinoma | Male | <65 | I/II | Unknown | Unknown | SD | |
| SLC25A5 | SNV | Missense_Mutation | novel | c.288N>T | p.Lys96Asn | p.K96N | P05141 | protein_coding | deleterious(0.02) | probably_damaging(0.979) | TCGA-D5-6928-01 | Colorectum | colon adenocarcinoma | Male | >=65 | I/II | Unknown | Unknown | SD |
| SLC25A5 | SNV | Missense_Mutation | c.703C>T | p.Arg235Cys | p.R235C | P05141 | protein_coding | deleterious(0.05) | possibly_damaging(0.835) | TCGA-AG-A002-01 | Colorectum | rectum adenocarcinoma | Male | <65 | I/II | Unknown | Unknown | SD |
| Page: 1 2 3 |
Top |
Related drugs of malignant transformation related genes |
| Identification of chemicals and drugs interact with genes involved in malignant transfromation |
| (DGIdb 4.0) |
| Entrez ID | Symbol | Category | Interaction Types | Drug Claim Name | Drug Name | PMIDs |
| 292 | SLC25A5 | DRUGGABLE GENOME, TRANSPORTER | CLODRONATE | CLODRONIC ACID | ||
| 292 | SLC25A5 | DRUGGABLE GENOME, TRANSPORTER | TRICHOSTATIN A | 10657244 | ||
| 292 | SLC25A5 | DRUGGABLE GENOME, TRANSPORTER | BUTYRATE | 10657244 |
| Page: 1 |

Copyright 2023-Present -The University of Texas Health Science Center at Houston |