
|
|||||
|
 | |
| |
| |
| |
| |
| |
|
Gene: SLC25A44 |
Gene summary for SLC25A44 |
| Gene information | Species | Human | Gene symbol | SLC25A44 | Gene ID | 9673 |
| Gene name | solute carrier family 25 member 44 | |
| Gene Alias | SLC25A44 | |
| Cytomap | 1q22 | |
| Gene Type | protein-coding | GO ID | GO:0001659 | UniProtAcc | E9PGQ0 |
Top |
Malignant transformation analysis |
| Identification of the aberrant gene expression in precancerous and cancerous lesions by comparing the gene expression of stem-like cells in diseased tissues with normal stem cells |
| Entrez ID | Symbol | Replicates | Species | Organ | Tissue | Adj P-value | Log2FC | Malignancy |
| 9673 | SLC25A44 | C04 | Human | Oral cavity | OSCC | 1.52e-02 | 2.24e-01 | 0.2633 |
| 9673 | SLC25A44 | C21 | Human | Oral cavity | OSCC | 9.12e-07 | 2.57e-01 | 0.2678 |
| 9673 | SLC25A44 | C30 | Human | Oral cavity | OSCC | 3.68e-06 | 4.75e-01 | 0.3055 |
| 9673 | SLC25A44 | C38 | Human | Oral cavity | OSCC | 3.45e-04 | 4.22e-01 | 0.172 |
| 9673 | SLC25A44 | C43 | Human | Oral cavity | OSCC | 4.57e-05 | 1.65e-01 | 0.1704 |
| 9673 | SLC25A44 | C06 | Human | Oral cavity | OSCC | 6.52e-06 | 6.69e-01 | 0.2699 |
| 9673 | SLC25A44 | C08 | Human | Oral cavity | OSCC | 2.45e-03 | 1.99e-01 | 0.1919 |
| 9673 | SLC25A44 | C09 | Human | Oral cavity | OSCC | 4.65e-14 | 5.57e-01 | 0.1431 |
| 9673 | SLC25A44 | LN22 | Human | Oral cavity | OSCC | 3.14e-02 | 3.27e-01 | 0.1733 |
| 9673 | SLC25A44 | LN46 | Human | Oral cavity | OSCC | 3.95e-03 | 1.67e-01 | 0.1666 |
| 9673 | SLC25A44 | LP15 | Human | Oral cavity | LP | 4.44e-03 | 8.51e-01 | 0.2174 |
| 9673 | SLC25A44 | SYSMH1 | Human | Oral cavity | OSCC | 4.24e-02 | 4.25e-02 | 0.1127 |
| 9673 | SLC25A44 | SYSMH2 | Human | Oral cavity | OSCC | 1.36e-03 | 6.41e-02 | 0.2326 |
| Page: 1 |
| Tissue | Expression Dynamics | Abbreviation |
| Oral Cavity | 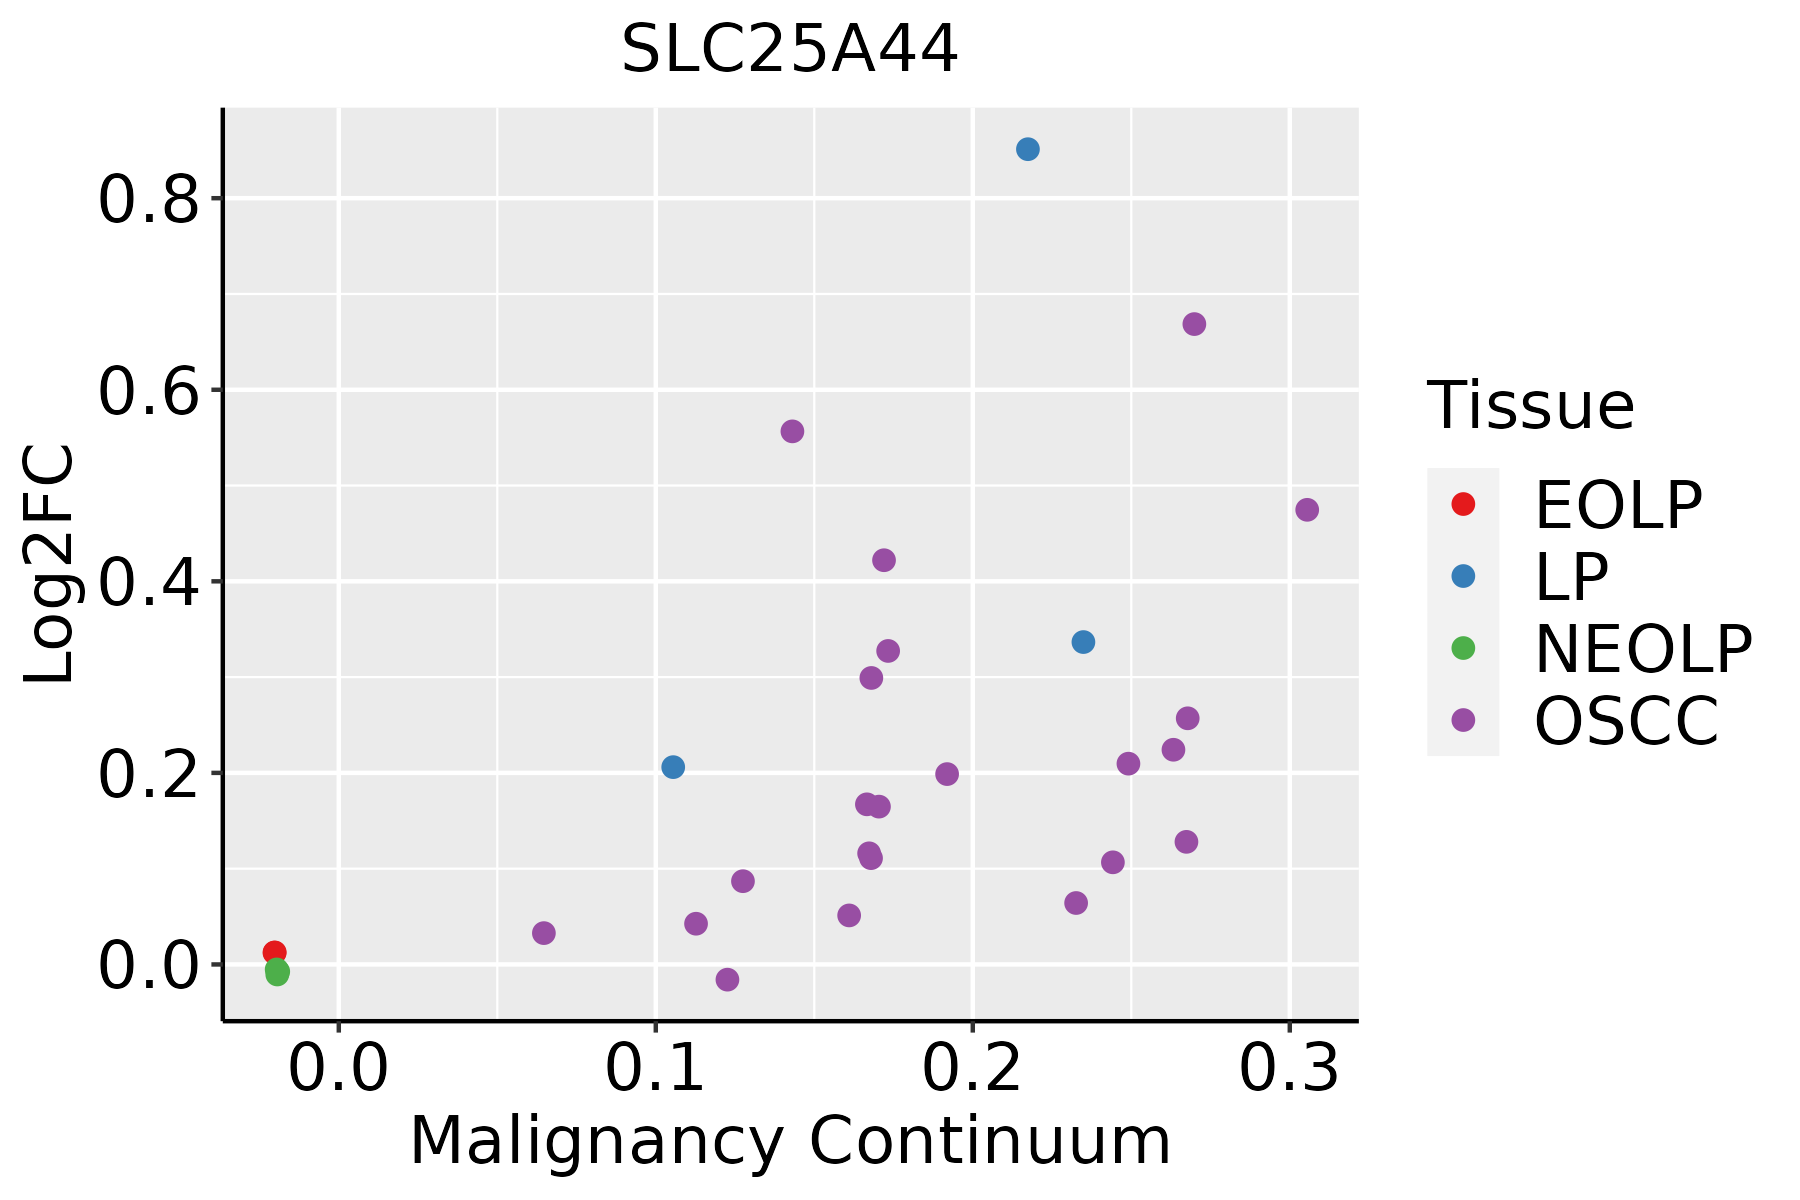 | EOLP: Erosive Oral lichen planus |
| LP: leukoplakia | ||
| NEOLP: Non-erosive oral lichen planus | ||
| OSCC: Oral squamous cell carcinoma |
| ∗log2FC in expression of this searched gene in stem-like cells from each diseased tissue sample relative to stem-like cells in normal samples in each tissue plotted against the malignancy continuum. Samples are colored based on if they are from different disease stage. |
Top |
Malignant transformation related pathway analysis |
| Find out the enriched GO biological processes and KEGG pathways involved in transition from healthy to precancer to cancer |
| Tissue | Disease Stage | Enriched GO biological Processes |
| Colorectum | AD |  |
| Colorectum | SER |  |
| Colorectum | MSS |  |
| Colorectum | MSI-H |  |
| Colorectum | FAP |  |
| ∗Top 15 enriched GO BP terms are showed in the bar plot of each disease state in each tissue. Each row represents a significant GO biological process which is colored according to the -log10(p.adjust). |
| Page: 1 2 3 4 5 6 7 8 9 |
| GO ID | Tissue | Disease Stage | Description | Gene Ratio | Bg Ratio | pvalue | p.adjust | Count |
| GO:00442826 | Oral cavity | OSCC | small molecule catabolic process | 174/7305 | 376/18723 | 2.25e-03 | 1.00e-02 | 174 |
| GO:01061065 | Oral cavity | OSCC | cold-induced thermogenesis | 71/7305 | 144/18723 | 7.51e-03 | 2.75e-02 | 71 |
| GO:01201615 | Oral cavity | OSCC | regulation of cold-induced thermogenesis | 71/7305 | 144/18723 | 7.51e-03 | 2.75e-02 | 71 |
| GO:00016594 | Oral cavity | OSCC | temperature homeostasis | 84/7305 | 174/18723 | 7.84e-03 | 2.87e-02 | 84 |
| GO:19908454 | Oral cavity | OSCC | adaptive thermogenesis | 76/7305 | 157/18723 | 1.02e-02 | 3.52e-02 | 76 |
| Page: 1 |
| Pathway ID | Tissue | Disease Stage | Description | Gene Ratio | Bg Ratio | pvalue | p.adjust | qvalue | Count |
| Page: 1 |
Top |
Cell-cell communication analysis |
| Identification of potential cell-cell interactions between two cell types and their ligand-receptor pairs for different disease states |
| Ligand | Receptor | LRpair | Pathway | Tissue | Disease Stage |
| Page: 1 |
Top |
Single-cell gene regulatory network inference analysis |
| Find out the significant the regulons (TFs) and the target genes of each regulon across cell types for different disease states |
| TF | Cell Type | Tissue | Disease Stage | Target Gene | RSS | Regulon Activity |
| ∗The dot plots of a searched regulon are shown for all cell subpopulations in each disease state of each tissue based on the regulon specific score inferred using pySCENIC and by calculating the average expression. |
| Page: 1 |
Top |
Somatic mutation of malignant transformation related genes |
| Annotation of somatic variants for genes involved in malignant transformation |
| Hugo Symbol | Variant Class | Variant Classification | dbSNP RS | HGVSc | HGVSp | HGVSp Short | SWISSPROT | BIOTYPE | SIFT | PolyPhen | Tumor Sample Barcode | Tissue | Histology | Sex | Age | Stage | Therapy Types | Drugs | Outcome |
| SLC25A44 | SNV | Missense_Mutation | c.781N>A | p.Glu261Lys | p.E261K | protein_coding | tolerated(0.07) | benign(0.047) | TCGA-BH-A0HA-01 | Breast | breast invasive carcinoma | Female | <65 | I/II | Unknown | Unknown | SD | ||
| SLC25A44 | insertion | Nonsense_Mutation | novel | c.925_926insACTGGCAGAGCTGCAGAGGGTCTTAGAGAGGATTT | p.Lys309AsnfsTer9 | p.K309Nfs*9 | protein_coding | TCGA-A8-A07J-01 | Breast | breast invasive carcinoma | Female | <65 | I/II | Chemotherapy | 5-fluorouracil | CR | |||
| SLC25A44 | insertion | In_Frame_Ins | novel | c.907_908insAAATTACCCAAGGTTATGTTGTTAGTA | p.Gly303delinsGluIleThrGlnGlyTyrValValSerSer | p.G303delinsEITQGYVVSS | protein_coding | TCGA-A8-A08Z-01 | Breast | breast invasive carcinoma | Female | >=65 | III/IV | Unknown | Unknown | SD | |||
| SLC25A44 | SNV | Missense_Mutation | rs768011448 | c.125G>A | p.Arg42His | p.R42H | protein_coding | deleterious(0.03) | benign(0.238) | TCGA-2W-A8YY-01 | Cervix | cervical & endocervical cancer | Female | <65 | I/II | Chemotherapy | cisplatin | CR | |
| SLC25A44 | SNV | Missense_Mutation | novel | c.427G>T | p.Gly143Cys | p.G143C | protein_coding | deleterious(0) | possibly_damaging(0.882) | TCGA-2W-A8YY-01 | Cervix | cervical & endocervical cancer | Female | <65 | I/II | Chemotherapy | cisplatin | CR | |
| SLC25A44 | SNV | Missense_Mutation | rs775996492 | c.707C>T | p.Ser236Leu | p.S236L | protein_coding | deleterious(0) | benign(0.43) | TCGA-FU-A3HZ-01 | Cervix | cervical & endocervical cancer | Female | <65 | I/II | Chemotherapy | cisplatin | CR | |
| SLC25A44 | SNV | Missense_Mutation | rs754955888 | c.764G>A | p.Arg255Gln | p.R255Q | protein_coding | deleterious(0) | probably_damaging(0.972) | TCGA-MU-A5YI-01 | Cervix | cervical & endocervical cancer | Female | <65 | I/II | Unknown | Unknown | PD | |
| SLC25A44 | SNV | Missense_Mutation | novel | c.250N>A | p.Leu84Ile | p.L84I | protein_coding | tolerated(1) | benign(0.044) | TCGA-5M-AAT6-01 | Colorectum | colon adenocarcinoma | Female | <65 | III/IV | Unknown | Unknown | PD | |
| SLC25A44 | SNV | Missense_Mutation | rs754955888 | c.764N>A | p.Arg255Gln | p.R255Q | protein_coding | deleterious(0) | probably_damaging(0.972) | TCGA-5M-AAT6-01 | Colorectum | colon adenocarcinoma | Female | <65 | III/IV | Unknown | Unknown | PD | |
| SLC25A44 | SNV | Missense_Mutation | c.94N>A | p.Arg32Ser | p.R32S | protein_coding | deleterious(0) | probably_damaging(0.997) | TCGA-AA-3966-01 | Colorectum | colon adenocarcinoma | Female | >=65 | I/II | Unknown | Unknown | SD |
| Page: 1 2 3 4 |
Top |
Related drugs of malignant transformation related genes |
| Identification of chemicals and drugs interact with genes involved in malignant transfromation |
| (DGIdb 4.0) |
| Entrez ID | Symbol | Category | Interaction Types | Drug Claim Name | Drug Name | PMIDs |
| Page: 1 |

Copyright 2023-Present -The University of Texas Health Science Center at Houston |