
|
|||||
|
 | |
| |
| |
| |
| |
| |
|
Gene: SLC25A43 |
Gene summary for SLC25A43 |
| Gene information | Species | Human | Gene symbol | SLC25A43 | Gene ID | 203427 |
| Gene name | solute carrier family 25 member 43 | |
| Gene Alias | SLC25A43 | |
| Cytomap | Xq24 | |
| Gene Type | protein-coding | GO ID | GO:0006810 | UniProtAcc | Q8WUT9 |
Top |
Malignant transformation analysis |
| Identification of the aberrant gene expression in precancerous and cancerous lesions by comparing the gene expression of stem-like cells in diseased tissues with normal stem cells |
| Entrez ID | Symbol | Replicates | Species | Organ | Tissue | Adj P-value | Log2FC | Malignancy |
| 203427 | SLC25A43 | CCI_2 | Human | Cervix | CC | 3.11e-09 | 9.21e-01 | 0.5249 |
| 203427 | SLC25A43 | CCI_3 | Human | Cervix | CC | 9.28e-05 | 5.84e-01 | 0.516 |
| 203427 | SLC25A43 | HTA11_347_2000001011 | Human | Colorectum | AD | 4.27e-09 | 5.37e-01 | -0.1954 |
| 203427 | SLC25A43 | A015-C-203 | Human | Colorectum | FAP | 1.42e-15 | -3.63e-01 | -0.1294 |
| 203427 | SLC25A43 | A014-C-040 | Human | Colorectum | FAP | 1.60e-03 | -4.40e-01 | -0.1184 |
| 203427 | SLC25A43 | A002-C-201 | Human | Colorectum | FAP | 6.57e-08 | -3.24e-01 | 0.0324 |
| 203427 | SLC25A43 | A001-C-119 | Human | Colorectum | FAP | 2.99e-04 | -3.85e-01 | -0.1557 |
| 203427 | SLC25A43 | A001-C-108 | Human | Colorectum | FAP | 1.41e-10 | -2.66e-01 | -0.0272 |
| 203427 | SLC25A43 | A002-C-205 | Human | Colorectum | FAP | 2.76e-09 | -3.06e-01 | -0.1236 |
| 203427 | SLC25A43 | A015-C-006 | Human | Colorectum | FAP | 1.24e-04 | -2.85e-01 | -0.0994 |
| 203427 | SLC25A43 | A015-C-106 | Human | Colorectum | FAP | 8.23e-09 | -2.82e-01 | -0.0511 |
| 203427 | SLC25A43 | A002-C-114 | Human | Colorectum | FAP | 4.25e-06 | -2.65e-01 | -0.1561 |
| 203427 | SLC25A43 | A015-C-104 | Human | Colorectum | FAP | 2.81e-15 | -2.99e-01 | -0.1899 |
| 203427 | SLC25A43 | A001-C-014 | Human | Colorectum | FAP | 2.74e-07 | -2.29e-01 | 0.0135 |
| 203427 | SLC25A43 | A002-C-016 | Human | Colorectum | FAP | 6.31e-08 | -2.72e-01 | 0.0521 |
| 203427 | SLC25A43 | A015-C-002 | Human | Colorectum | FAP | 1.52e-05 | -3.59e-01 | -0.0763 |
| 203427 | SLC25A43 | A001-C-203 | Human | Colorectum | FAP | 2.25e-05 | -1.72e-01 | -0.0481 |
| 203427 | SLC25A43 | A002-C-116 | Human | Colorectum | FAP | 9.58e-15 | -2.88e-01 | -0.0452 |
| 203427 | SLC25A43 | A014-C-008 | Human | Colorectum | FAP | 2.01e-05 | -3.29e-01 | -0.191 |
| 203427 | SLC25A43 | A018-E-020 | Human | Colorectum | FAP | 6.52e-09 | -3.30e-01 | -0.2034 |
| Page: 1 2 3 4 5 6 |
| Tissue | Expression Dynamics | Abbreviation |
| Cervix | 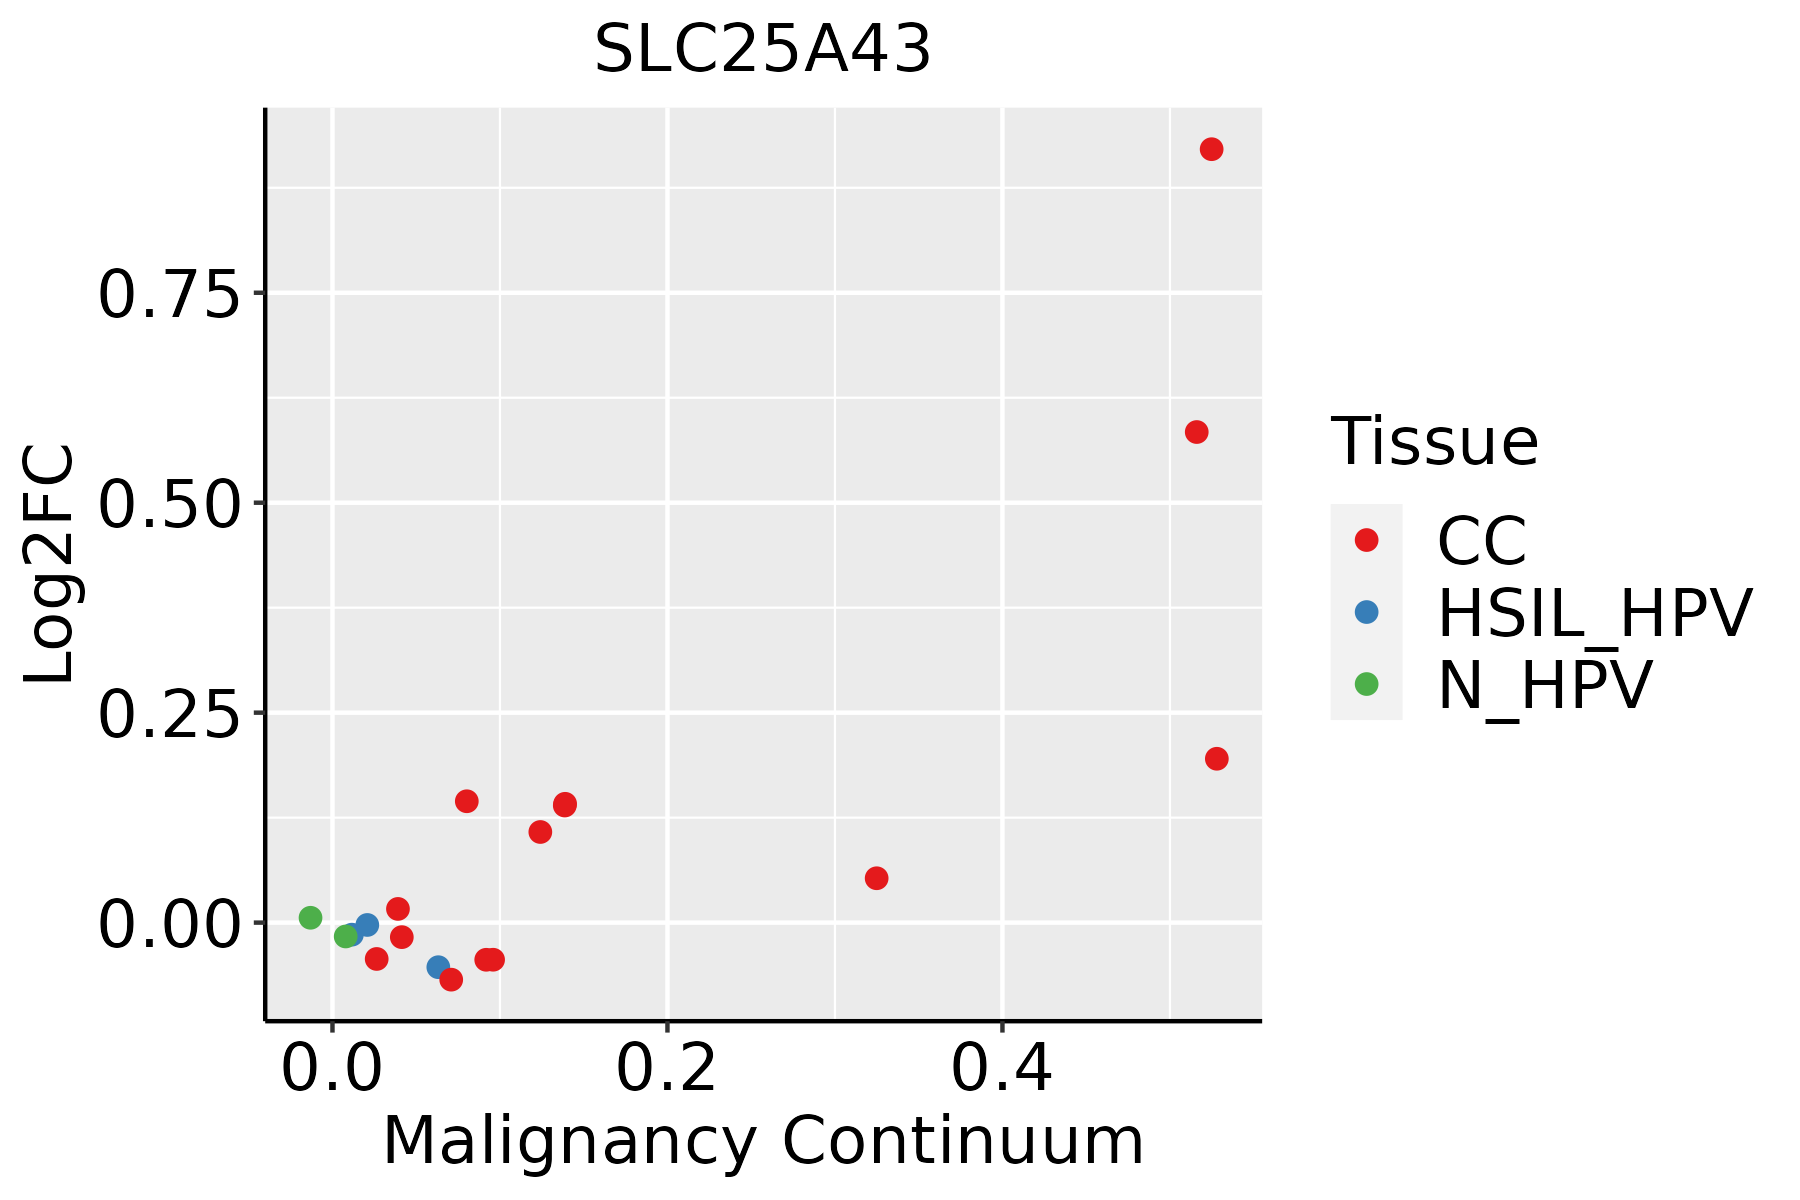 | CC: Cervix cancer |
| HSIL_HPV: HPV-infected high-grade squamous intraepithelial lesions | ||
| N_HPV: HPV-infected normal cervix | ||
| Colorectum (GSE201348) | 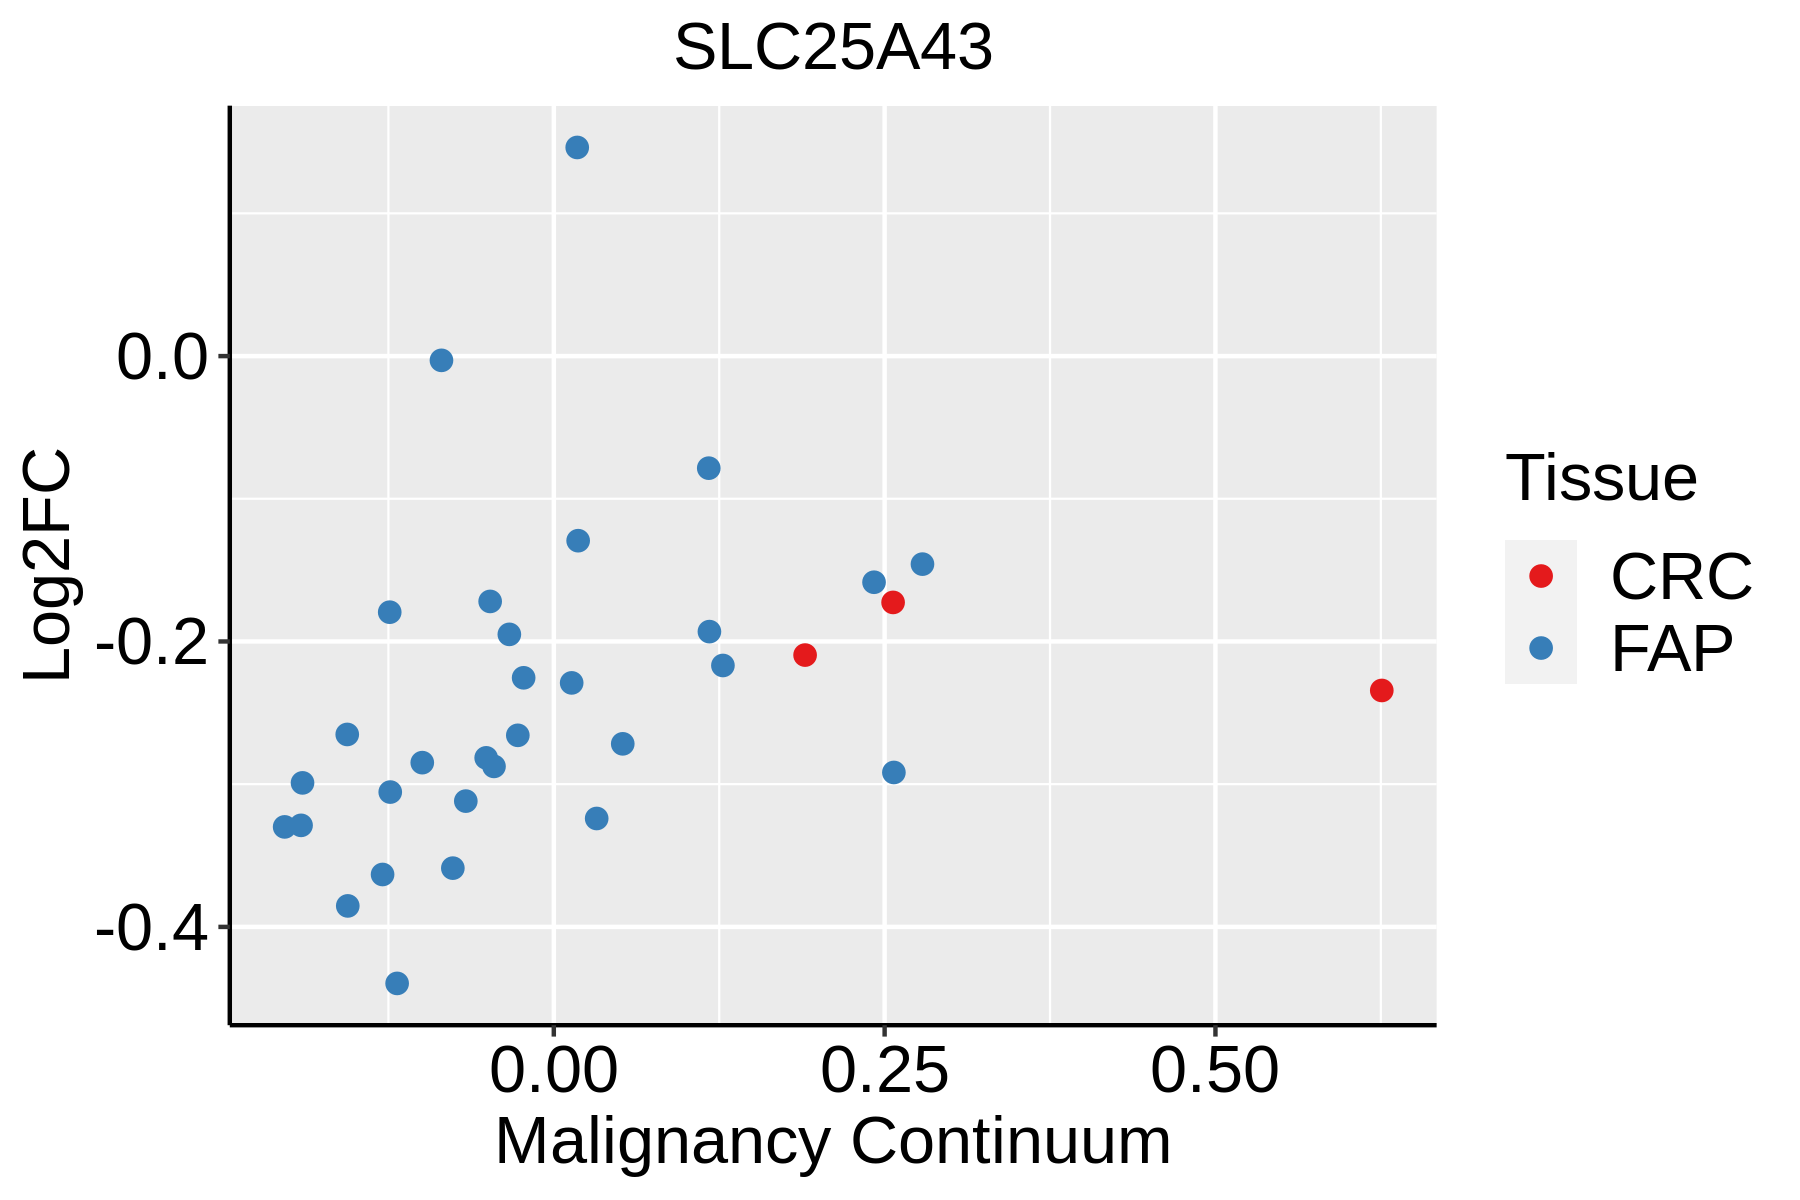 | FAP: Familial adenomatous polyposis |
| CRC: Colorectal cancer | ||
| Colorectum (HTA11) | 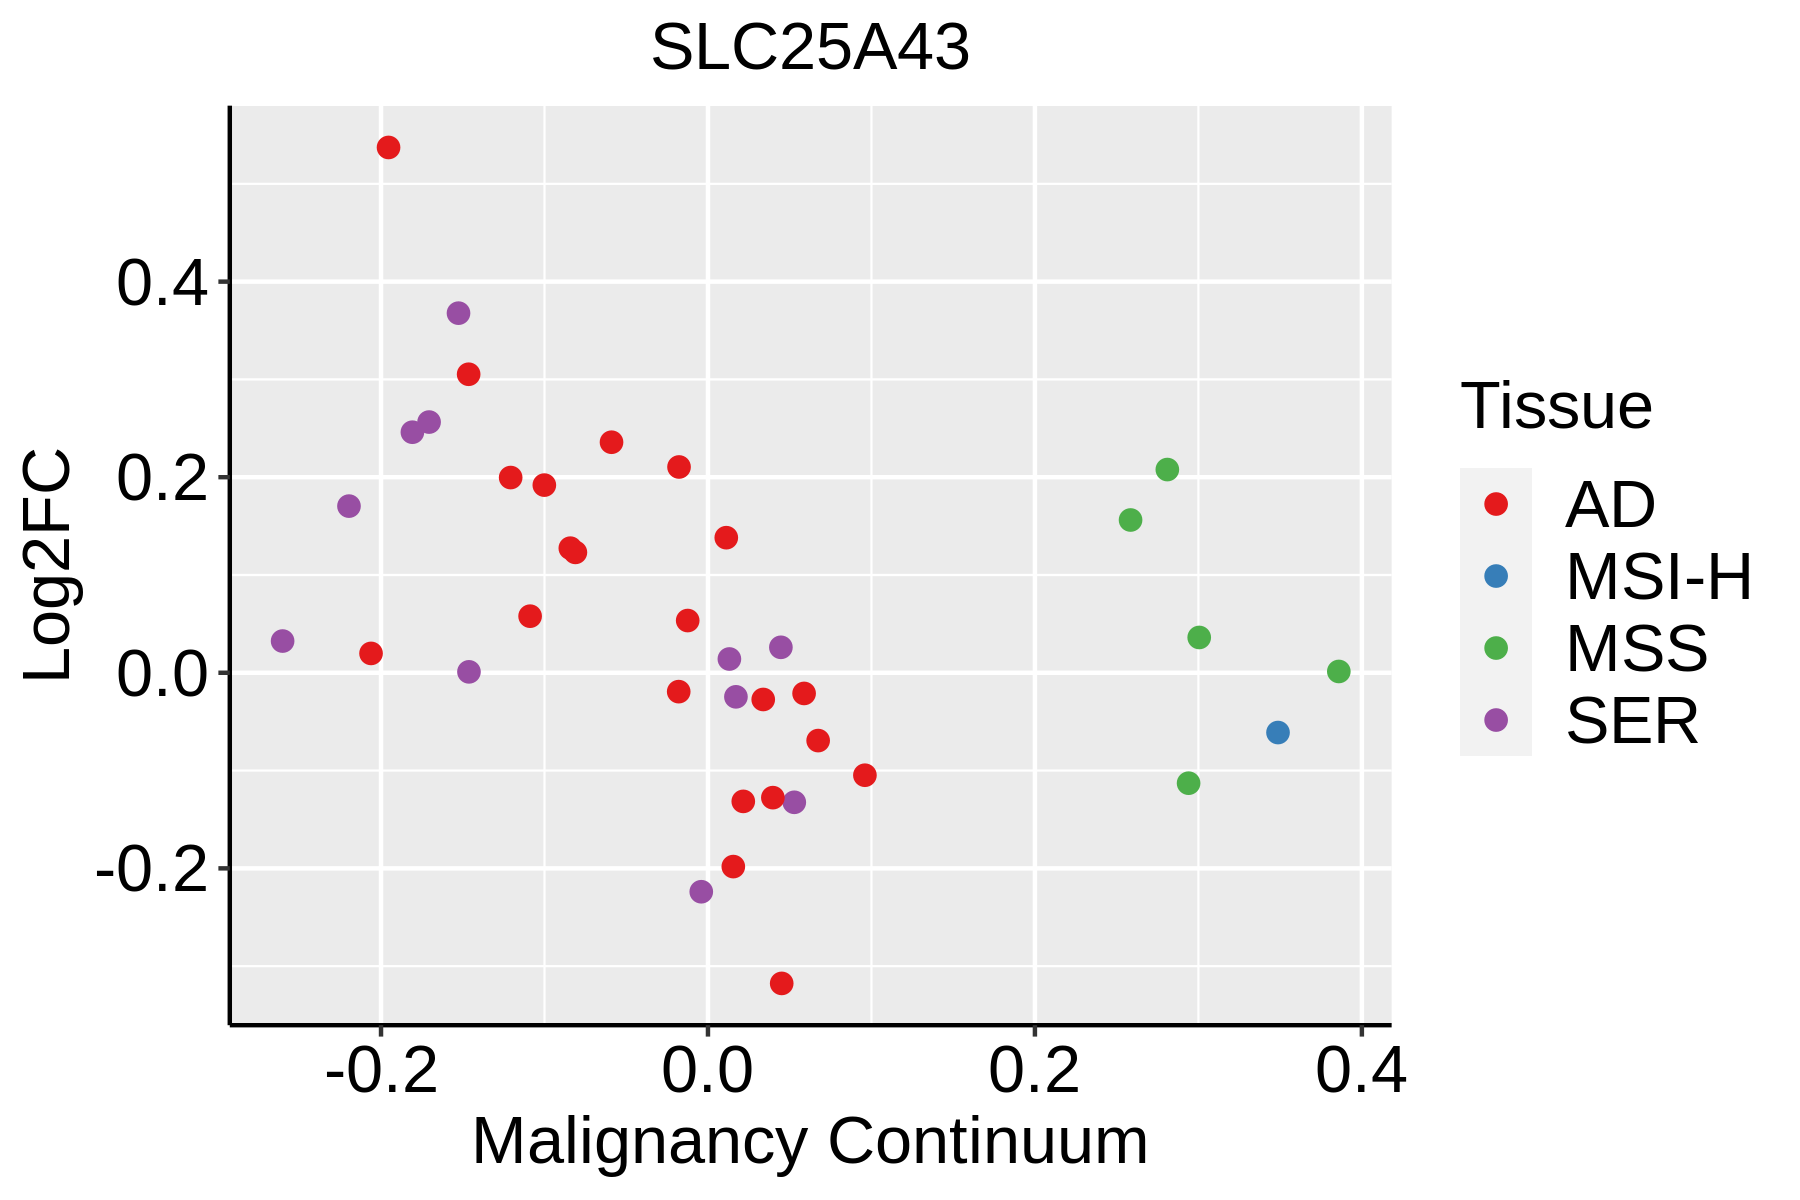 | AD: Adenomas |
| SER: Sessile serrated lesions | ||
| MSI-H: Microsatellite-high colorectal cancer | ||
| MSS: Microsatellite stable colorectal cancer | ||
| Esophagus | 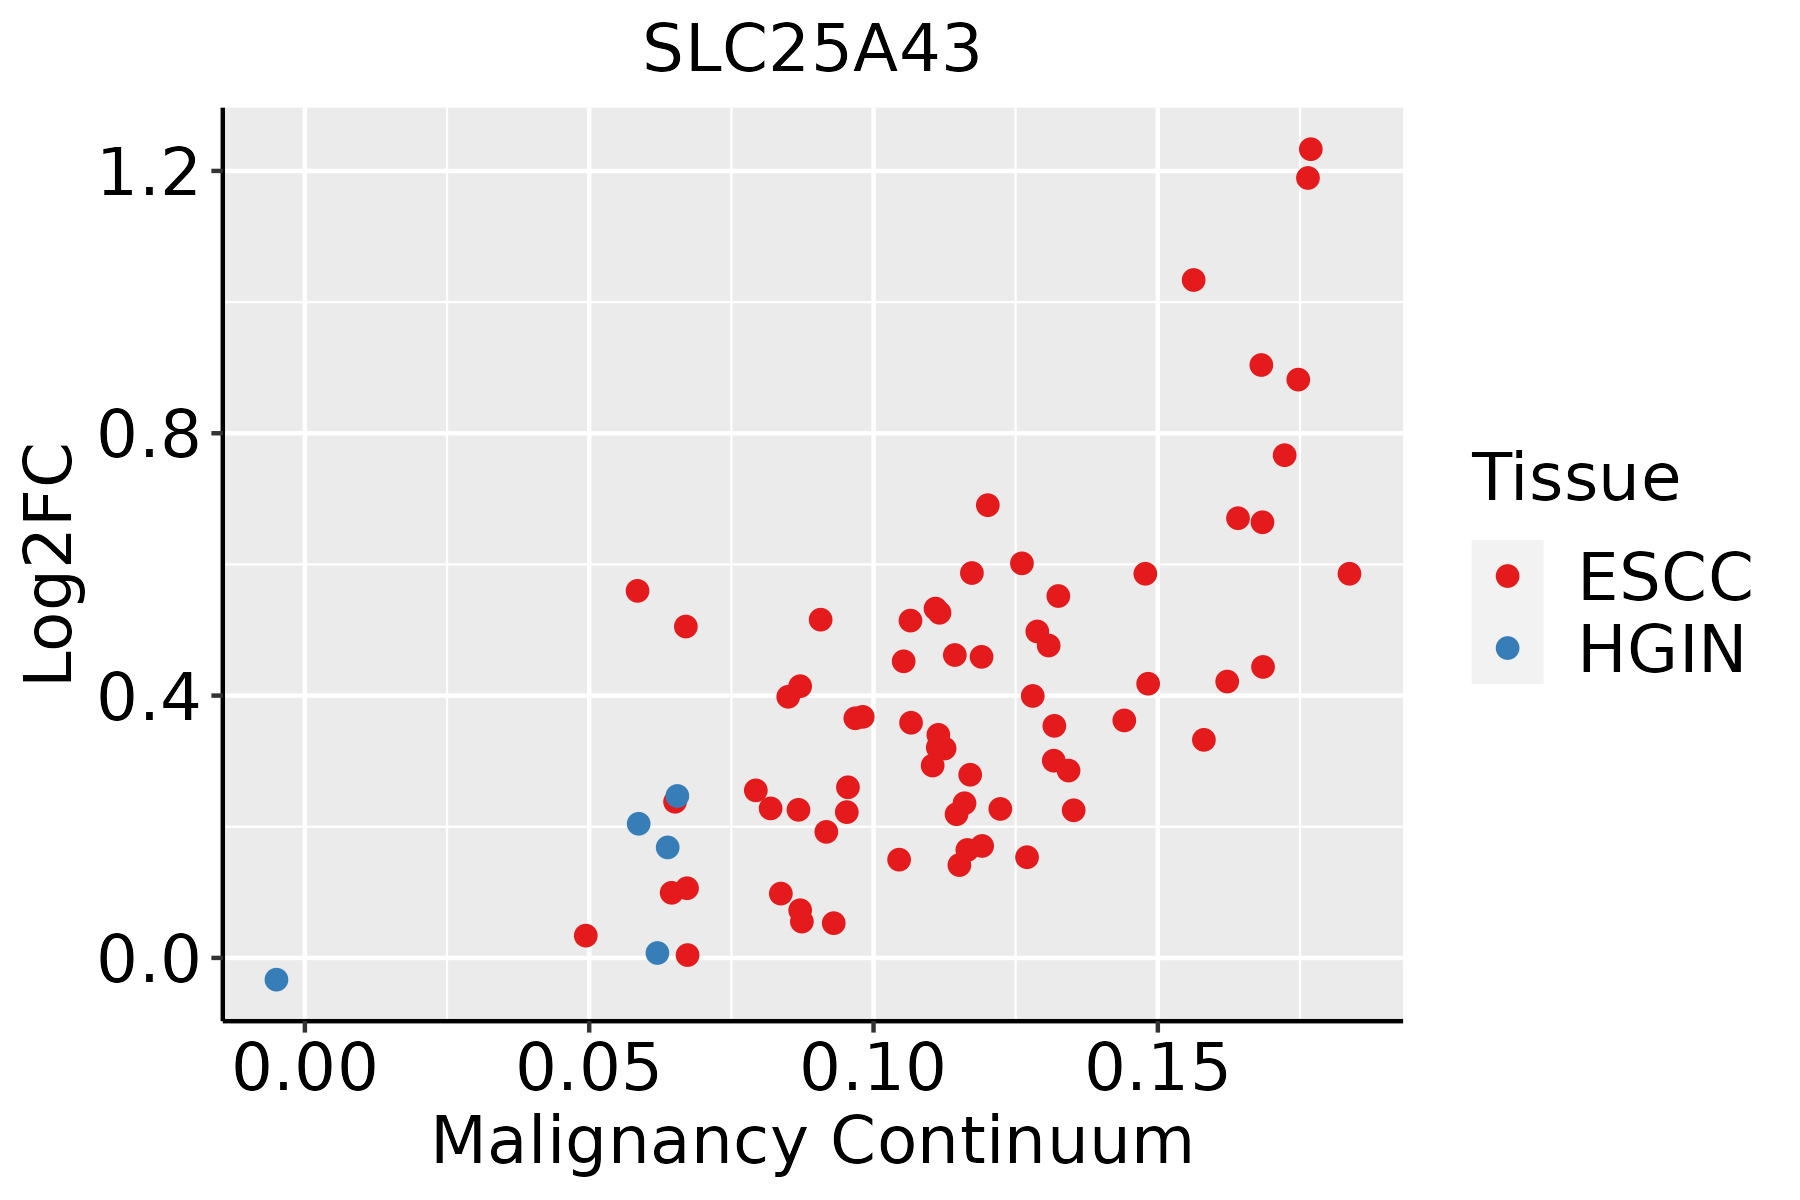 | ESCC: Esophageal squamous cell carcinoma |
| HGIN: High-grade intraepithelial neoplasias | ||
| LGIN: Low-grade intraepithelial neoplasias | ||
| Liver | 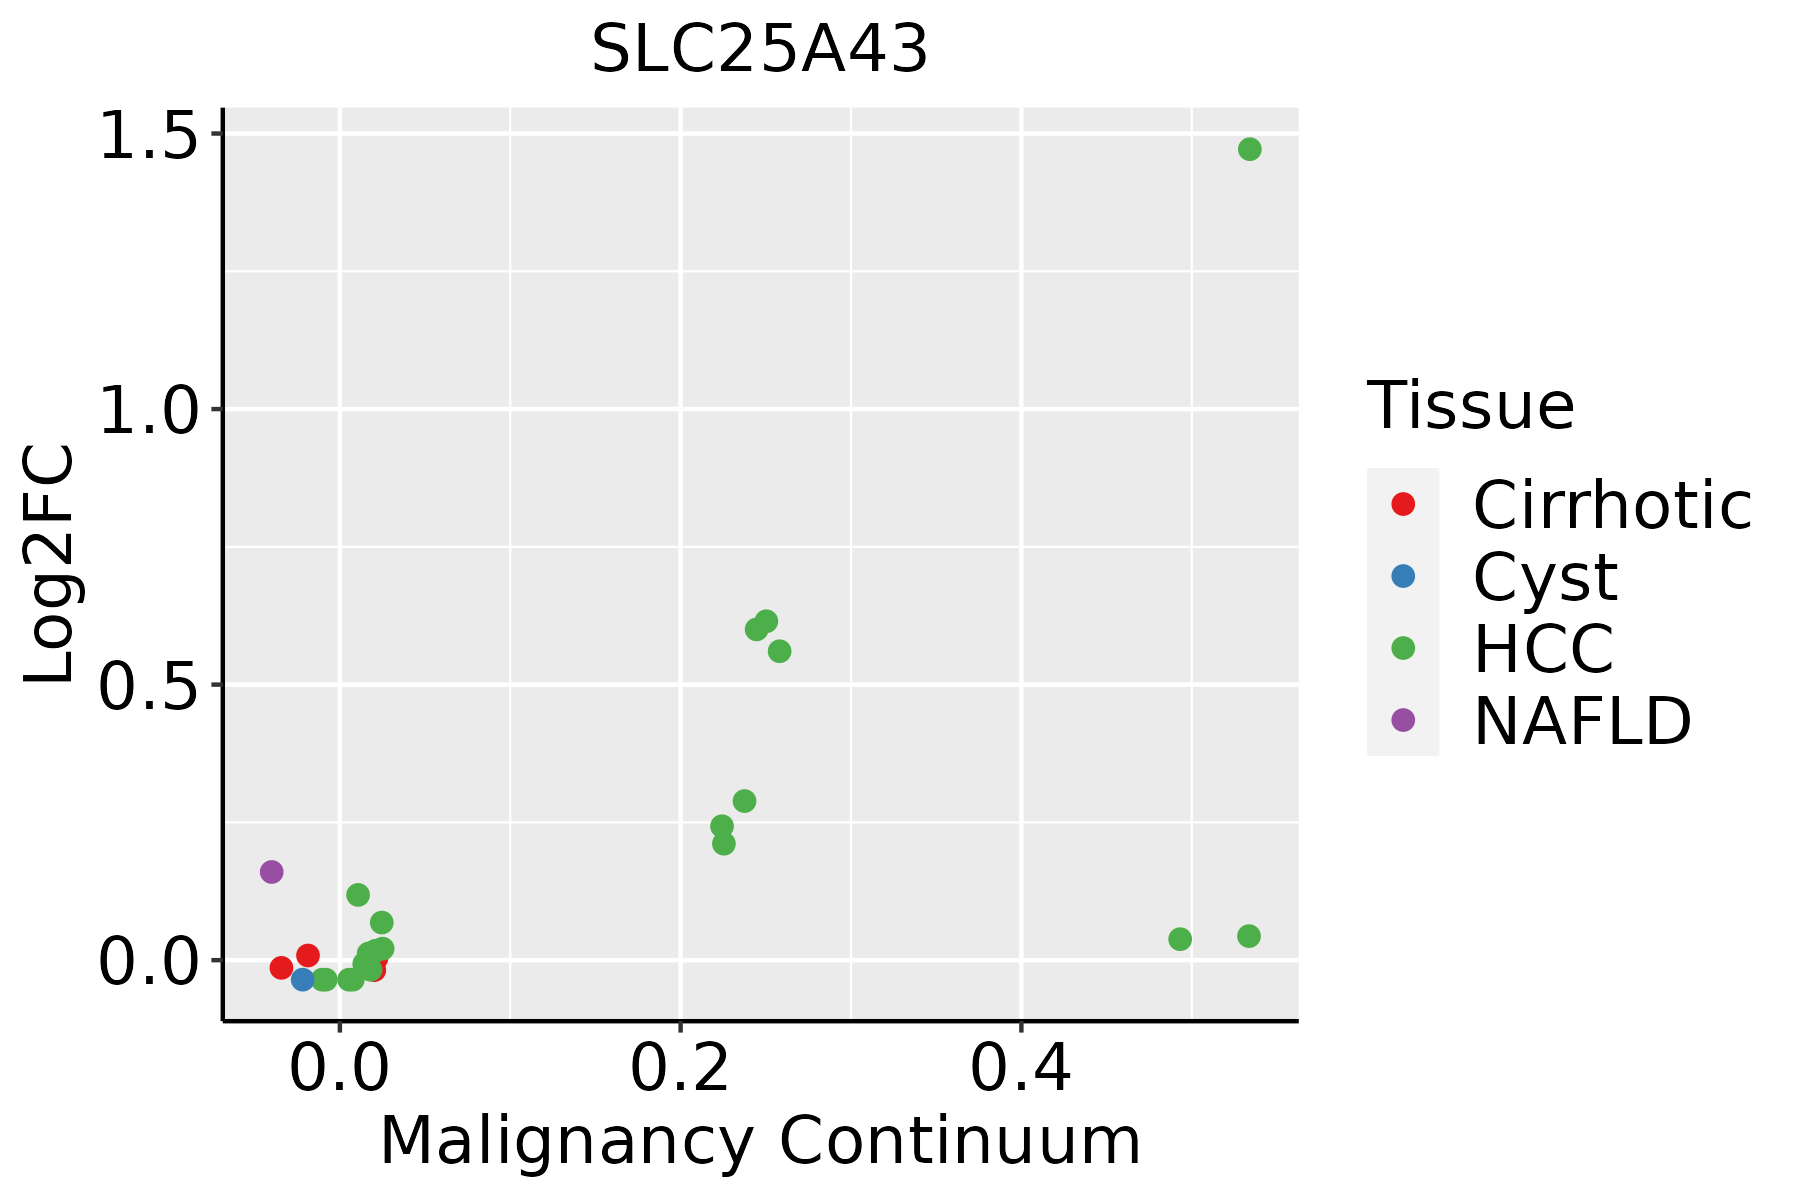 | HCC: Hepatocellular carcinoma |
| NAFLD: Non-alcoholic fatty liver disease | ||
| Oral Cavity | 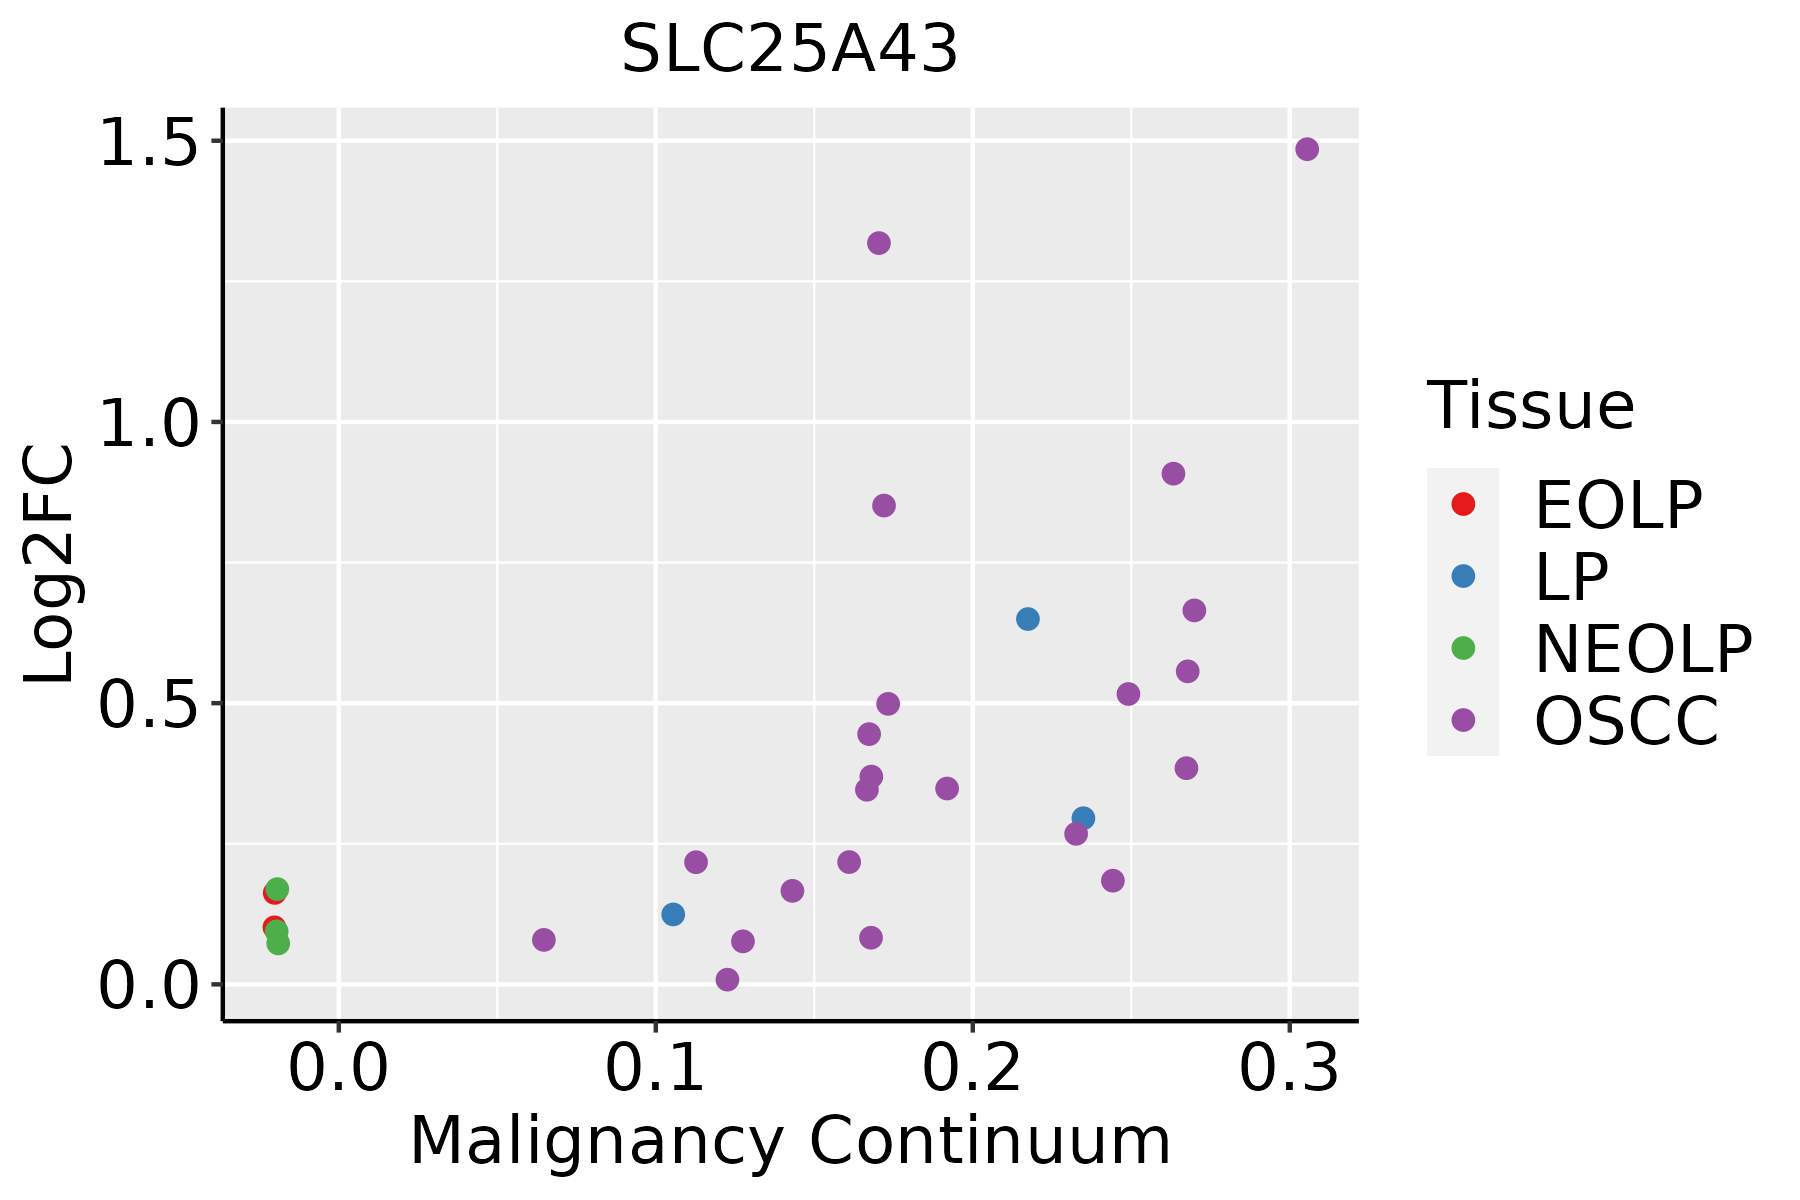 | EOLP: Erosive Oral lichen planus |
| LP: leukoplakia | ||
| NEOLP: Non-erosive oral lichen planus | ||
| OSCC: Oral squamous cell carcinoma |
| ∗log2FC in expression of this searched gene in stem-like cells from each diseased tissue sample relative to stem-like cells in normal samples in each tissue plotted against the malignancy continuum. Samples are colored based on if they are from different disease stage. |
Top |
Malignant transformation related pathway analysis |
| Find out the enriched GO biological processes and KEGG pathways involved in transition from healthy to precancer to cancer |
| Tissue | Disease Stage | Enriched GO biological Processes |
| Colorectum | AD |  |
| Colorectum | SER |  |
| Colorectum | MSS |  |
| Colorectum | MSI-H |  |
| Colorectum | FAP |  |
| ∗Top 15 enriched GO BP terms are showed in the bar plot of each disease state in each tissue. Each row represents a significant GO biological process which is colored according to the -log10(p.adjust). |
| Page: 1 2 3 4 5 6 7 8 9 |
| GO ID | Tissue | Disease Stage | Description | Gene Ratio | Bg Ratio | pvalue | p.adjust | Count |
| Page: 1 |
| Pathway ID | Tissue | Disease Stage | Description | Gene Ratio | Bg Ratio | pvalue | p.adjust | qvalue | Count |
| Page: 1 |
Top |
Cell-cell communication analysis |
| Identification of potential cell-cell interactions between two cell types and their ligand-receptor pairs for different disease states |
| Ligand | Receptor | LRpair | Pathway | Tissue | Disease Stage |
| Page: 1 |
Top |
Single-cell gene regulatory network inference analysis |
| Find out the significant the regulons (TFs) and the target genes of each regulon across cell types for different disease states |
| TF | Cell Type | Tissue | Disease Stage | Target Gene | RSS | Regulon Activity |
| ∗The dot plots of a searched regulon are shown for all cell subpopulations in each disease state of each tissue based on the regulon specific score inferred using pySCENIC and by calculating the average expression. |
| Page: 1 |
Top |
Somatic mutation of malignant transformation related genes |
| Annotation of somatic variants for genes involved in malignant transformation |
| Hugo Symbol | Variant Class | Variant Classification | dbSNP RS | HGVSc | HGVSp | HGVSp Short | SWISSPROT | BIOTYPE | SIFT | PolyPhen | Tumor Sample Barcode | Tissue | Histology | Sex | Age | Stage | Therapy Types | Drugs | Outcome |
| SLC25A43 | SNV | Missense_Mutation | novel | c.410N>T | p.Gln137Leu | p.Q137L | Q8WUT9 | protein_coding | deleterious(0) | probably_damaging(0.989) | TCGA-A7-A4SE-01 | Breast | breast invasive carcinoma | Female | <65 | I/II | Chemotherapy | adriamycin | CR |
| SLC25A43 | SNV | Missense_Mutation | novel | c.862N>C | p.Glu288Gln | p.E288Q | Q8WUT9 | protein_coding | deleterious(0) | probably_damaging(1) | TCGA-AR-A2LE-01 | Breast | breast invasive carcinoma | Female | >=65 | I/II | Hormone Therapy | tamoxiphen | PD |
| SLC25A43 | insertion | In_Frame_Ins | novel | c.498_499insAGCCGAGATCGTGCCACTGCACTCCAGCCTGGCCAACAAAGT | p.Gly166_Val167insSerArgAspArgAlaThrAlaLeuGlnProGlyGlnGlnSer | p.G166_V167insSRDRATALQPGQQS | Q8WUT9 | protein_coding | TCGA-AR-A0TY-01 | Breast | breast invasive carcinoma | Female | <65 | I/II | Unspecific | Paclitaxel | PD | ||
| SLC25A43 | deletion | Frame_Shift_Del | c.576_586delNNNNNNNNNNN | p.Asn193ArgfsTer11 | p.N193Rfs*11 | Q8WUT9 | protein_coding | TCGA-E2-A1LA-01 | Breast | breast invasive carcinoma | Female | <65 | I/II | Hormone Therapy | arimidex | SD | |||
| SLC25A43 | SNV | Missense_Mutation | novel | c.648N>C | p.Gln216His | p.Q216H | Q8WUT9 | protein_coding | deleterious(0.03) | possibly_damaging(0.896) | TCGA-HM-A4S6-01 | Cervix | cervical & endocervical cancer | Female | <65 | III/IV | Chemotherapy | cisplatin | CR |
| SLC25A43 | SNV | Missense_Mutation | novel | c.280G>T | p.Val94Phe | p.V94F | Q8WUT9 | protein_coding | deleterious(0.01) | possibly_damaging(0.73) | TCGA-VS-A9UM-01 | Cervix | cervical & endocervical cancer | Female | <65 | I/II | Chemotherapy | cisplatin | CR |
| SLC25A43 | SNV | Missense_Mutation | c.361N>G | p.Thr121Ala | p.T121A | Q8WUT9 | protein_coding | tolerated(0.5) | benign(0.129) | TCGA-AA-3854-01 | Colorectum | colon adenocarcinoma | Female | >=65 | I/II | Unknown | Unknown | SD | |
| SLC25A43 | SNV | Missense_Mutation | c.875N>T | p.Arg292Ile | p.R292I | Q8WUT9 | protein_coding | deleterious(0.01) | possibly_damaging(0.55) | TCGA-AA-3984-01 | Colorectum | colon adenocarcinoma | Female | <65 | I/II | Unknown | Unknown | SD | |
| SLC25A43 | SNV | Missense_Mutation | c.627N>G | p.Cys209Trp | p.C209W | Q8WUT9 | protein_coding | deleterious(0) | probably_damaging(0.998) | TCGA-F4-6806-01 | Colorectum | colon adenocarcinoma | Female | <65 | I/II | Chemotherapy | irinotecan | PD | |
| SLC25A43 | SNV | Missense_Mutation | c.1021N>A | p.Leu341Ile | p.L341I | Q8WUT9 | protein_coding | tolerated_low_confidence(0.06) | benign(0.014) | TCGA-AG-3727-01 | Colorectum | rectum adenocarcinoma | Female | >=65 | III/IV | Unknown | Unknown | SD |
| Page: 1 2 3 4 |
Top |
Related drugs of malignant transformation related genes |
| Identification of chemicals and drugs interact with genes involved in malignant transfromation |
| (DGIdb 4.0) |
| Entrez ID | Symbol | Category | Interaction Types | Drug Claim Name | Drug Name | PMIDs |
| Page: 1 |

Copyright 2023-Present -The University of Texas Health Science Center at Houston |