
|
|||||
|
 | |
| |
| |
| |
| |
| |
|
Gene: SLC25A41 |
Gene summary for SLC25A41 |
| Gene information | Species | Human | Gene symbol | SLC25A41 | Gene ID | 284427 |
| Gene name | solute carrier family 25 member 41 | |
| Gene Alias | APC4 | |
| Cytomap | 19p13.3 | |
| Gene Type | protein-coding | GO ID | GO:0006810 | UniProtAcc | Q8N5S1 |
Top |
Malignant transformation analysis |
| Identification of the aberrant gene expression in precancerous and cancerous lesions by comparing the gene expression of stem-like cells in diseased tissues with normal stem cells |
| Entrez ID | Symbol | Replicates | Species | Organ | Tissue | Adj P-value | Log2FC | Malignancy |
| 284427 | SLC25A41 | HCC1 | Human | Liver | HCC | 2.53e-11 | 1.02e+00 | 0.5336 |
| 284427 | SLC25A41 | HCC2 | Human | Liver | HCC | 1.21e-05 | 5.58e-01 | 0.5341 |
| 284427 | SLC25A41 | HCC5 | Human | Liver | HCC | 2.42e-07 | 4.32e-01 | 0.4932 |
| Page: 1 |
| Tissue | Expression Dynamics | Abbreviation |
| Liver | 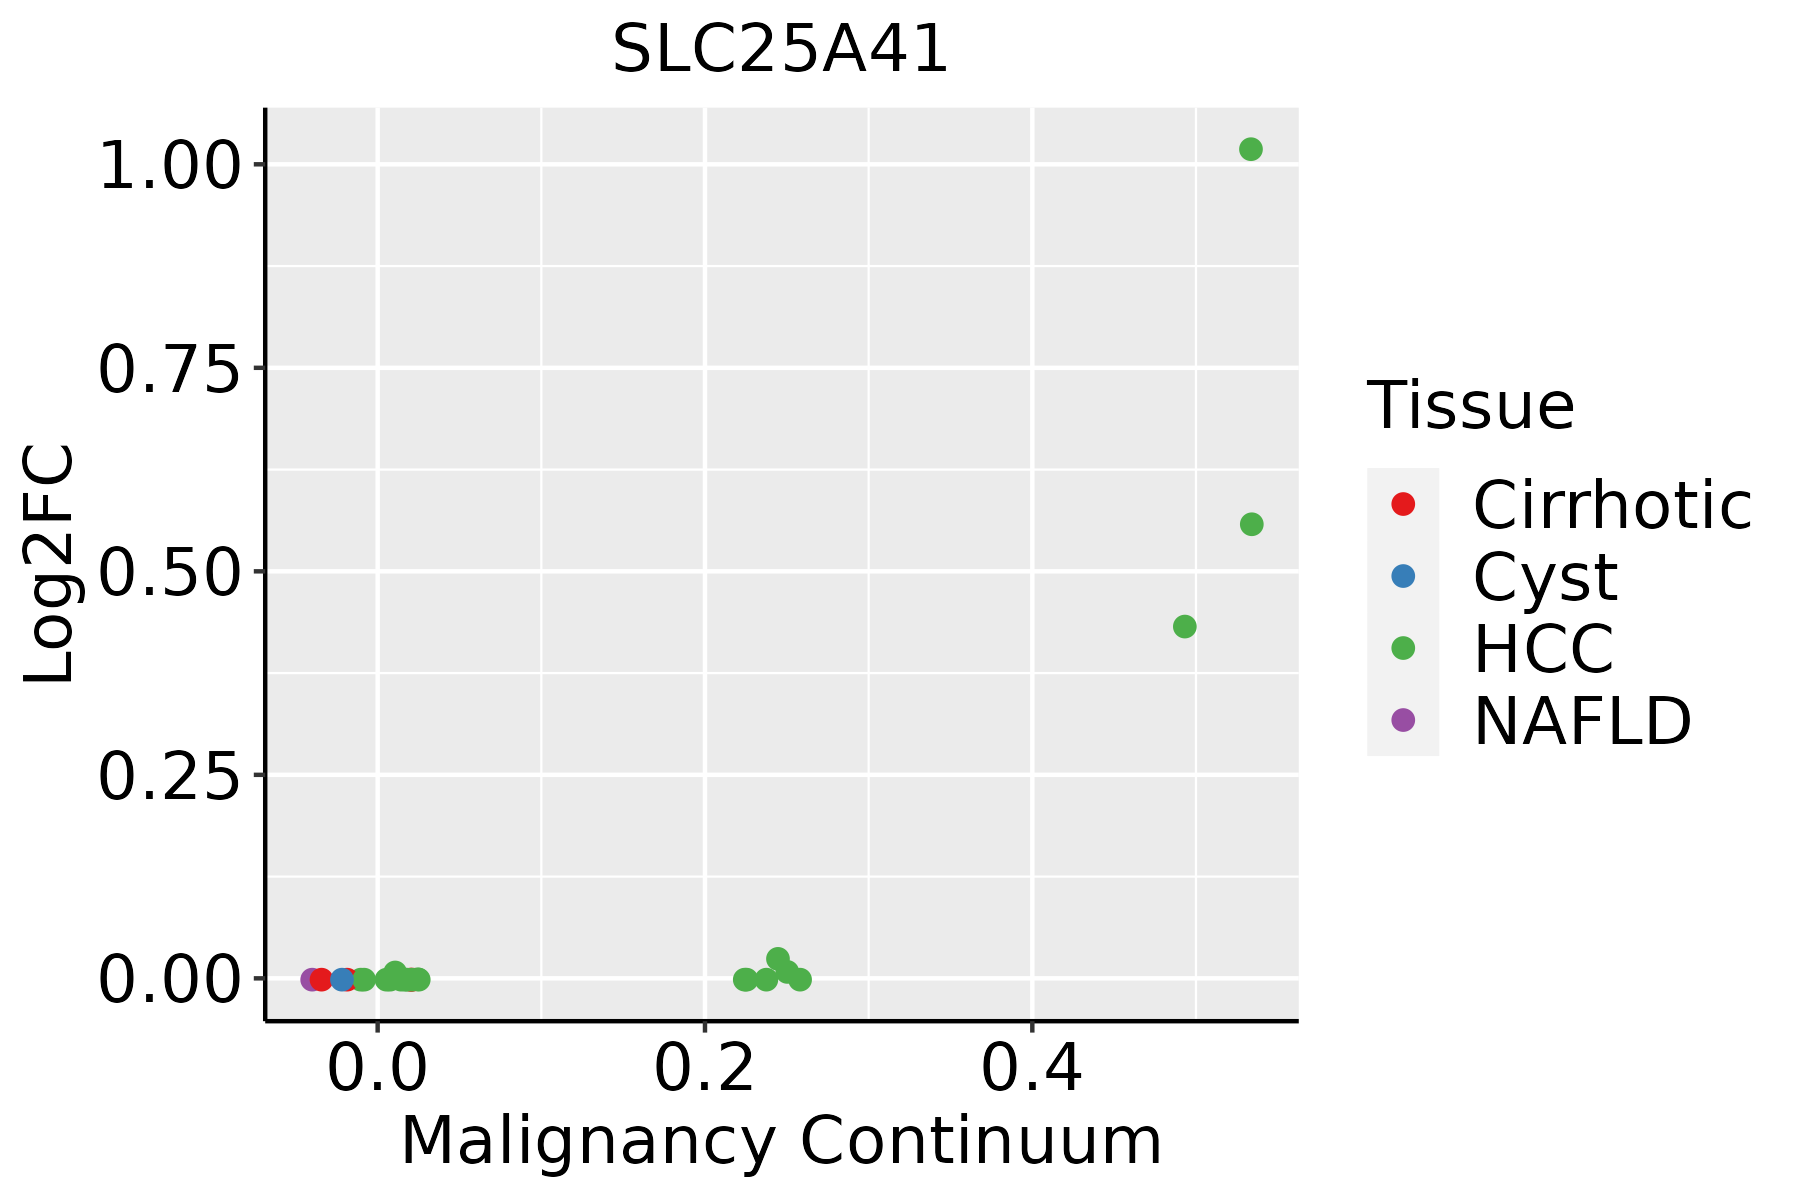 | HCC: Hepatocellular carcinoma |
| NAFLD: Non-alcoholic fatty liver disease |
| ∗log2FC in expression of this searched gene in stem-like cells from each diseased tissue sample relative to stem-like cells in normal samples in each tissue plotted against the malignancy continuum. Samples are colored based on if they are from different disease stage. |
Top |
Malignant transformation related pathway analysis |
| Find out the enriched GO biological processes and KEGG pathways involved in transition from healthy to precancer to cancer |
| Tissue | Disease Stage | Enriched GO biological Processes |
| Colorectum | AD |  |
| Colorectum | SER |  |
| Colorectum | MSS |  |
| Colorectum | MSI-H |  |
| Colorectum | FAP |  |
| ∗Top 15 enriched GO BP terms are showed in the bar plot of each disease state in each tissue. Each row represents a significant GO biological process which is colored according to the -log10(p.adjust). |
| Page: 1 2 3 4 5 6 7 8 9 |
| GO ID | Tissue | Disease Stage | Description | Gene Ratio | Bg Ratio | pvalue | p.adjust | Count |
| GO:000683912 | Liver | HCC | mitochondrial transport | 184/7958 | 254/18723 | 2.30e-22 | 3.83e-20 | 184 |
| GO:001593111 | Liver | HCC | nucleobase-containing compound transport | 150/7958 | 222/18723 | 3.17e-14 | 2.03e-12 | 150 |
| GO:199054212 | Liver | HCC | mitochondrial transmembrane transport | 78/7958 | 102/18723 | 2.73e-12 | 1.26e-10 | 78 |
| GO:1901264 | Liver | HCC | carbohydrate derivative transport | 48/7958 | 80/18723 | 1.19e-03 | 6.62e-03 | 48 |
| Page: 1 |
| Pathway ID | Tissue | Disease Stage | Description | Gene Ratio | Bg Ratio | pvalue | p.adjust | qvalue | Count |
| Page: 1 |
Top |
Cell-cell communication analysis |
| Identification of potential cell-cell interactions between two cell types and their ligand-receptor pairs for different disease states |
| Ligand | Receptor | LRpair | Pathway | Tissue | Disease Stage |
| Page: 1 |
Top |
Single-cell gene regulatory network inference analysis |
| Find out the significant the regulons (TFs) and the target genes of each regulon across cell types for different disease states |
| TF | Cell Type | Tissue | Disease Stage | Target Gene | RSS | Regulon Activity |
| ∗The dot plots of a searched regulon are shown for all cell subpopulations in each disease state of each tissue based on the regulon specific score inferred using pySCENIC and by calculating the average expression. |
| Page: 1 |
Top |
Somatic mutation of malignant transformation related genes |
| Annotation of somatic variants for genes involved in malignant transformation |
| Hugo Symbol | Variant Class | Variant Classification | dbSNP RS | HGVSc | HGVSp | HGVSp Short | SWISSPROT | BIOTYPE | SIFT | PolyPhen | Tumor Sample Barcode | Tissue | Histology | Sex | Age | Stage | Therapy Types | Drugs | Outcome |
| SLC25A41 | SNV | Missense_Mutation | c.891N>C | p.Gln297His | p.Q297H | Q8N5S1 | protein_coding | deleterious(0.01) | probably_damaging(0.999) | TCGA-AR-A0TX-01 | Breast | breast invasive carcinoma | Female | <65 | I/II | Unknown | Unknown | SD | |
| SLC25A41 | SNV | Missense_Mutation | novel | c.263N>T | p.Asn88Ile | p.N88I | Q8N5S1 | protein_coding | tolerated(0.09) | benign(0.038) | TCGA-E2-A573-01 | Breast | breast invasive carcinoma | Female | <65 | I/II | Chemotherapy | taxotere | CR |
| SLC25A41 | SNV | Missense_Mutation | c.208G>C | p.Val70Leu | p.V70L | Q8N5S1 | protein_coding | tolerated(0.16) | benign(0.347) | TCGA-LL-A5YP-01 | Breast | breast invasive carcinoma | Female | <65 | I/II | Chemotherapy | cytoxan | SD | |
| SLC25A41 | insertion | Frame_Shift_Ins | novel | c.1068_1069insT | p.Ser357Ter | p.S357* | Q8N5S1 | protein_coding | TCGA-5L-AAT1-01 | Breast | breast invasive carcinoma | Female | <65 | III/IV | Hormone Therapy | letrozol | SD | ||
| SLC25A41 | SNV | Missense_Mutation | novel | c.637N>T | p.Arg213Trp | p.R213W | Q8N5S1 | protein_coding | deleterious(0.01) | probably_damaging(1) | TCGA-2W-A8YY-01 | Cervix | cervical & endocervical cancer | Female | <65 | I/II | Chemotherapy | cisplatin | CR |
| SLC25A41 | SNV | Missense_Mutation | novel | c.385N>G | p.Phe129Val | p.F129V | Q8N5S1 | protein_coding | tolerated(0.44) | benign(0.006) | TCGA-2W-A8YY-01 | Cervix | cervical & endocervical cancer | Female | <65 | I/II | Chemotherapy | cisplatin | CR |
| SLC25A41 | SNV | Missense_Mutation | c.110N>A | p.Pro37His | p.P37H | Q8N5S1 | protein_coding | deleterious_low_confidence(0) | possibly_damaging(0.75) | TCGA-IR-A3LI-01 | Cervix | cervical & endocervical cancer | Female | <65 | I/II | Chemotherapy | cisplatin | CR | |
| SLC25A41 | SNV | Missense_Mutation | novel | c.38N>T | p.Ser13Phe | p.S13F | Q8N5S1 | protein_coding | deleterious_low_confidence(0.01) | benign(0.169) | TCGA-MA-AA42-01 | Cervix | cervical & endocervical cancer | Female | >=65 | I/II | Unknown | Unknown | SD |
| SLC25A41 | SNV | Missense_Mutation | c.341N>G | p.Asp114Gly | p.D114G | Q8N5S1 | protein_coding | deleterious(0) | probably_damaging(0.99) | TCGA-F4-6570-01 | Colorectum | colon adenocarcinoma | Female | >=65 | I/II | Unknown | Unknown | SD | |
| SLC25A41 | SNV | Missense_Mutation | novel | c.796C>A | p.Leu266Ile | p.L266I | Q8N5S1 | protein_coding | deleterious(0.04) | possibly_damaging(0.777) | TCGA-F5-6814-01 | Colorectum | rectum adenocarcinoma | Male | <65 | I/II | Unknown | Unknown | SD |
| Page: 1 2 3 4 |
Top |
Related drugs of malignant transformation related genes |
| Identification of chemicals and drugs interact with genes involved in malignant transfromation |
| (DGIdb 4.0) |
| Entrez ID | Symbol | Category | Interaction Types | Drug Claim Name | Drug Name | PMIDs |
| Page: 1 |

Copyright 2023-Present -The University of Texas Health Science Center at Houston |