
|
|||||
|
 | |
| |
| |
| |
| |
| |
|
Gene: SLC25A39 |
Gene summary for SLC25A39 |
| Gene information | Species | Human | Gene symbol | SLC25A39 | Gene ID | 51629 |
| Gene name | solute carrier family 25 member 39 | |
| Gene Alias | CGI-69 | |
| Cytomap | 17q21.31 | |
| Gene Type | protein-coding | GO ID | GO:0006725 | UniProtAcc | Q9BZJ4 |
Top |
Malignant transformation analysis |
| Identification of the aberrant gene expression in precancerous and cancerous lesions by comparing the gene expression of stem-like cells in diseased tissues with normal stem cells |
| Entrez ID | Symbol | Replicates | Species | Organ | Tissue | Adj P-value | Log2FC | Malignancy |
| 51629 | SLC25A39 | HTA11_3410_2000001011 | Human | Colorectum | AD | 3.48e-27 | 5.40e-01 | 0.0155 |
| 51629 | SLC25A39 | HTA11_2487_2000001011 | Human | Colorectum | SER | 1.20e-28 | 8.88e-01 | -0.1808 |
| 51629 | SLC25A39 | HTA11_2951_2000001011 | Human | Colorectum | AD | 8.81e-06 | 5.35e-01 | 0.0216 |
| 51629 | SLC25A39 | HTA11_1938_2000001011 | Human | Colorectum | AD | 7.82e-25 | 9.79e-01 | -0.0811 |
| 51629 | SLC25A39 | HTA11_78_2000001011 | Human | Colorectum | AD | 1.45e-20 | 6.83e-01 | -0.1088 |
| 51629 | SLC25A39 | HTA11_347_2000001011 | Human | Colorectum | AD | 9.44e-46 | 8.54e-01 | -0.1954 |
| 51629 | SLC25A39 | HTA11_411_2000001011 | Human | Colorectum | SER | 2.86e-15 | 1.23e+00 | -0.2602 |
| 51629 | SLC25A39 | HTA11_2112_2000001011 | Human | Colorectum | SER | 3.12e-03 | 6.35e-01 | -0.2196 |
| 51629 | SLC25A39 | HTA11_3361_2000001011 | Human | Colorectum | AD | 1.04e-23 | 9.57e-01 | -0.1207 |
| 51629 | SLC25A39 | HTA11_83_2000001011 | Human | Colorectum | SER | 5.94e-27 | 9.96e-01 | -0.1526 |
| 51629 | SLC25A39 | HTA11_696_2000001011 | Human | Colorectum | AD | 9.56e-45 | 1.03e+00 | -0.1464 |
| 51629 | SLC25A39 | HTA11_866_2000001011 | Human | Colorectum | AD | 8.27e-23 | 6.31e-01 | -0.1001 |
| 51629 | SLC25A39 | HTA11_1391_2000001011 | Human | Colorectum | AD | 1.18e-44 | 1.27e+00 | -0.059 |
| 51629 | SLC25A39 | HTA11_2992_2000001011 | Human | Colorectum | SER | 2.59e-14 | 9.67e-01 | -0.1706 |
| 51629 | SLC25A39 | HTA11_5212_2000001011 | Human | Colorectum | AD | 7.15e-11 | 5.67e-01 | -0.2061 |
| 51629 | SLC25A39 | HTA11_5216_2000001011 | Human | Colorectum | SER | 5.20e-10 | 8.48e-01 | -0.1462 |
| 51629 | SLC25A39 | HTA11_546_2000001011 | Human | Colorectum | AD | 2.94e-10 | 6.09e-01 | -0.0842 |
| 51629 | SLC25A39 | HTA11_9341_2000001011 | Human | Colorectum | SER | 6.51e-10 | 8.83e-01 | -0.00410000000000005 |
| 51629 | SLC25A39 | HTA11_7862_2000001011 | Human | Colorectum | AD | 2.09e-13 | 6.15e-01 | -0.0179 |
| 51629 | SLC25A39 | HTA11_866_3004761011 | Human | Colorectum | AD | 1.56e-37 | 8.33e-01 | 0.096 |
| Page: 1 2 3 4 5 6 7 8 9 |
| Tissue | Expression Dynamics | Abbreviation |
| Colorectum (GSE201348) |  | FAP: Familial adenomatous polyposis |
| CRC: Colorectal cancer | ||
| Colorectum (HTA11) |  | AD: Adenomas |
| SER: Sessile serrated lesions | ||
| MSI-H: Microsatellite-high colorectal cancer | ||
| MSS: Microsatellite stable colorectal cancer | ||
| Esophagus | 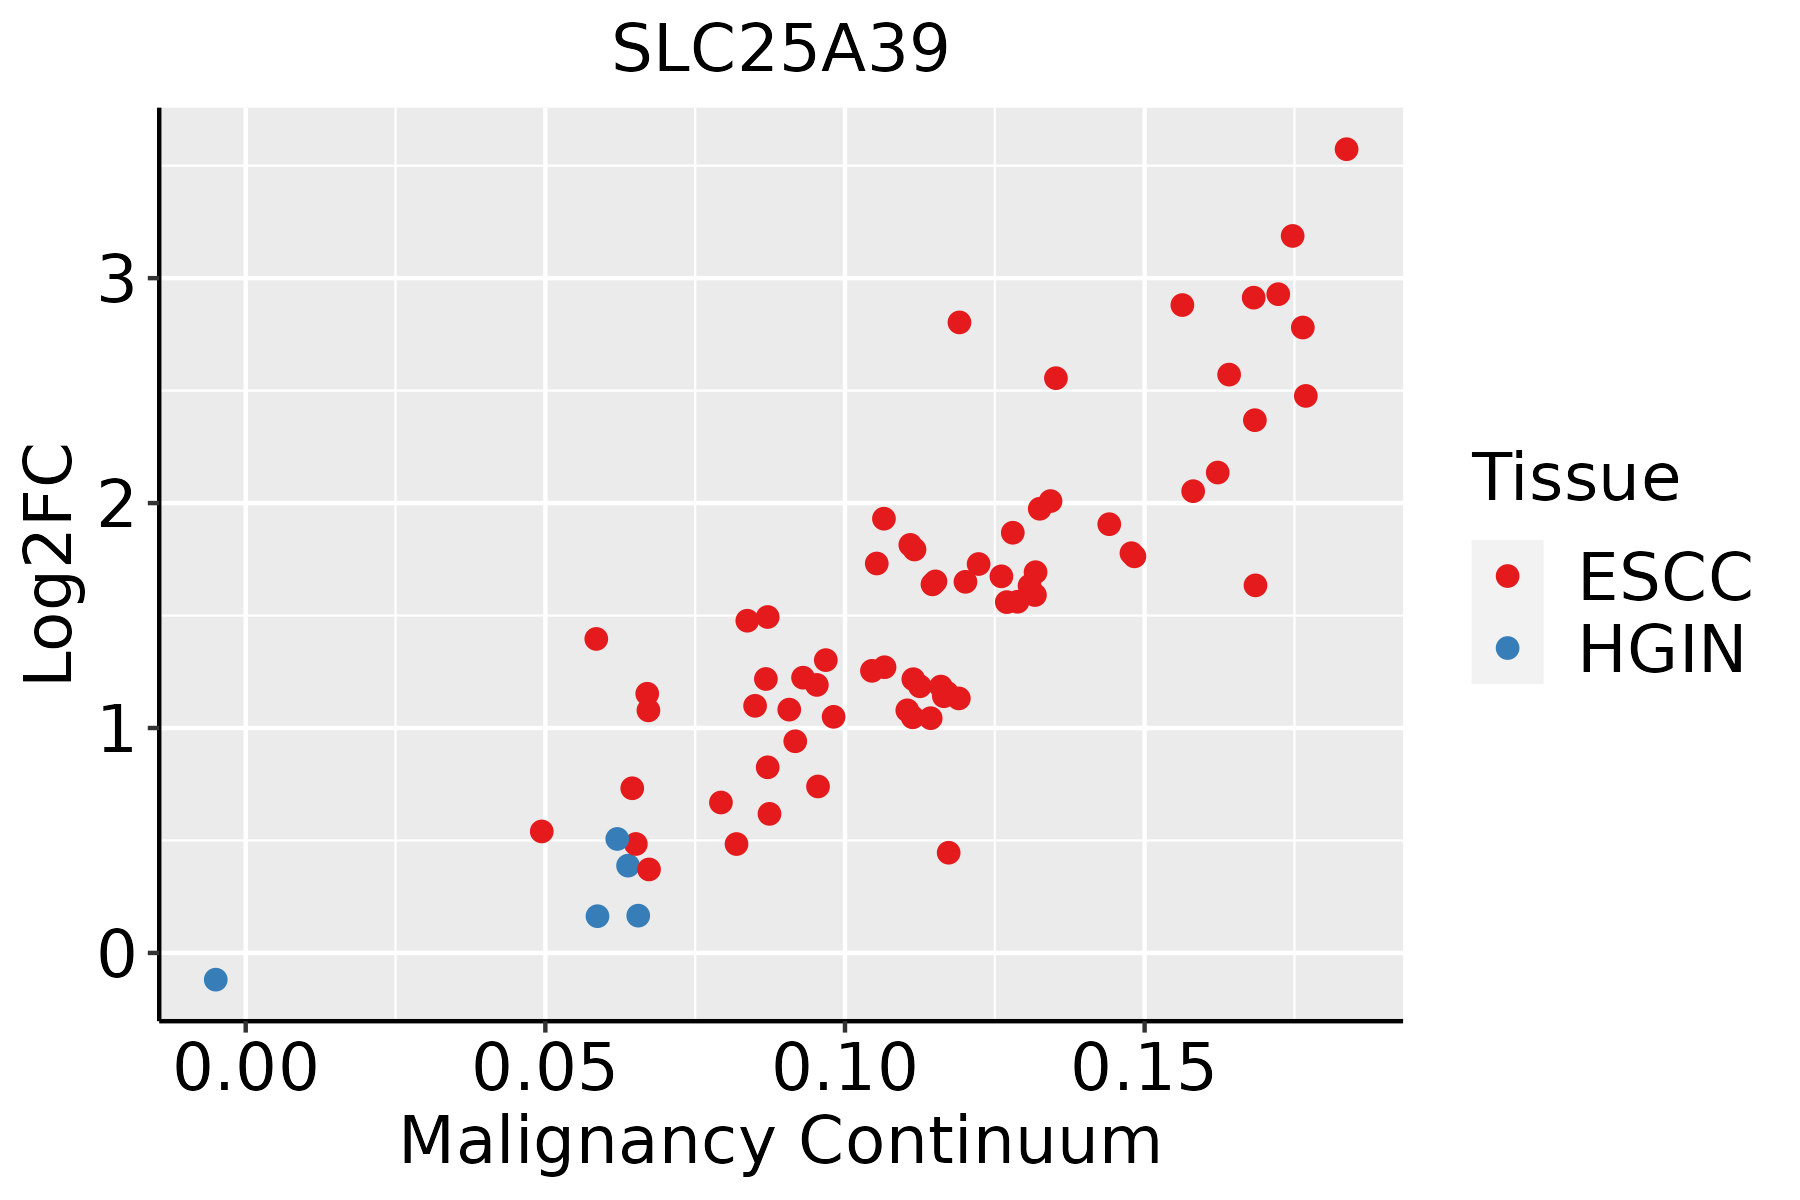 | ESCC: Esophageal squamous cell carcinoma |
| HGIN: High-grade intraepithelial neoplasias | ||
| LGIN: Low-grade intraepithelial neoplasias | ||
| Liver |  | HCC: Hepatocellular carcinoma |
| NAFLD: Non-alcoholic fatty liver disease | ||
| Oral Cavity | 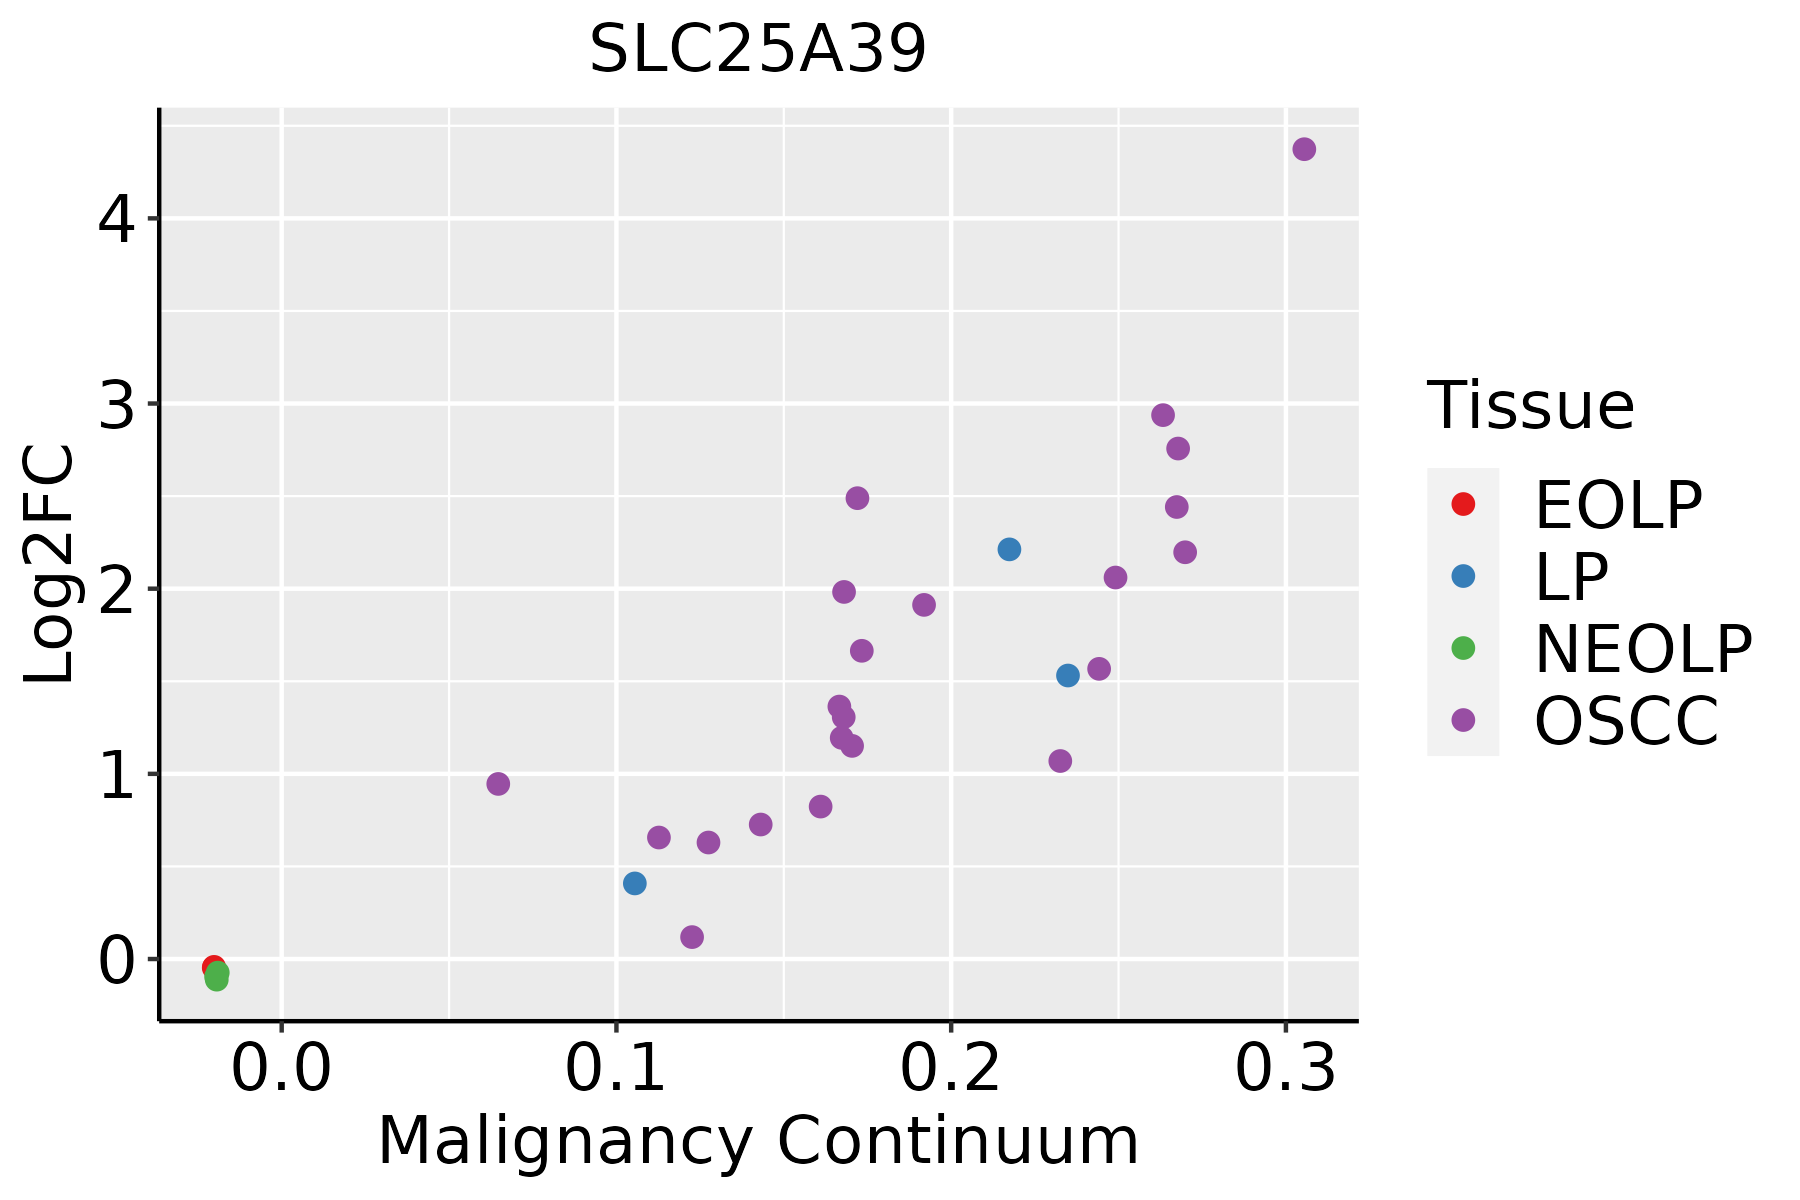 | EOLP: Erosive Oral lichen planus |
| LP: leukoplakia | ||
| NEOLP: Non-erosive oral lichen planus | ||
| OSCC: Oral squamous cell carcinoma | ||
| Prostate | 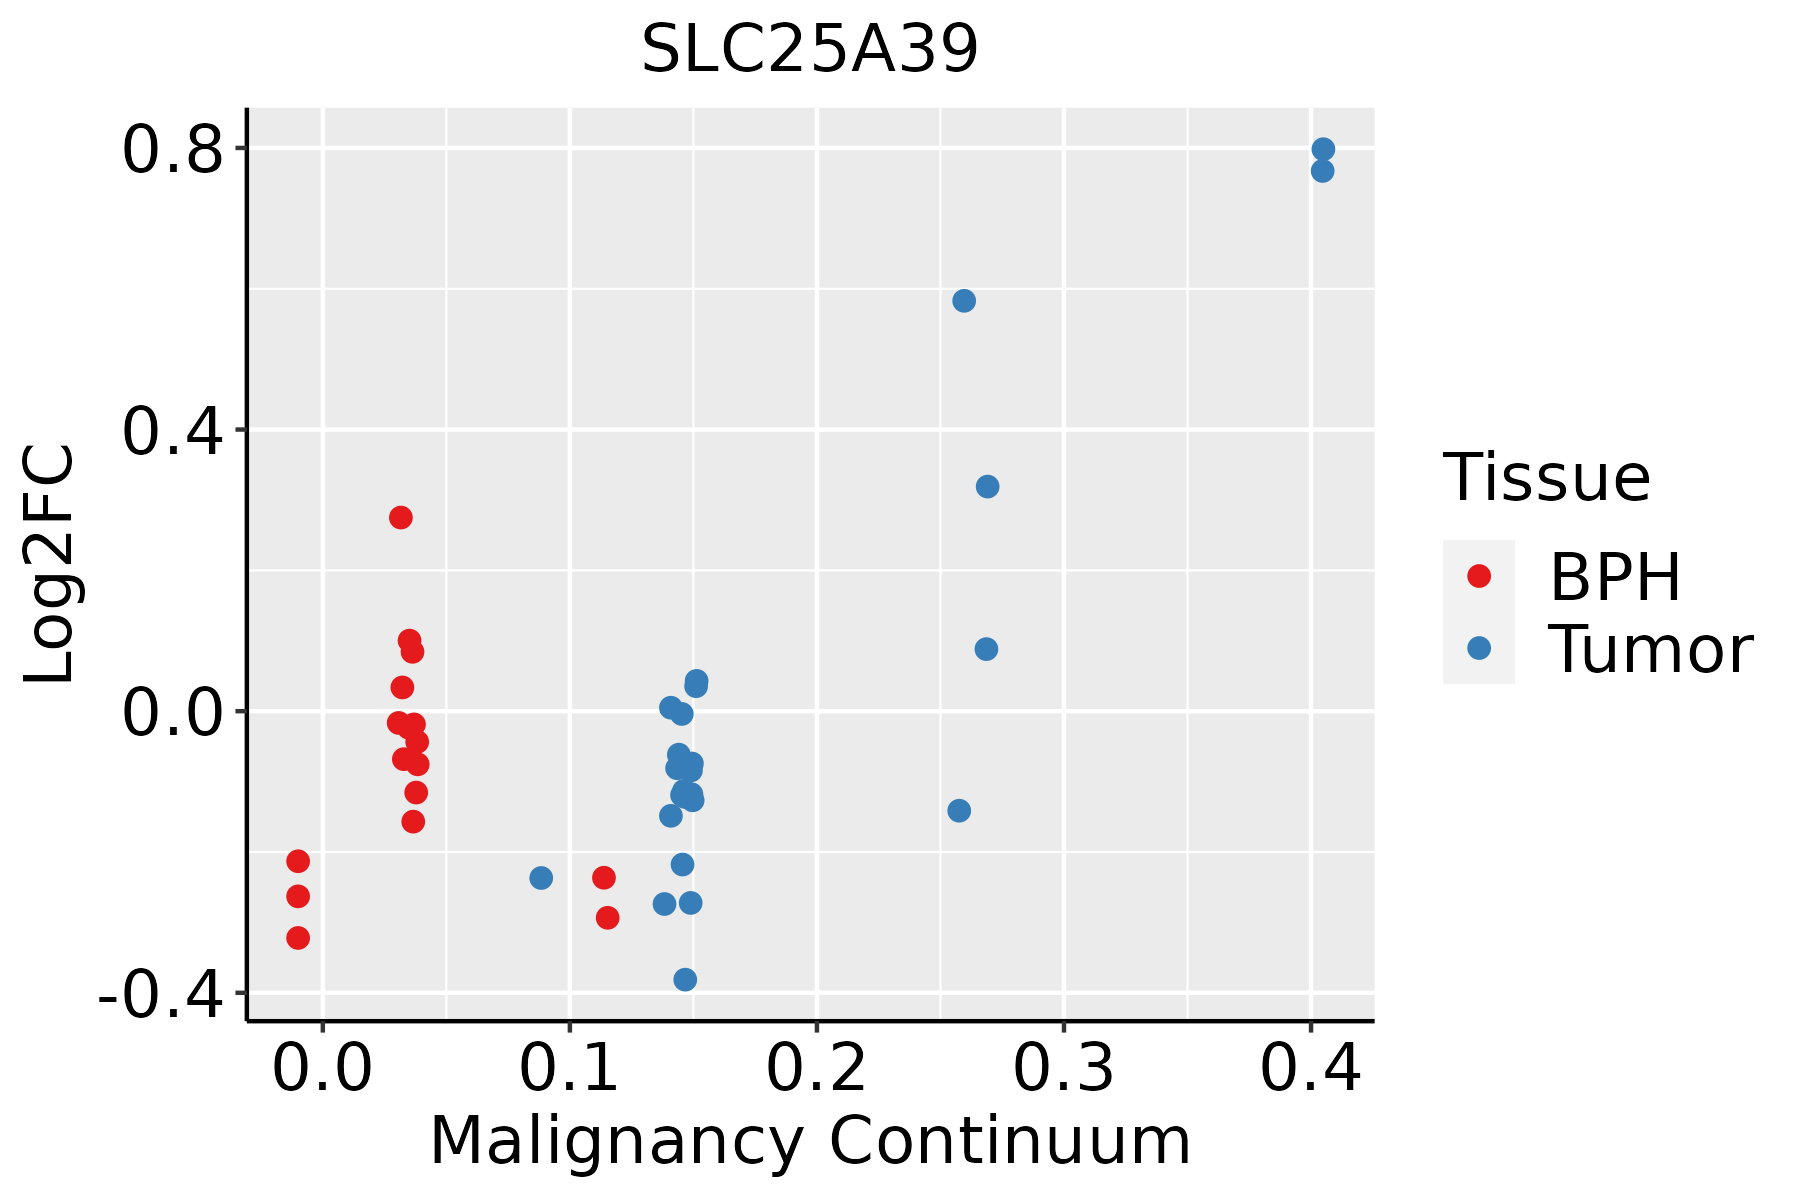 | BPH: Benign Prostatic Hyperplasia |
| Skin | 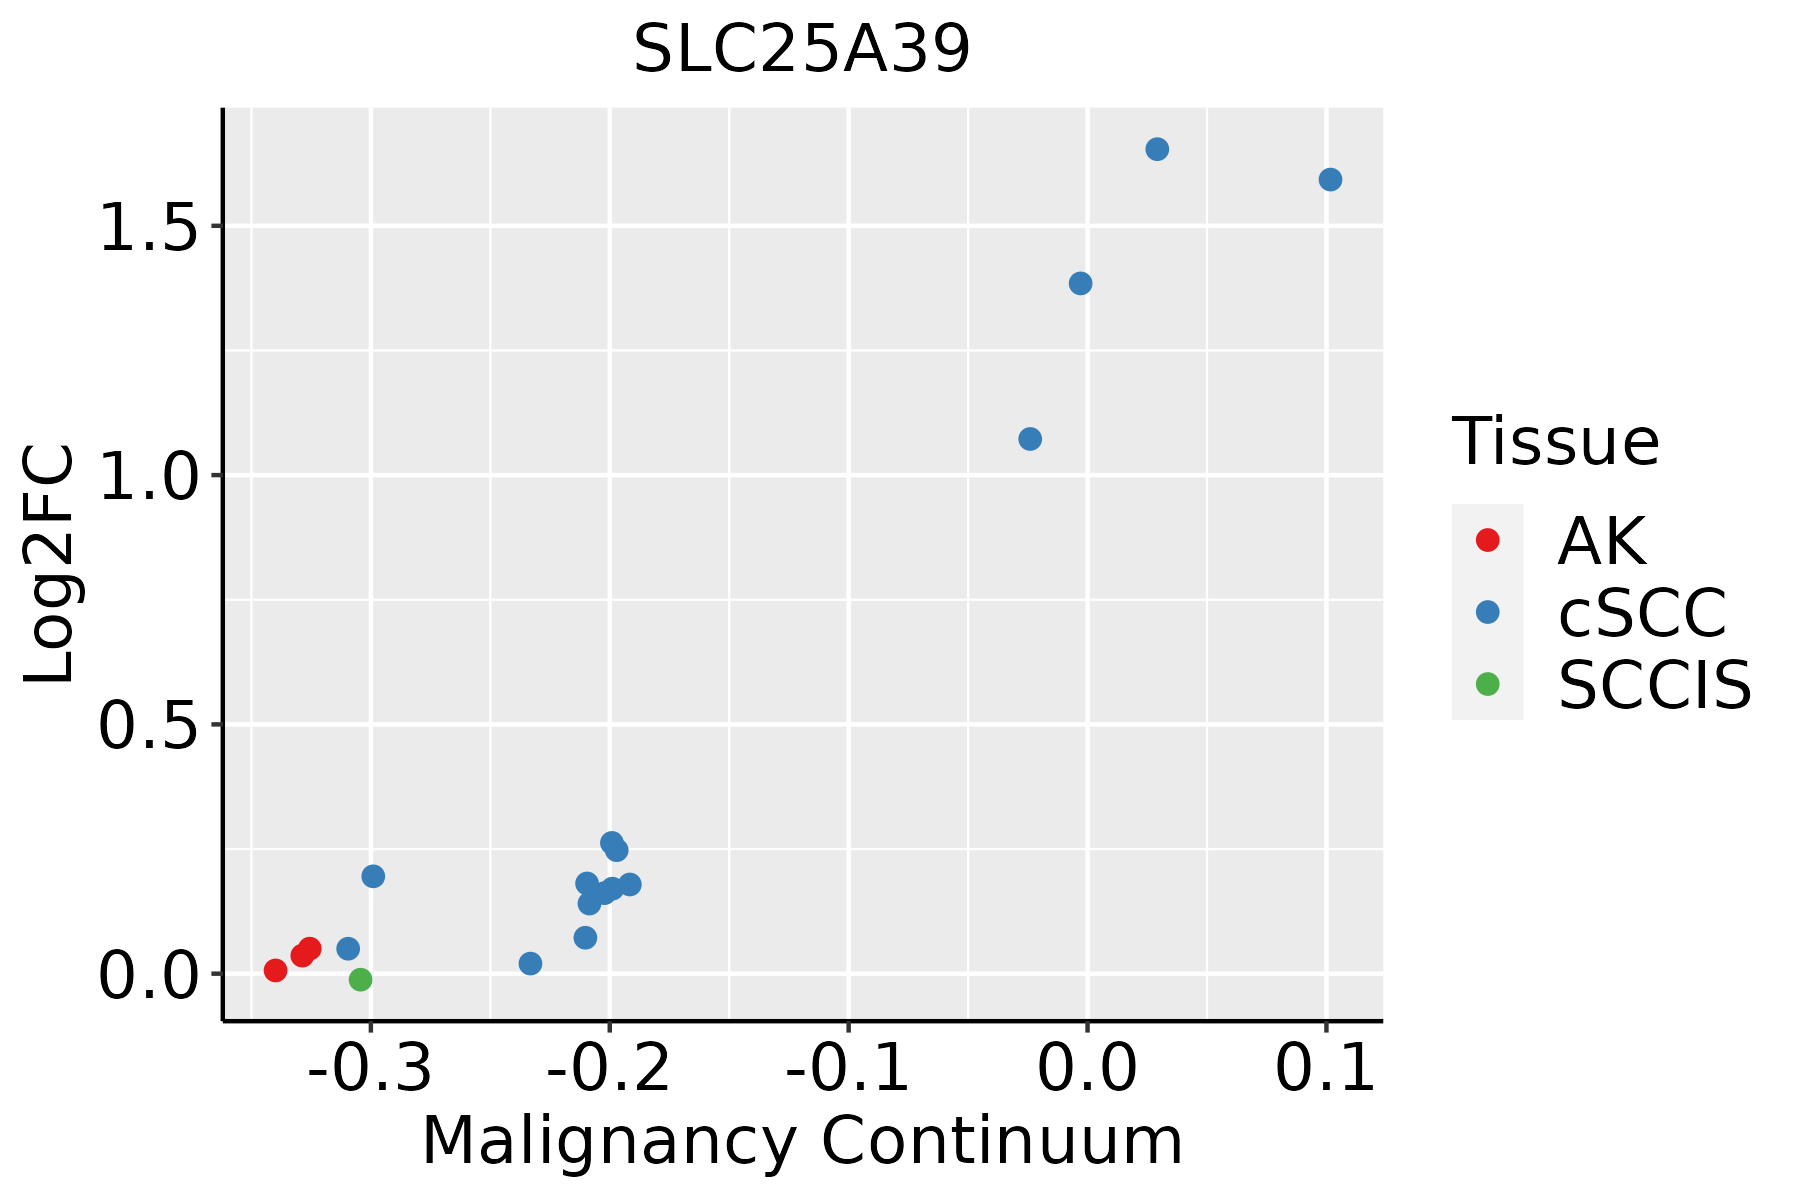 | AK: Actinic keratosis |
| cSCC: Cutaneous squamous cell carcinoma | ||
| SCCIS:squamous cell carcinoma in situ | ||
| Thyroid | 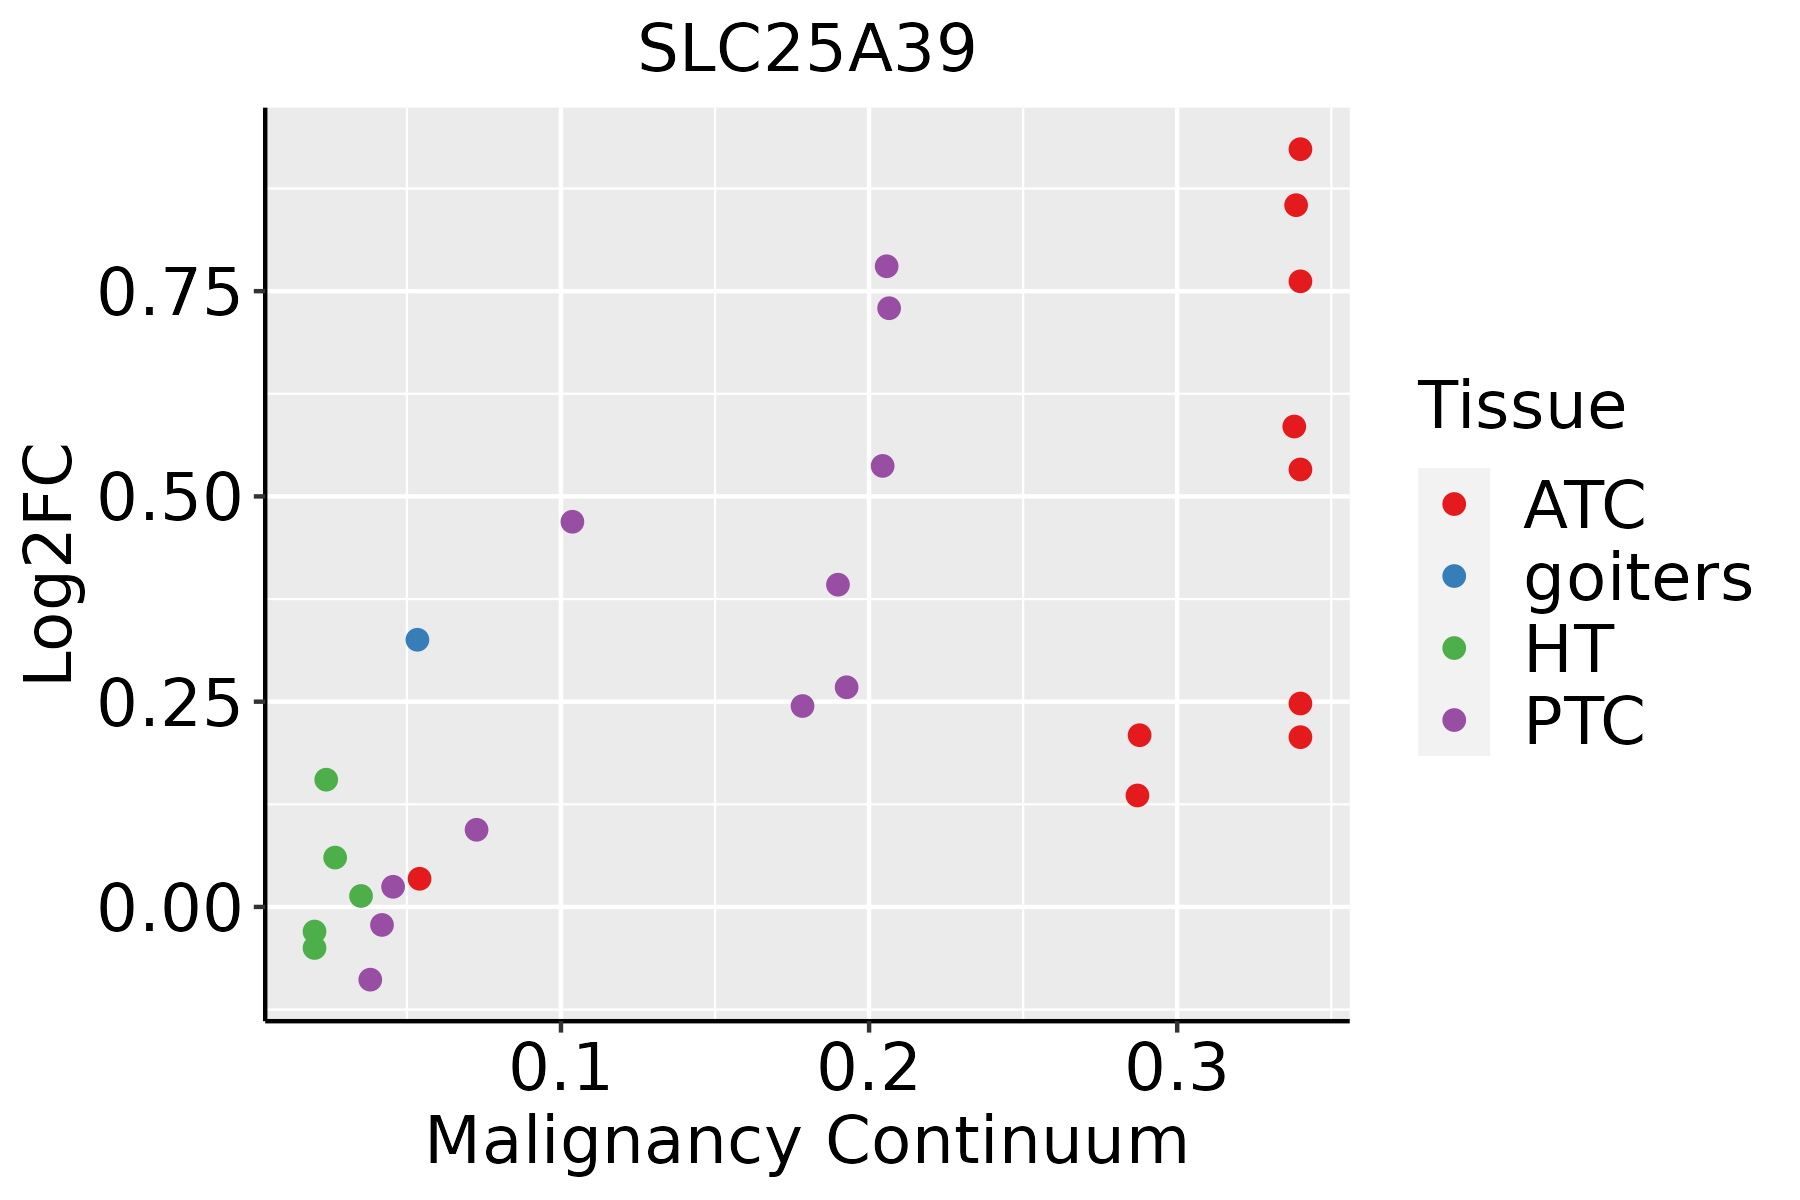 | ATC: Anaplastic thyroid cancer |
| HT: Hashimoto's thyroiditis | ||
| PTC: Papillary thyroid cancer |
| ∗log2FC in expression of this searched gene in stem-like cells from each diseased tissue sample relative to stem-like cells in normal samples in each tissue plotted against the malignancy continuum. Samples are colored based on if they are from different disease stage. |
Top |
Malignant transformation related pathway analysis |
| Find out the enriched GO biological processes and KEGG pathways involved in transition from healthy to precancer to cancer |
| Tissue | Disease Stage | Enriched GO biological Processes |
| Colorectum | AD |  |
| Colorectum | SER |  |
| Colorectum | MSS |  |
| Colorectum | MSI-H |  |
| Colorectum | FAP |  |
| ∗Top 15 enriched GO BP terms are showed in the bar plot of each disease state in each tissue. Each row represents a significant GO biological process which is colored according to the -log10(p.adjust). |
| Page: 1 2 3 4 5 6 7 8 9 |
| GO ID | Tissue | Disease Stage | Description | Gene Ratio | Bg Ratio | pvalue | p.adjust | Count |
| GO:00067791 | Esophagus | ESCC | porphyrin-containing compound biosynthetic process | 23/8552 | 31/18723 | 1.20e-03 | 5.88e-03 | 23 |
| GO:00330141 | Esophagus | ESCC | tetrapyrrole biosynthetic process | 23/8552 | 31/18723 | 1.20e-03 | 5.88e-03 | 23 |
| GO:00461482 | Esophagus | ESCC | pigment biosynthetic process | 40/8552 | 62/18723 | 2.14e-03 | 9.54e-03 | 40 |
| GO:00067832 | Esophagus | ESCC | heme biosynthetic process | 20/8552 | 27/18723 | 2.61e-03 | 1.11e-02 | 20 |
| GO:00330132 | Esophagus | ESCC | tetrapyrrole metabolic process | 37/8552 | 59/18723 | 6.23e-03 | 2.29e-02 | 37 |
| GO:00424401 | Esophagus | ESCC | pigment metabolic process | 50/8552 | 84/18723 | 7.34e-03 | 2.64e-02 | 50 |
| GO:00421681 | Esophagus | ESCC | heme metabolic process | 27/8552 | 42/18723 | 1.16e-02 | 3.90e-02 | 27 |
| GO:0033013 | Liver | Cirrhotic | tetrapyrrole metabolic process | 24/4634 | 59/18723 | 5.06e-03 | 2.62e-02 | 24 |
| GO:0006778 | Liver | Cirrhotic | porphyrin-containing compound metabolic process | 20/4634 | 49/18723 | 9.60e-03 | 4.35e-02 | 20 |
| GO:0042168 | Liver | HCC | heme metabolic process | 30/7958 | 42/18723 | 1.40e-04 | 1.13e-03 | 30 |
| GO:00330131 | Liver | HCC | tetrapyrrole metabolic process | 39/7958 | 59/18723 | 2.14e-04 | 1.63e-03 | 39 |
| GO:00067781 | Liver | HCC | porphyrin-containing compound metabolic process | 33/7958 | 49/18723 | 3.86e-04 | 2.62e-03 | 33 |
| GO:0042440 | Liver | HCC | pigment metabolic process | 51/7958 | 84/18723 | 5.74e-04 | 3.65e-03 | 51 |
| GO:0006783 | Liver | HCC | heme biosynthetic process | 19/7958 | 27/18723 | 3.18e-03 | 1.47e-02 | 19 |
| GO:0006779 | Liver | HCC | porphyrin-containing compound biosynthetic process | 21/7958 | 31/18723 | 4.01e-03 | 1.76e-02 | 21 |
| GO:0033014 | Liver | HCC | tetrapyrrole biosynthetic process | 21/7958 | 31/18723 | 4.01e-03 | 1.76e-02 | 21 |
| GO:0046148 | Liver | HCC | pigment biosynthetic process | 37/7958 | 62/18723 | 4.73e-03 | 2.02e-02 | 37 |
| GO:00461481 | Oral cavity | OSCC | pigment biosynthetic process | 36/7305 | 62/18723 | 1.82e-03 | 8.57e-03 | 36 |
| GO:00067831 | Oral cavity | OSCC | heme biosynthetic process | 17/7305 | 27/18723 | 1.01e-02 | 3.49e-02 | 17 |
| Page: 1 |
| Pathway ID | Tissue | Disease Stage | Description | Gene Ratio | Bg Ratio | pvalue | p.adjust | qvalue | Count |
| Page: 1 |
Top |
Cell-cell communication analysis |
| Identification of potential cell-cell interactions between two cell types and their ligand-receptor pairs for different disease states |
| Ligand | Receptor | LRpair | Pathway | Tissue | Disease Stage |
| Page: 1 |
Top |
Single-cell gene regulatory network inference analysis |
| Find out the significant the regulons (TFs) and the target genes of each regulon across cell types for different disease states |
| TF | Cell Type | Tissue | Disease Stage | Target Gene | RSS | Regulon Activity |
| ∗The dot plots of a searched regulon are shown for all cell subpopulations in each disease state of each tissue based on the regulon specific score inferred using pySCENIC and by calculating the average expression. |
| Page: 1 |
Top |
Somatic mutation of malignant transformation related genes |
| Annotation of somatic variants for genes involved in malignant transformation |
| Hugo Symbol | Variant Class | Variant Classification | dbSNP RS | HGVSc | HGVSp | HGVSp Short | SWISSPROT | BIOTYPE | SIFT | PolyPhen | Tumor Sample Barcode | Tissue | Histology | Sex | Age | Stage | Therapy Types | Drugs | Outcome |
| SLC25A39 | SNV | Missense_Mutation | novel | c.512N>G | p.Ala171Gly | p.A171G | Q9BZJ4 | protein_coding | deleterious(0.02) | probably_damaging(0.992) | TCGA-A7-A56D-01 | Breast | breast invasive carcinoma | Female | >=65 | I/II | Hormone Therapy | arimidex | SD |
| SLC25A39 | SNV | Missense_Mutation | c.788N>T | p.Gly263Val | p.G263V | Q9BZJ4 | protein_coding | deleterious(0.03) | benign(0.41) | TCGA-AR-A24H-01 | Breast | breast invasive carcinoma | Female | >=65 | I/II | Hormone Therapy | tamoxiphen | SD | |
| SLC25A39 | insertion | Frame_Shift_Ins | novel | c.120_121insCTTTGGGAGGCTGAGGTGGGTGGATCACCTGA | p.Ser41LeufsTer21 | p.S41Lfs*21 | Q9BZJ4 | protein_coding | TCGA-BH-A0HK-01 | Breast | breast invasive carcinoma | Female | >=65 | I/II | Hormone Therapy | arimidex | SD | ||
| SLC25A39 | SNV | Missense_Mutation | rs748101051 | c.792N>G | p.Ile264Met | p.I264M | Q9BZJ4 | protein_coding | deleterious(0.05) | benign(0.071) | TCGA-IR-A3LA-01 | Cervix | cervical & endocervical cancer | Female | <65 | I/II | Chemotherapy | cisplatin | CR |
| SLC25A39 | SNV | Missense_Mutation | rs757102633 | c.112N>T | p.Arg38Cys | p.R38C | Q9BZJ4 | protein_coding | deleterious(0) | possibly_damaging(0.693) | TCGA-IR-A3LC-01 | Cervix | cervical & endocervical cancer | Female | <65 | I/II | Unspecific | Cisplatin | Complete Response |
| SLC25A39 | SNV | Missense_Mutation | rs746042795 | c.832G>A | p.Val278Met | p.V278M | Q9BZJ4 | protein_coding | deleterious(0) | probably_damaging(0.976) | TCGA-5M-AAT6-01 | Colorectum | colon adenocarcinoma | Female | <65 | III/IV | Unknown | Unknown | PD |
| SLC25A39 | SNV | Missense_Mutation | rs745986185 | c.638N>A | p.Arg213His | p.R213H | Q9BZJ4 | protein_coding | tolerated(0.25) | probably_damaging(0.959) | TCGA-AA-3492-01 | Colorectum | colon adenocarcinoma | Female | >=65 | I/II | Unknown | Unknown | SD |
| SLC25A39 | SNV | Missense_Mutation | c.575A>G | p.Gln192Arg | p.Q192R | Q9BZJ4 | protein_coding | tolerated(1) | benign(0.006) | TCGA-AA-3663-01 | Colorectum | colon adenocarcinoma | Male | <65 | I/II | Unknown | Unknown | SD | |
| SLC25A39 | SNV | Missense_Mutation | rs139586541 | c.848N>A | p.Arg283His | p.R283H | Q9BZJ4 | protein_coding | deleterious(0) | possibly_damaging(0.634) | TCGA-AA-A022-01 | Colorectum | colon adenocarcinoma | Female | >=65 | I/II | Unknown | Unknown | SD |
| SLC25A39 | SNV | Missense_Mutation | c.206N>G | p.Gln69Arg | p.Q69R | Q9BZJ4 | protein_coding | tolerated(0.48) | benign(0) | TCGA-AZ-6598-01 | Colorectum | colon adenocarcinoma | Female | >=65 | I/II | Unknown | Unknown | SD |
| Page: 1 2 3 4 |
Top |
Related drugs of malignant transformation related genes |
| Identification of chemicals and drugs interact with genes involved in malignant transfromation |
| (DGIdb 4.0) |
| Entrez ID | Symbol | Category | Interaction Types | Drug Claim Name | Drug Name | PMIDs |
| Page: 1 |

Copyright 2023-Present -The University of Texas Health Science Center at Houston |