
|
|||||
|
 | |
| |
| |
| |
| |
| |
|
Gene: SLC25A38 |
Gene summary for SLC25A38 |
| Gene information | Species | Human | Gene symbol | SLC25A38 | Gene ID | 54977 |
| Gene name | solute carrier family 25 member 38 | |
| Gene Alias | SIDBA2 | |
| Cytomap | 3p22.1 | |
| Gene Type | protein-coding | GO ID | GO:0002262 | UniProtAcc | A0A024R2L5 |
Top |
Malignant transformation analysis |
| Identification of the aberrant gene expression in precancerous and cancerous lesions by comparing the gene expression of stem-like cells in diseased tissues with normal stem cells |
| Entrez ID | Symbol | Replicates | Species | Organ | Tissue | Adj P-value | Log2FC | Malignancy |
| 54977 | SLC25A38 | LZE4T | Human | Esophagus | ESCC | 5.92e-08 | 1.23e-01 | 0.0811 |
| 54977 | SLC25A38 | LZE24T | Human | Esophagus | ESCC | 1.21e-08 | 2.94e-01 | 0.0596 |
| 54977 | SLC25A38 | LZE21T | Human | Esophagus | ESCC | 2.54e-02 | 7.32e-02 | 0.0655 |
| 54977 | SLC25A38 | P2T-E | Human | Esophagus | ESCC | 5.62e-18 | 2.29e-01 | 0.1177 |
| 54977 | SLC25A38 | P4T-E | Human | Esophagus | ESCC | 1.73e-16 | 5.06e-01 | 0.1323 |
| 54977 | SLC25A38 | P5T-E | Human | Esophagus | ESCC | 7.28e-15 | 9.74e-02 | 0.1327 |
| 54977 | SLC25A38 | P8T-E | Human | Esophagus | ESCC | 1.81e-20 | 2.26e-01 | 0.0889 |
| 54977 | SLC25A38 | P9T-E | Human | Esophagus | ESCC | 3.62e-10 | 1.99e-01 | 0.1131 |
| 54977 | SLC25A38 | P10T-E | Human | Esophagus | ESCC | 4.37e-20 | 3.63e-01 | 0.116 |
| 54977 | SLC25A38 | P11T-E | Human | Esophagus | ESCC | 9.30e-12 | 3.57e-01 | 0.1426 |
| 54977 | SLC25A38 | P12T-E | Human | Esophagus | ESCC | 3.20e-22 | 6.43e-01 | 0.1122 |
| 54977 | SLC25A38 | P15T-E | Human | Esophagus | ESCC | 3.41e-15 | 2.57e-01 | 0.1149 |
| 54977 | SLC25A38 | P16T-E | Human | Esophagus | ESCC | 1.33e-21 | 2.69e-01 | 0.1153 |
| 54977 | SLC25A38 | P17T-E | Human | Esophagus | ESCC | 1.05e-04 | 2.92e-01 | 0.1278 |
| 54977 | SLC25A38 | P20T-E | Human | Esophagus | ESCC | 1.28e-13 | 2.65e-01 | 0.1124 |
| 54977 | SLC25A38 | P21T-E | Human | Esophagus | ESCC | 7.02e-23 | 3.67e-01 | 0.1617 |
| 54977 | SLC25A38 | P22T-E | Human | Esophagus | ESCC | 4.61e-28 | 2.80e-01 | 0.1236 |
| 54977 | SLC25A38 | P23T-E | Human | Esophagus | ESCC | 6.11e-17 | 4.00e-01 | 0.108 |
| 54977 | SLC25A38 | P24T-E | Human | Esophagus | ESCC | 4.03e-24 | 2.29e-01 | 0.1287 |
| 54977 | SLC25A38 | P26T-E | Human | Esophagus | ESCC | 4.15e-27 | 3.76e-01 | 0.1276 |
| Page: 1 2 3 4 5 |
| Tissue | Expression Dynamics | Abbreviation |
| Esophagus | 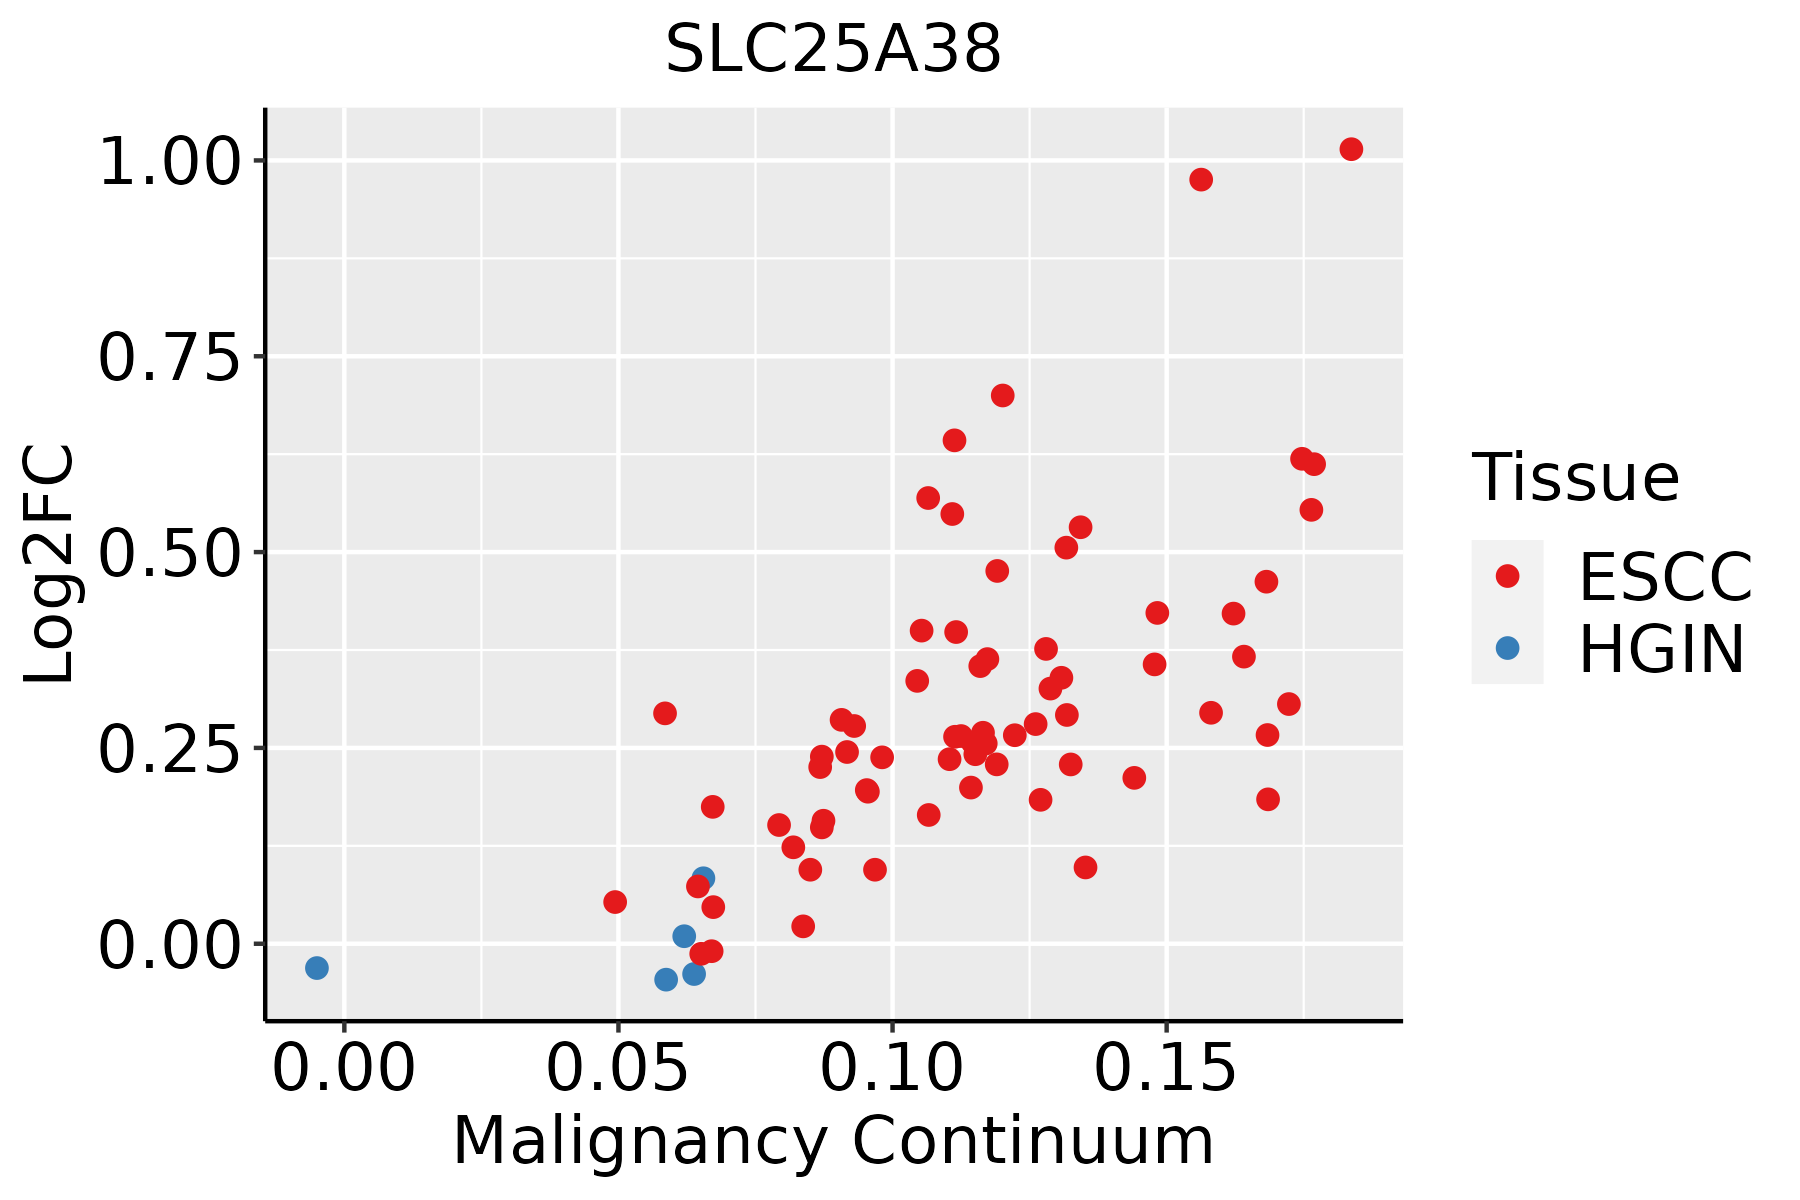 | ESCC: Esophageal squamous cell carcinoma |
| HGIN: High-grade intraepithelial neoplasias | ||
| LGIN: Low-grade intraepithelial neoplasias | ||
| Liver | 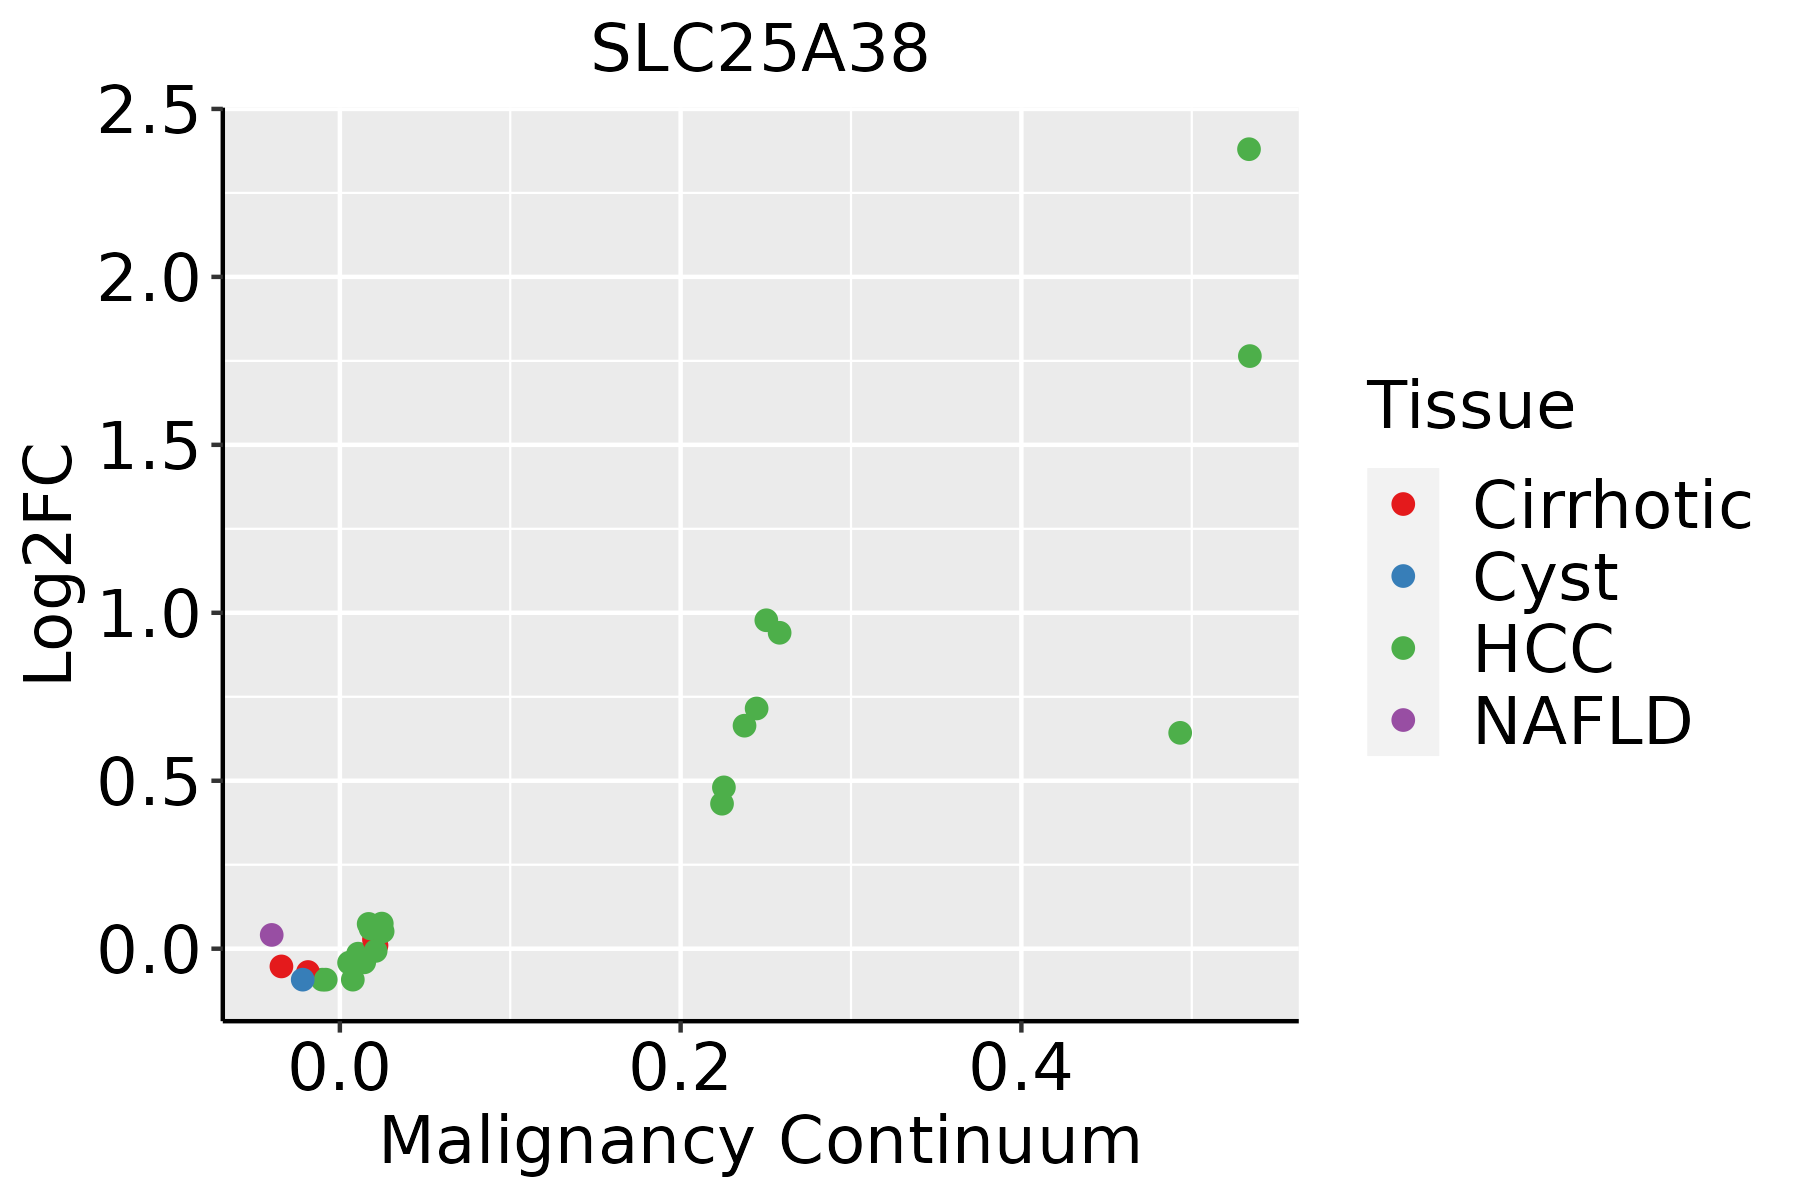 | HCC: Hepatocellular carcinoma |
| NAFLD: Non-alcoholic fatty liver disease | ||
| Oral Cavity | 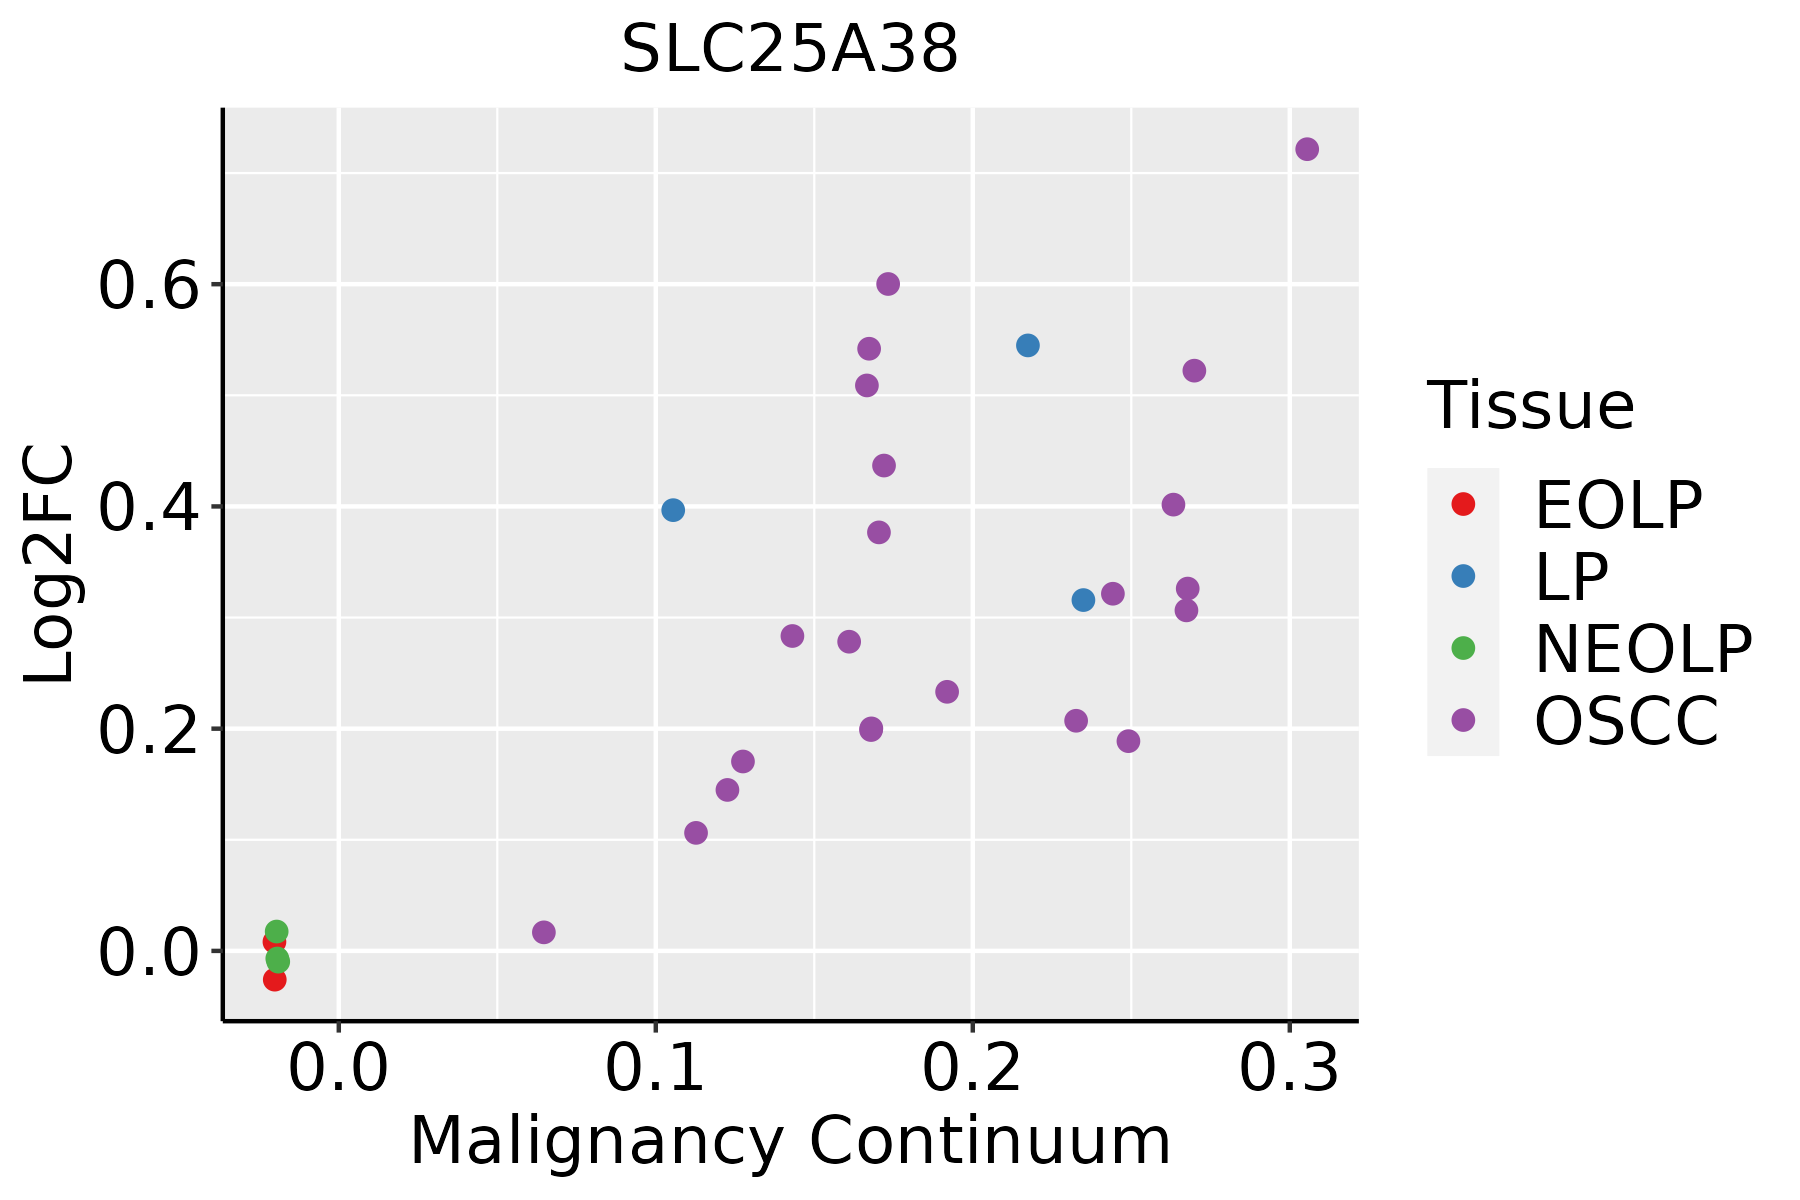 | EOLP: Erosive Oral lichen planus |
| LP: leukoplakia | ||
| NEOLP: Non-erosive oral lichen planus | ||
| OSCC: Oral squamous cell carcinoma | ||
| Prostate | 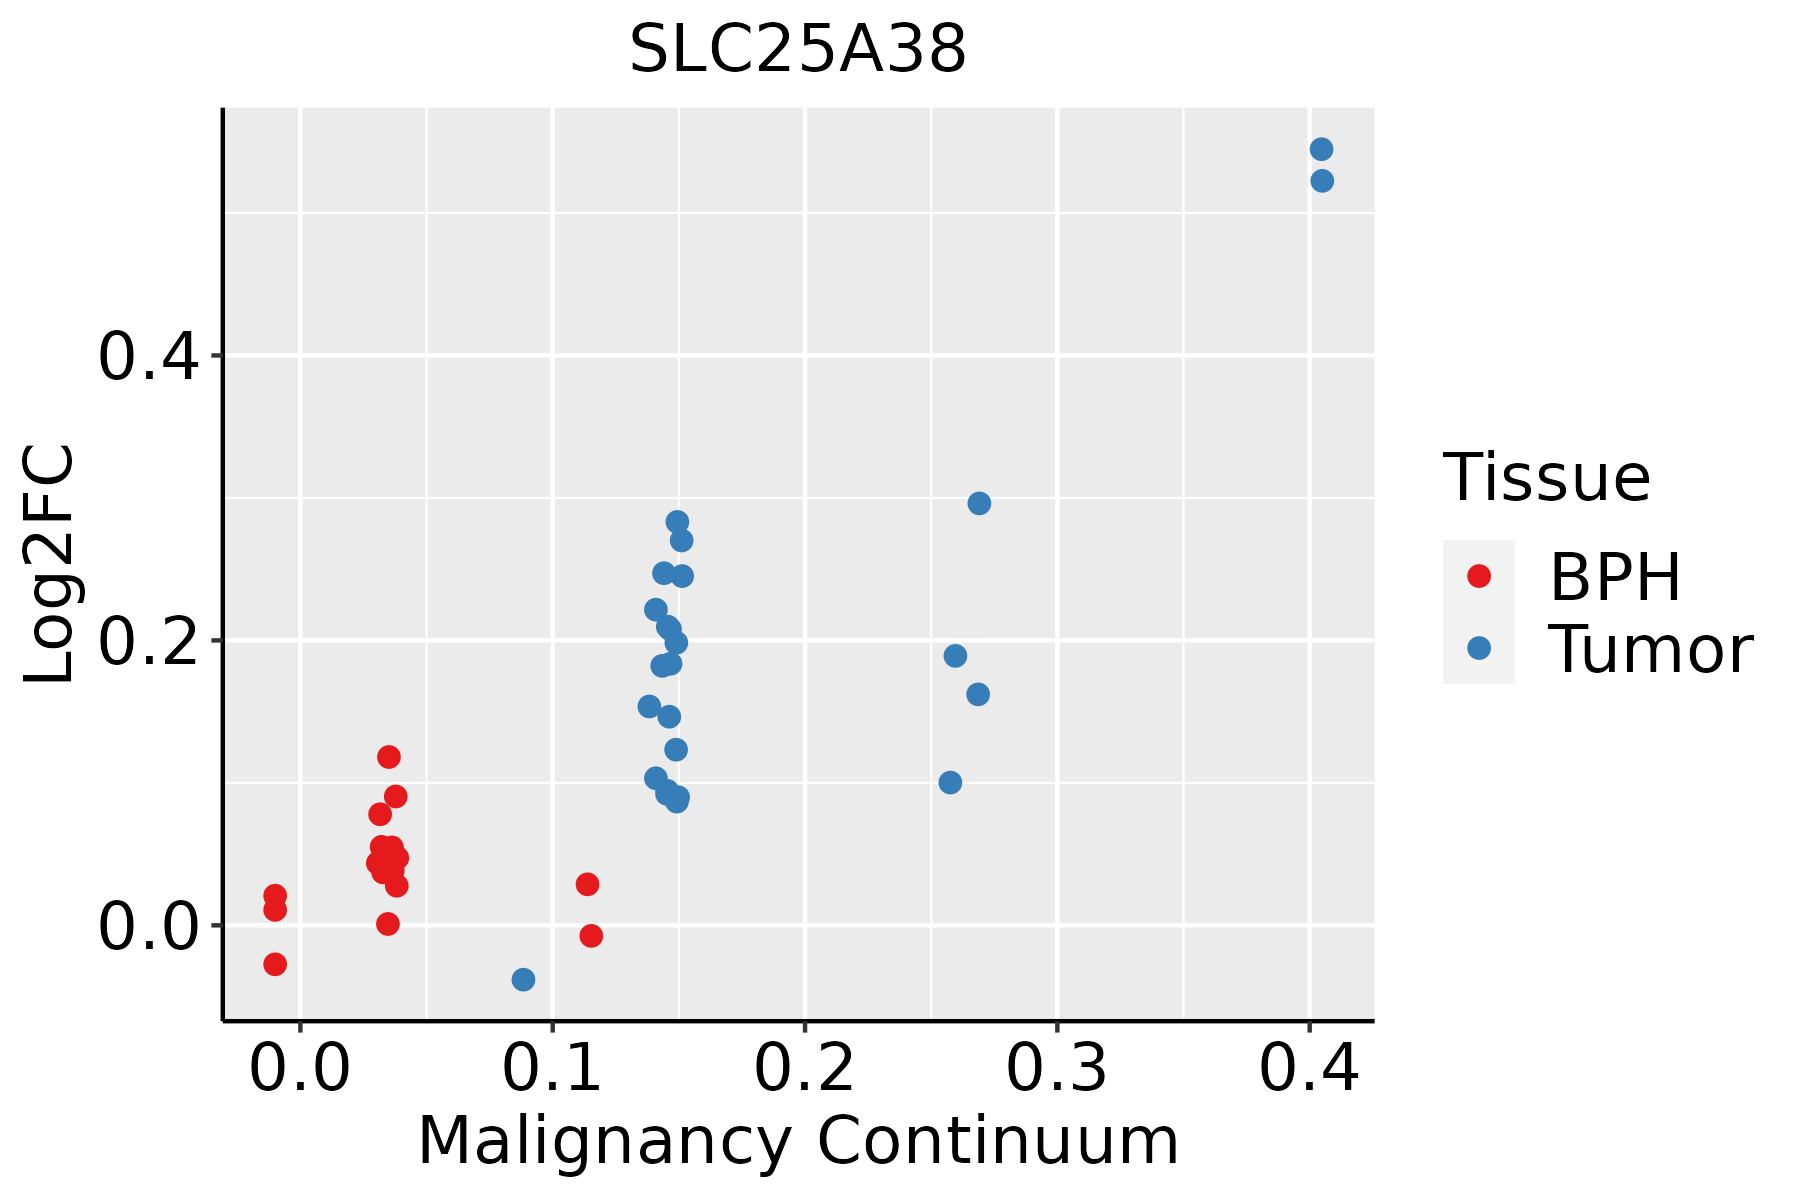 | BPH: Benign Prostatic Hyperplasia |
| ∗log2FC in expression of this searched gene in stem-like cells from each diseased tissue sample relative to stem-like cells in normal samples in each tissue plotted against the malignancy continuum. Samples are colored based on if they are from different disease stage. |
Top |
Malignant transformation related pathway analysis |
| Find out the enriched GO biological processes and KEGG pathways involved in transition from healthy to precancer to cancer |
| Tissue | Disease Stage | Enriched GO biological Processes |
| Colorectum | AD |  |
| Colorectum | SER |  |
| Colorectum | MSS |  |
| Colorectum | MSI-H |  |
| Colorectum | FAP |  |
| ∗Top 15 enriched GO BP terms are showed in the bar plot of each disease state in each tissue. Each row represents a significant GO biological process which is colored according to the -log10(p.adjust). |
| Page: 1 2 3 4 5 6 7 8 9 |
| GO ID | Tissue | Disease Stage | Description | Gene Ratio | Bg Ratio | pvalue | p.adjust | Count |
| GO:0006839110 | Esophagus | ESCC | mitochondrial transport | 187/8552 | 254/18723 | 8.35e-20 | 9.81e-18 | 187 |
| GO:0030099111 | Esophagus | ESCC | myeloid cell differentiation | 232/8552 | 381/18723 | 1.22e-09 | 2.90e-08 | 232 |
| GO:0002262111 | Esophagus | ESCC | myeloid cell homeostasis | 104/8552 | 157/18723 | 1.49e-07 | 2.36e-06 | 104 |
| GO:0034101111 | Esophagus | ESCC | erythrocyte homeostasis | 88/8552 | 129/18723 | 1.81e-07 | 2.84e-06 | 88 |
| GO:1990542110 | Esophagus | ESCC | mitochondrial transmembrane transport | 72/8552 | 102/18723 | 2.94e-07 | 4.23e-06 | 72 |
| GO:0048872111 | Esophagus | ESCC | homeostasis of number of cells | 163/8552 | 272/18723 | 1.40e-06 | 1.69e-05 | 163 |
| GO:0030218111 | Esophagus | ESCC | erythrocyte differentiation | 80/8552 | 120/18723 | 2.69e-06 | 3.08e-05 | 80 |
| GO:00067791 | Esophagus | ESCC | porphyrin-containing compound biosynthetic process | 23/8552 | 31/18723 | 1.20e-03 | 5.88e-03 | 23 |
| GO:00330141 | Esophagus | ESCC | tetrapyrrole biosynthetic process | 23/8552 | 31/18723 | 1.20e-03 | 5.88e-03 | 23 |
| GO:00461482 | Esophagus | ESCC | pigment biosynthetic process | 40/8552 | 62/18723 | 2.14e-03 | 9.54e-03 | 40 |
| GO:00067832 | Esophagus | ESCC | heme biosynthetic process | 20/8552 | 27/18723 | 2.61e-03 | 1.11e-02 | 20 |
| GO:00330132 | Esophagus | ESCC | tetrapyrrole metabolic process | 37/8552 | 59/18723 | 6.23e-03 | 2.29e-02 | 37 |
| GO:00424401 | Esophagus | ESCC | pigment metabolic process | 50/8552 | 84/18723 | 7.34e-03 | 2.64e-02 | 50 |
| GO:00421681 | Esophagus | ESCC | heme metabolic process | 27/8552 | 42/18723 | 1.16e-02 | 3.90e-02 | 27 |
| GO:000683912 | Liver | HCC | mitochondrial transport | 184/7958 | 254/18723 | 2.30e-22 | 3.83e-20 | 184 |
| GO:199054212 | Liver | HCC | mitochondrial transmembrane transport | 78/7958 | 102/18723 | 2.73e-12 | 1.26e-10 | 78 |
| GO:003410122 | Liver | HCC | erythrocyte homeostasis | 79/7958 | 129/18723 | 1.32e-05 | 1.47e-04 | 79 |
| GO:000226222 | Liver | HCC | myeloid cell homeostasis | 93/7958 | 157/18723 | 1.67e-05 | 1.81e-04 | 93 |
| GO:003021812 | Liver | HCC | erythrocyte differentiation | 73/7958 | 120/18723 | 3.82e-05 | 3.80e-04 | 73 |
| GO:003009922 | Liver | HCC | myeloid cell differentiation | 200/7958 | 381/18723 | 4.64e-05 | 4.49e-04 | 200 |
| Page: 1 2 3 |
| Pathway ID | Tissue | Disease Stage | Description | Gene Ratio | Bg Ratio | pvalue | p.adjust | qvalue | Count |
| Page: 1 |
Top |
Cell-cell communication analysis |
| Identification of potential cell-cell interactions between two cell types and their ligand-receptor pairs for different disease states |
| Ligand | Receptor | LRpair | Pathway | Tissue | Disease Stage |
| Page: 1 |
Top |
Single-cell gene regulatory network inference analysis |
| Find out the significant the regulons (TFs) and the target genes of each regulon across cell types for different disease states |
| TF | Cell Type | Tissue | Disease Stage | Target Gene | RSS | Regulon Activity |
| ∗The dot plots of a searched regulon are shown for all cell subpopulations in each disease state of each tissue based on the regulon specific score inferred using pySCENIC and by calculating the average expression. |
| Page: 1 |
Top |
Somatic mutation of malignant transformation related genes |
| Annotation of somatic variants for genes involved in malignant transformation |
| Hugo Symbol | Variant Class | Variant Classification | dbSNP RS | HGVSc | HGVSp | HGVSp Short | SWISSPROT | BIOTYPE | SIFT | PolyPhen | Tumor Sample Barcode | Tissue | Histology | Sex | Age | Stage | Therapy Types | Drugs | Outcome |
| SLC25A38 | SNV | Missense_Mutation | c.767G>A | p.Gly256Asp | p.G256D | Q96DW6 | protein_coding | tolerated(0.21) | benign(0.009) | TCGA-A2-A0D2-01 | Breast | breast invasive carcinoma | Female | <65 | I/II | Chemotherapy | adriamycin | SD | |
| SLC25A38 | SNV | Missense_Mutation | c.49N>A | p.Asp17Asn | p.D17N | Q96DW6 | protein_coding | tolerated_low_confidence(0.12) | benign(0) | TCGA-E2-A1IN-01 | Breast | breast invasive carcinoma | Female | <65 | I/II | Hormone Therapy | arimidex | SD | |
| SLC25A38 | SNV | Missense_Mutation | c.361C>G | p.Pro121Ala | p.P121A | Q96DW6 | protein_coding | deleterious(0.05) | benign(0.444) | TCGA-IR-A3LK-01 | Cervix | cervical & endocervical cancer | Female | >=65 | I/II | Chemotherapy | cisplatin | PD | |
| SLC25A38 | SNV | Missense_Mutation | novel | c.902N>T | p.Gly301Val | p.G301V | Q96DW6 | protein_coding | deleterious(0) | probably_damaging(0.991) | TCGA-NH-A50U-01 | Colorectum | colon adenocarcinoma | Male | <65 | I/II | Ancillary | leucovorin | PD |
| SLC25A38 | SNV | Missense_Mutation | c.94N>A | p.Leu32Met | p.L32M | Q96DW6 | protein_coding | tolerated(0.27) | possibly_damaging(0.517) | TCGA-A5-A0GB-01 | Endometrium | uterine corpus endometrioid carcinoma | Female | >=65 | I/II | Unknown | Unknown | SD | |
| SLC25A38 | SNV | Missense_Mutation | novel | c.236N>C | p.Arg79Pro | p.R79P | Q96DW6 | protein_coding | deleterious(0) | probably_damaging(0.947) | TCGA-A5-A1OH-01 | Endometrium | uterine corpus endometrioid carcinoma | Female | >=65 | III/IV | Chemotherapy | carboplatin | CR |
| SLC25A38 | SNV | Missense_Mutation | rs147819123 | c.235N>T | p.Arg79Cys | p.R79C | Q96DW6 | protein_coding | deleterious(0) | probably_damaging(0.953) | TCGA-A5-A2K5-01 | Endometrium | uterine corpus endometrioid carcinoma | Female | >=65 | I/II | Unknown | Unknown | SD |
| SLC25A38 | SNV | Missense_Mutation | novel | c.236G>A | p.Arg79His | p.R79H | Q96DW6 | protein_coding | deleterious(0) | probably_damaging(0.932) | TCGA-AX-A0J1-01 | Endometrium | uterine corpus endometrioid carcinoma | Female | >=65 | I/II | Unknown | Unknown | SD |
| SLC25A38 | SNV | Missense_Mutation | c.262A>G | p.Lys88Glu | p.K88E | Q96DW6 | protein_coding | deleterious(0) | possibly_damaging(0.794) | TCGA-B5-A0JY-01 | Endometrium | uterine corpus endometrioid carcinoma | Female | <65 | III/IV | Chemotherapy | doxorubicin | SD | |
| SLC25A38 | SNV | Missense_Mutation | rs752103811 | c.307A>C | p.Ile103Leu | p.I103L | Q96DW6 | protein_coding | tolerated(0.52) | benign(0.035) | TCGA-B5-A0JY-01 | Endometrium | uterine corpus endometrioid carcinoma | Female | <65 | III/IV | Chemotherapy | doxorubicin | SD |
| Page: 1 2 3 4 |
Top |
Related drugs of malignant transformation related genes |
| Identification of chemicals and drugs interact with genes involved in malignant transfromation |
| (DGIdb 4.0) |
| Entrez ID | Symbol | Category | Interaction Types | Drug Claim Name | Drug Name | PMIDs |
| Page: 1 |

Copyright 2023-Present -The University of Texas Health Science Center at Houston |