
|
|||||
|
 | |
| |
| |
| |
| |
| |
|
Gene: SLC25A36 |
Gene summary for SLC25A36 |
| Gene information | Species | Human | Gene symbol | SLC25A36 | Gene ID | 55186 |
| Gene name | solute carrier family 25 member 36 | |
| Gene Alias | PNC2 | |
| Cytomap | 3q23 | |
| Gene Type | protein-coding | GO ID | GO:0000002 | UniProtAcc | Q96CQ1 |
Top |
Malignant transformation analysis |
| Identification of the aberrant gene expression in precancerous and cancerous lesions by comparing the gene expression of stem-like cells in diseased tissues with normal stem cells |
| Entrez ID | Symbol | Replicates | Species | Organ | Tissue | Adj P-value | Log2FC | Malignancy |
| 55186 | SLC25A36 | HTA11_3410_2000001011 | Human | Colorectum | AD | 1.37e-18 | -6.21e-01 | 0.0155 |
| 55186 | SLC25A36 | HTA11_2487_2000001011 | Human | Colorectum | SER | 4.24e-05 | -4.91e-01 | -0.1808 |
| 55186 | SLC25A36 | HTA11_78_2000001011 | Human | Colorectum | AD | 5.90e-04 | -3.19e-01 | -0.1088 |
| 55186 | SLC25A36 | HTA11_3361_2000001011 | Human | Colorectum | AD | 4.05e-08 | -6.13e-01 | -0.1207 |
| 55186 | SLC25A36 | HTA11_83_2000001011 | Human | Colorectum | SER | 1.88e-04 | -5.60e-01 | -0.1526 |
| 55186 | SLC25A36 | HTA11_696_2000001011 | Human | Colorectum | AD | 1.48e-28 | -6.25e-01 | -0.1464 |
| 55186 | SLC25A36 | HTA11_866_2000001011 | Human | Colorectum | AD | 4.73e-11 | -4.41e-01 | -0.1001 |
| 55186 | SLC25A36 | HTA11_1391_2000001011 | Human | Colorectum | AD | 2.14e-11 | -5.29e-01 | -0.059 |
| 55186 | SLC25A36 | HTA11_2992_2000001011 | Human | Colorectum | SER | 4.87e-02 | -6.12e-01 | -0.1706 |
| 55186 | SLC25A36 | HTA11_5212_2000001011 | Human | Colorectum | AD | 2.35e-02 | -6.00e-01 | -0.2061 |
| 55186 | SLC25A36 | HTA11_7862_2000001011 | Human | Colorectum | AD | 1.79e-02 | -5.07e-01 | -0.0179 |
| 55186 | SLC25A36 | HTA11_866_3004761011 | Human | Colorectum | AD | 8.60e-10 | -4.95e-01 | 0.096 |
| 55186 | SLC25A36 | HTA11_8622_2000001021 | Human | Colorectum | SER | 2.76e-02 | -5.62e-01 | 0.0528 |
| 55186 | SLC25A36 | HTA11_10711_2000001011 | Human | Colorectum | AD | 1.40e-06 | -5.40e-01 | 0.0338 |
| 55186 | SLC25A36 | HTA11_7696_3000711011 | Human | Colorectum | AD | 7.56e-17 | -5.10e-01 | 0.0674 |
| 55186 | SLC25A36 | HTA11_11156_2000001011 | Human | Colorectum | AD | 1.62e-02 | -7.23e-01 | 0.0397 |
| 55186 | SLC25A36 | HTA11_99999973899_84307 | Human | Colorectum | MSS | 5.08e-03 | -5.24e-01 | 0.2585 |
| 55186 | SLC25A36 | HTA11_99999974143_84620 | Human | Colorectum | MSS | 9.87e-09 | -4.27e-01 | 0.3005 |
| 55186 | SLC25A36 | A002-C-010 | Human | Colorectum | FAP | 3.25e-05 | -2.64e-01 | 0.242 |
| 55186 | SLC25A36 | A001-C-207 | Human | Colorectum | FAP | 1.80e-02 | -1.72e-01 | 0.1278 |
| Page: 1 2 3 4 5 6 7 8 9 10 |
| Tissue | Expression Dynamics | Abbreviation |
| Colorectum (GSE201348) |  | FAP: Familial adenomatous polyposis |
| CRC: Colorectal cancer | ||
| Colorectum (HTA11) |  | AD: Adenomas |
| SER: Sessile serrated lesions | ||
| MSI-H: Microsatellite-high colorectal cancer | ||
| MSS: Microsatellite stable colorectal cancer | ||
| Endometrium | 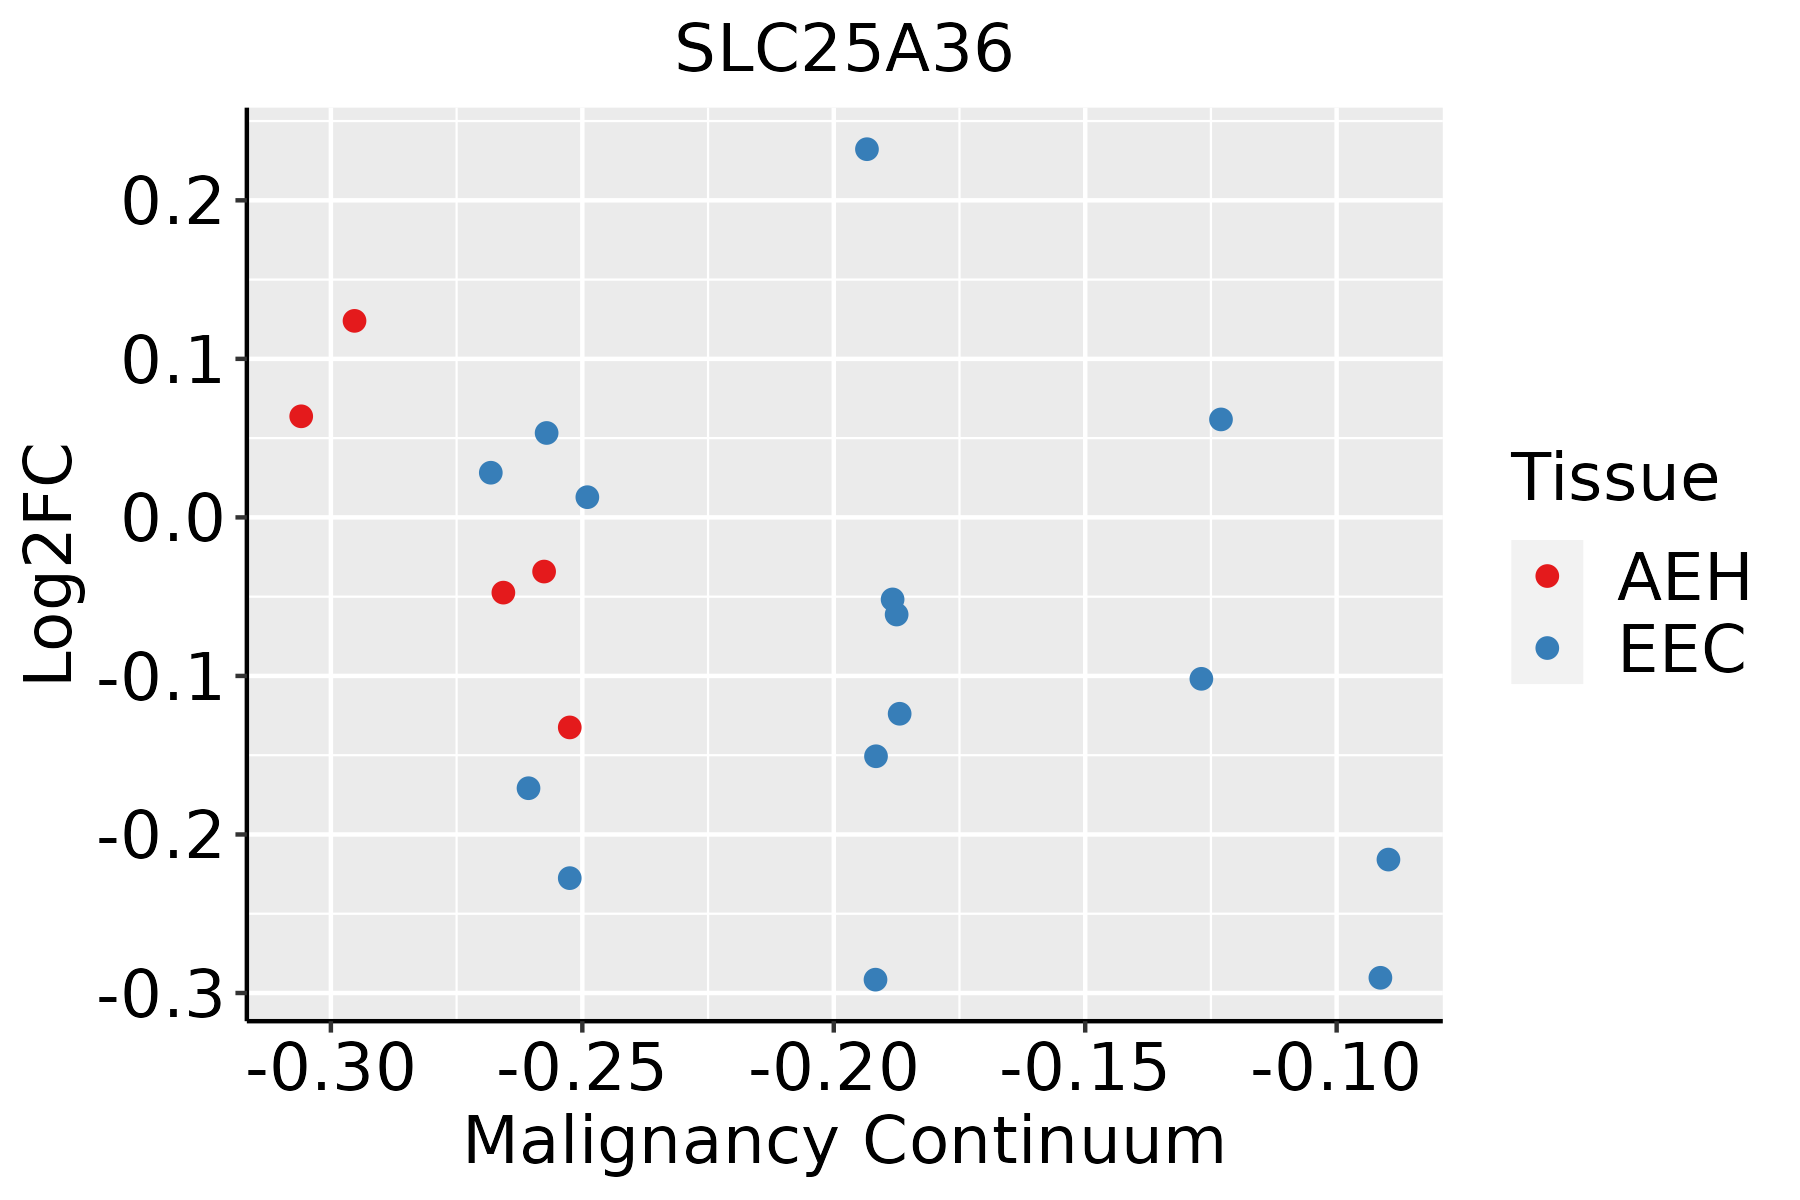 | AEH: Atypical endometrial hyperplasia |
| EEC: Endometrioid Cancer | ||
| Esophagus | 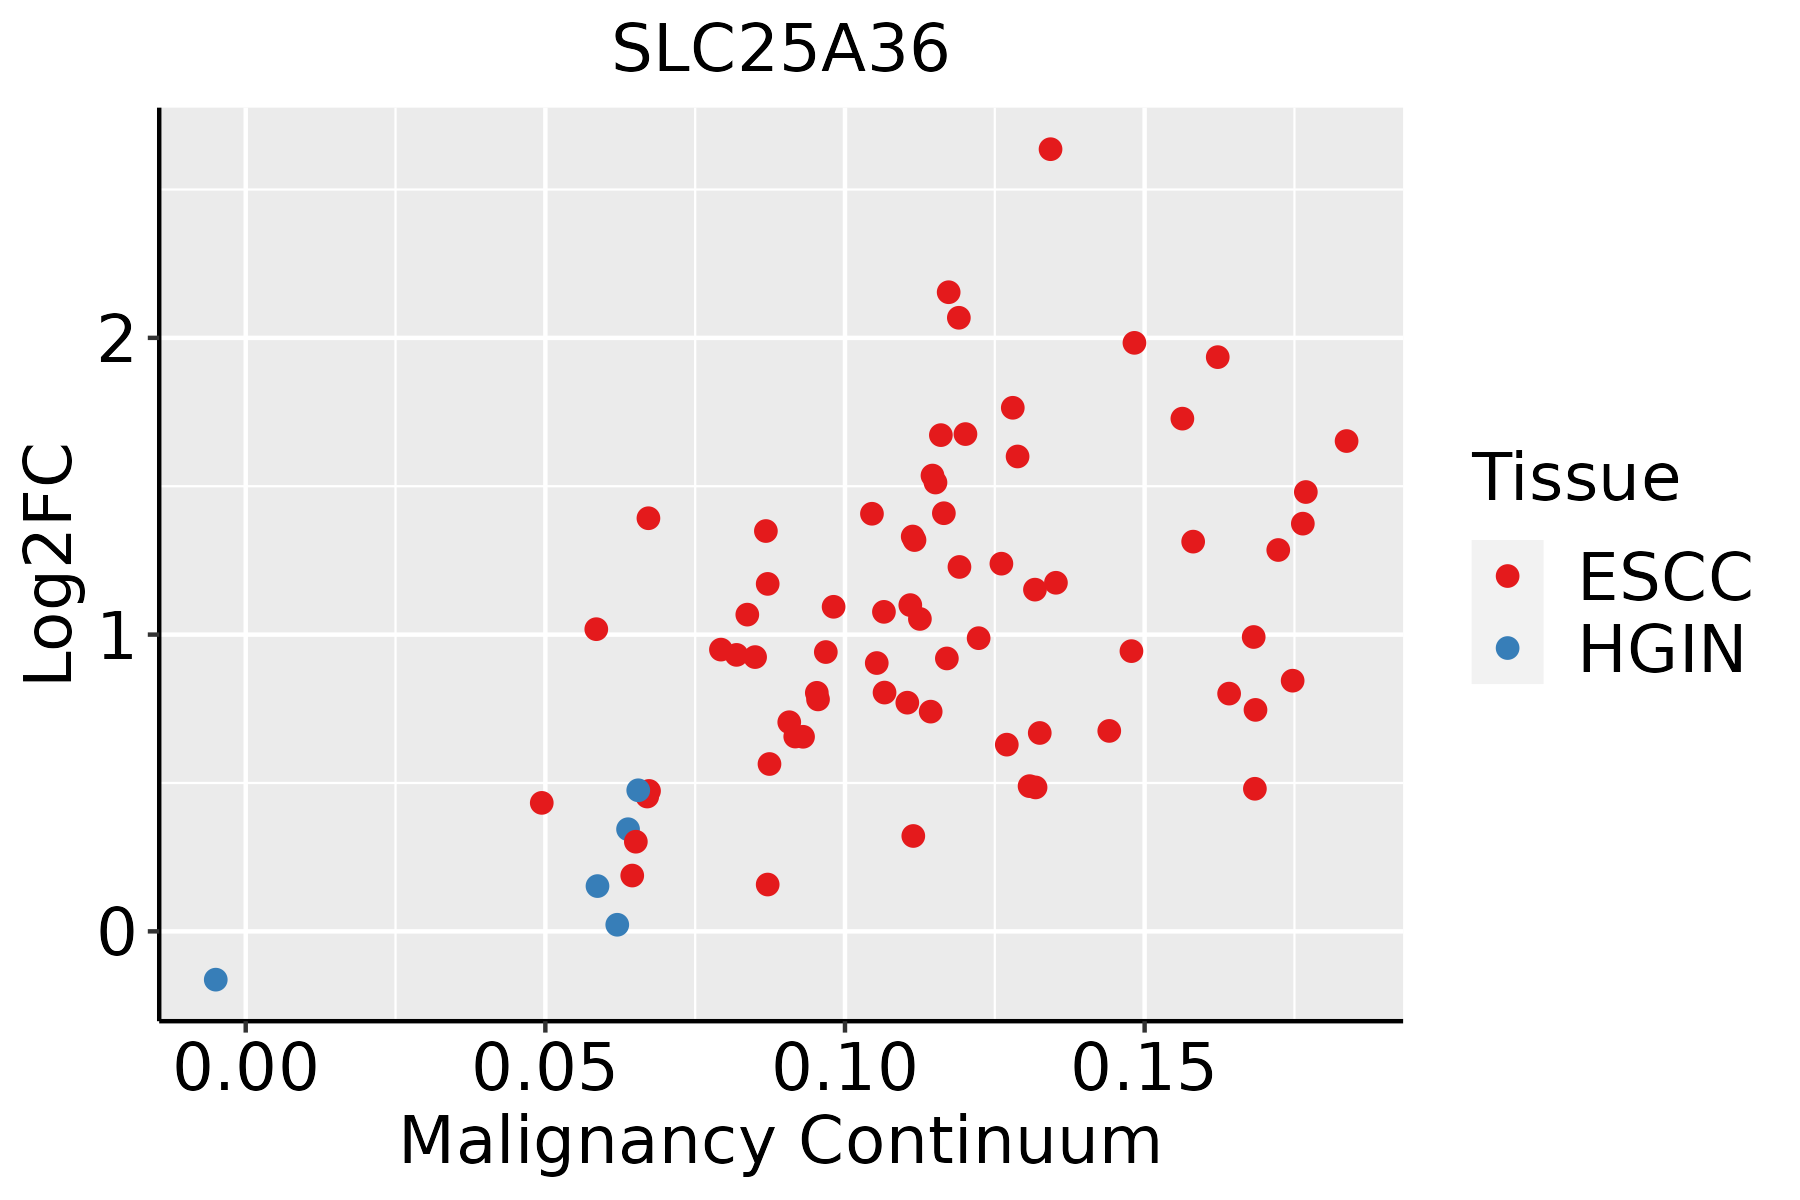 | ESCC: Esophageal squamous cell carcinoma |
| HGIN: High-grade intraepithelial neoplasias | ||
| LGIN: Low-grade intraepithelial neoplasias | ||
| Lung | 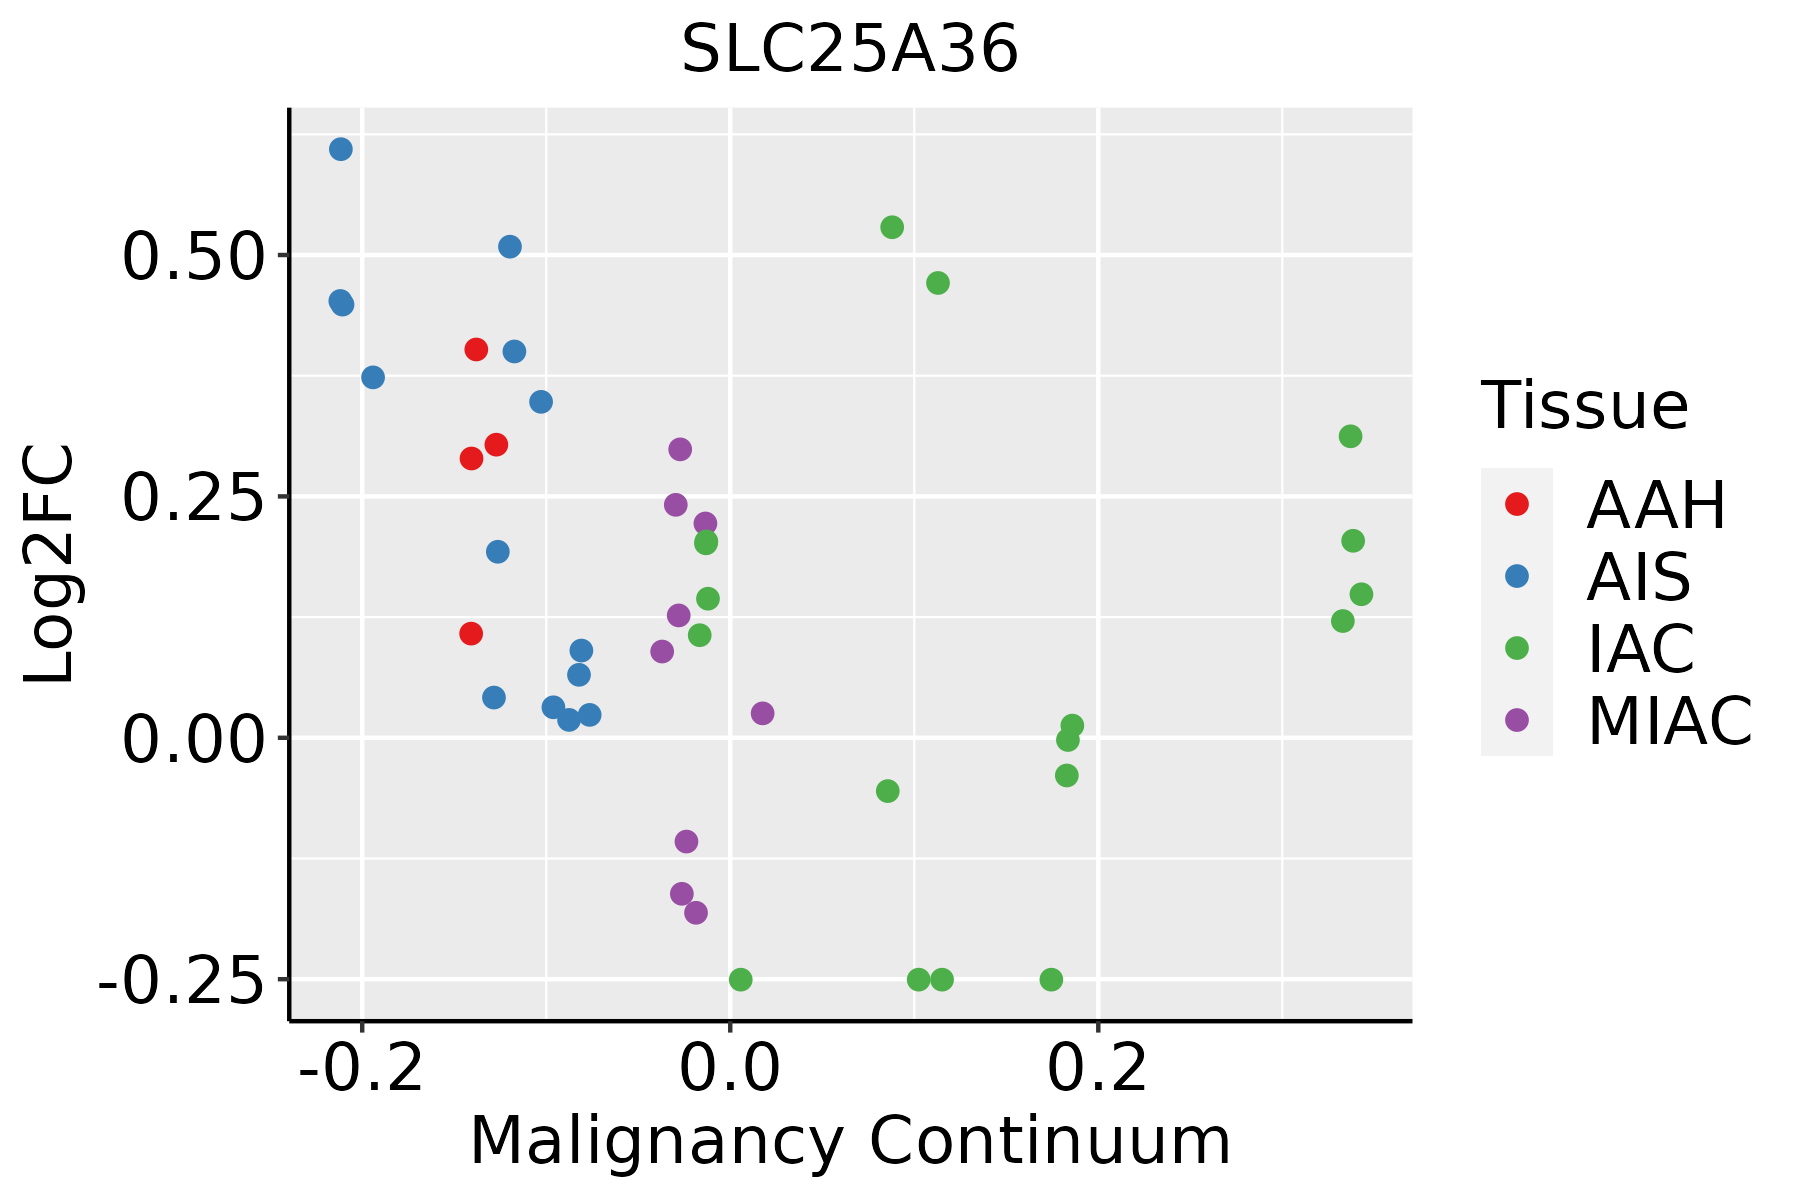 | AAH: Atypical adenomatous hyperplasia |
| AIS: Adenocarcinoma in situ | ||
| IAC: Invasive lung adenocarcinoma | ||
| MIA: Minimally invasive adenocarcinoma | ||
| Oral Cavity | 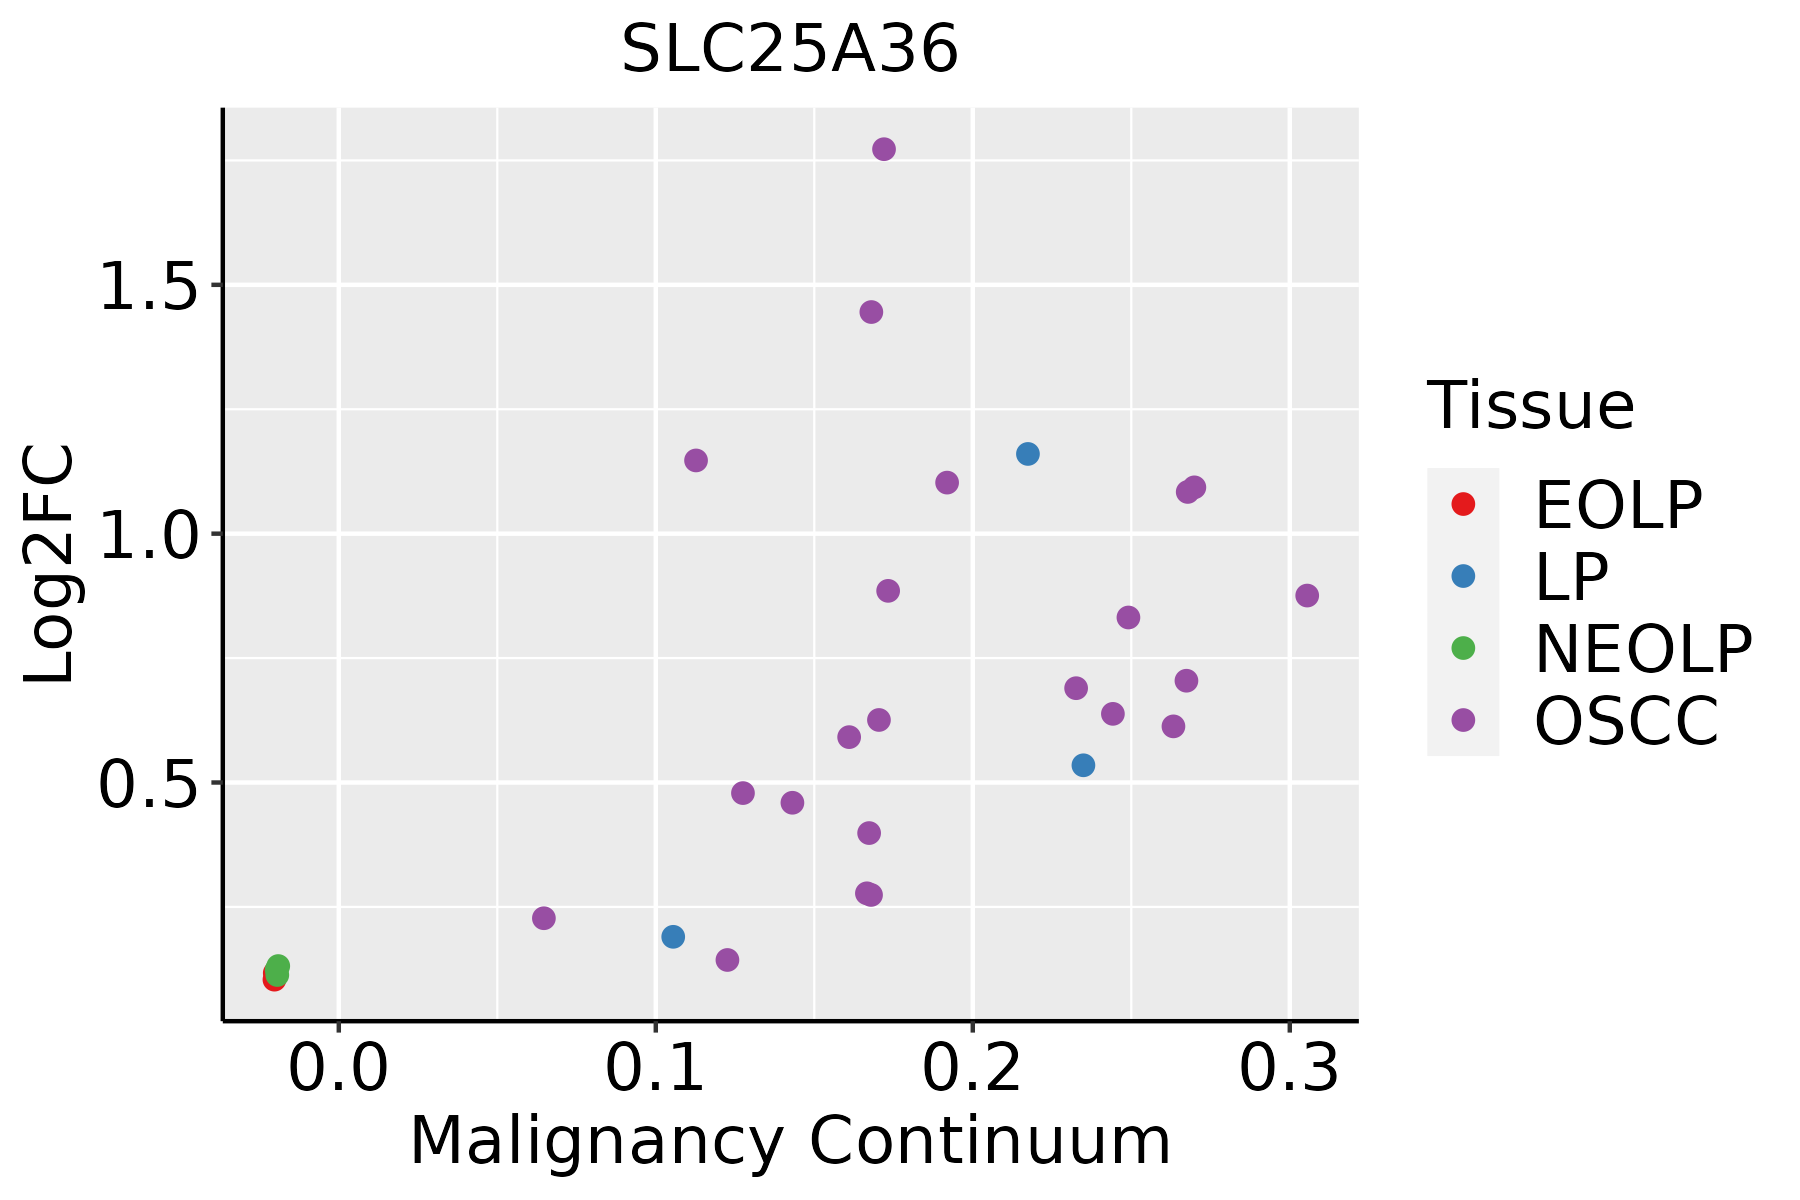 | EOLP: Erosive Oral lichen planus |
| LP: leukoplakia | ||
| NEOLP: Non-erosive oral lichen planus | ||
| OSCC: Oral squamous cell carcinoma | ||
| Prostate |  | BPH: Benign Prostatic Hyperplasia |
| Skin |  | AK: Actinic keratosis |
| cSCC: Cutaneous squamous cell carcinoma | ||
| SCCIS:squamous cell carcinoma in situ | ||
| Thyroid | 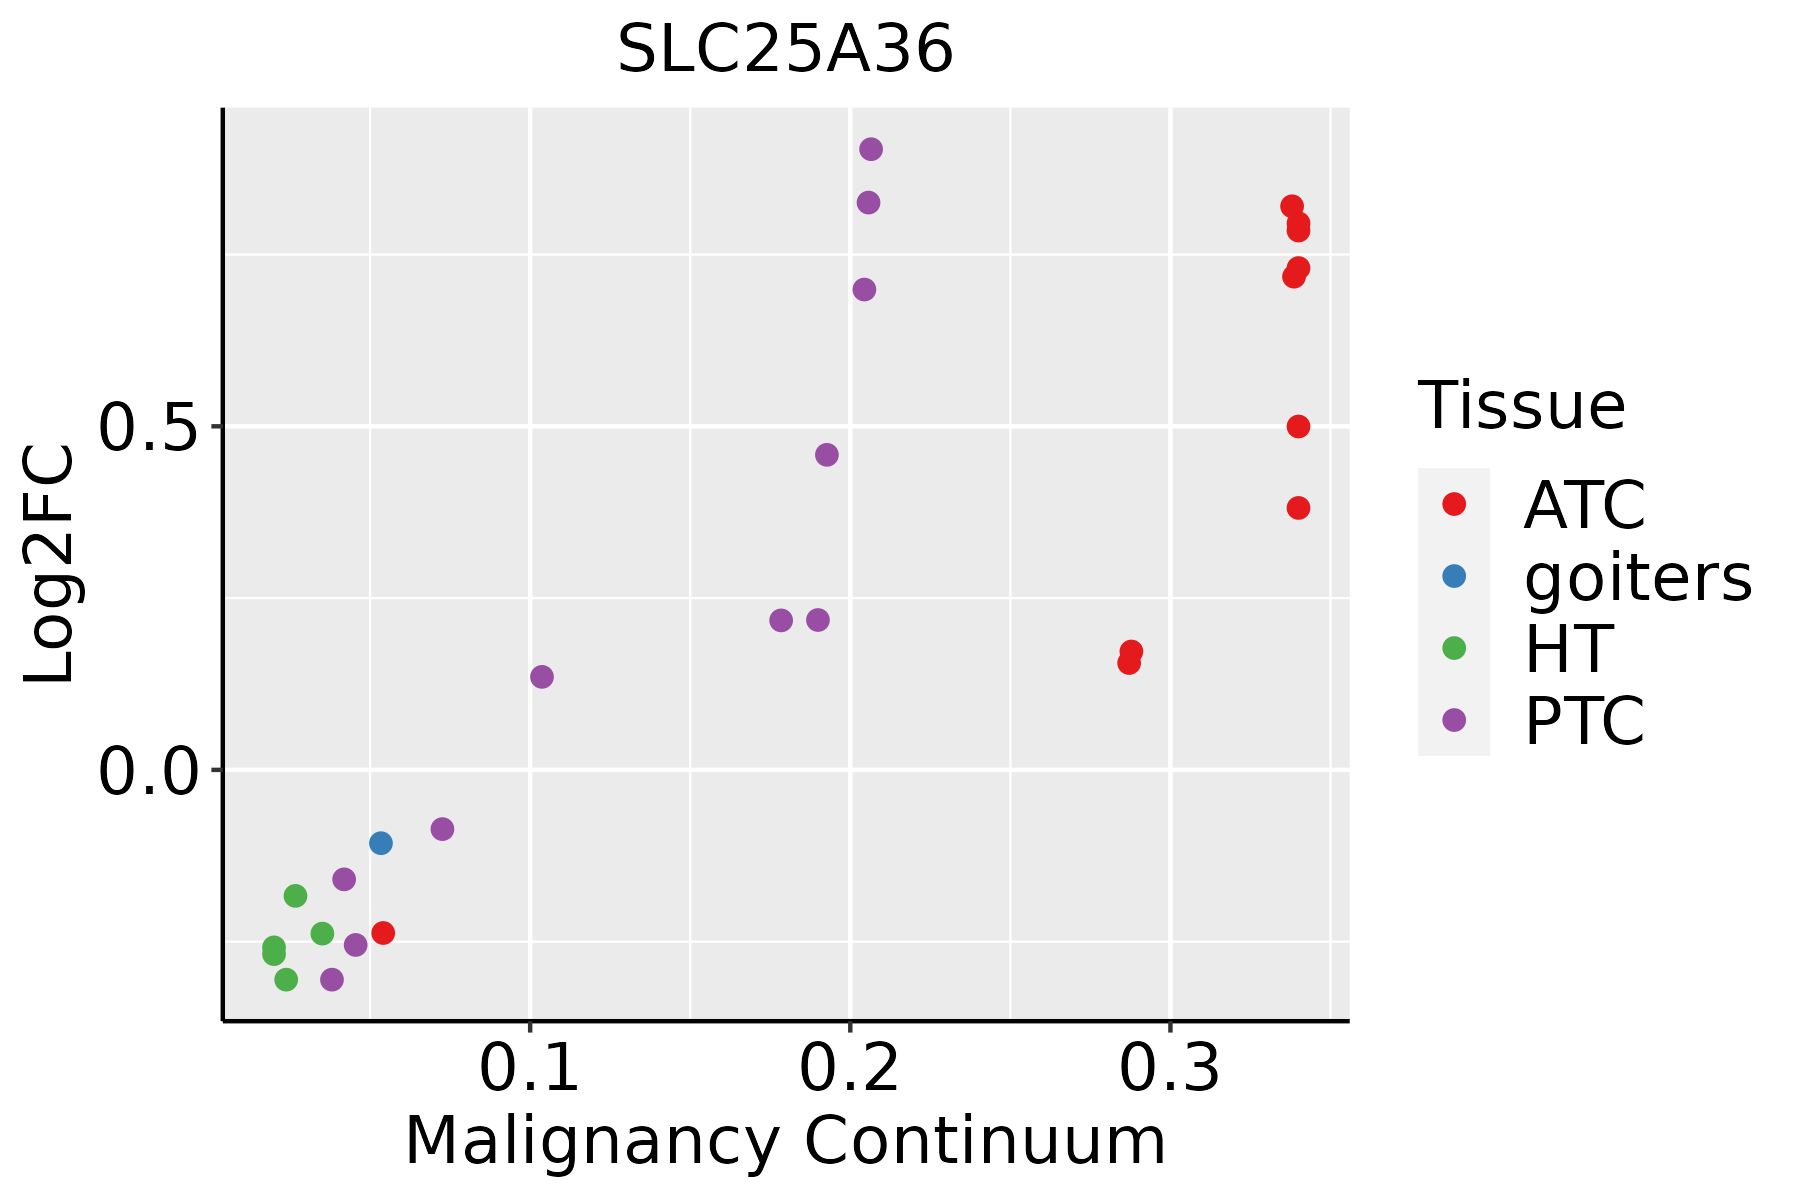 | ATC: Anaplastic thyroid cancer |
| HT: Hashimoto's thyroiditis | ||
| PTC: Papillary thyroid cancer |
| ∗log2FC in expression of this searched gene in stem-like cells from each diseased tissue sample relative to stem-like cells in normal samples in each tissue plotted against the malignancy continuum. Samples are colored based on if they are from different disease stage. |
Top |
Malignant transformation related pathway analysis |
| Find out the enriched GO biological processes and KEGG pathways involved in transition from healthy to precancer to cancer |
| Tissue | Disease Stage | Enriched GO biological Processes |
| Colorectum | AD |  |
| Colorectum | SER |  |
| Colorectum | MSS |  |
| Colorectum | MSI-H |  |
| Colorectum | FAP |  |
| ∗Top 15 enriched GO BP terms are showed in the bar plot of each disease state in each tissue. Each row represents a significant GO biological process which is colored according to the -log10(p.adjust). |
| Page: 1 2 3 4 5 6 7 8 9 |
| GO ID | Tissue | Disease Stage | Description | Gene Ratio | Bg Ratio | pvalue | p.adjust | Count |
| GO:0006839 | Colorectum | AD | mitochondrial transport | 102/3918 | 254/18723 | 1.87e-12 | 3.08e-10 | 102 |
| GO:1990542 | Colorectum | AD | mitochondrial transmembrane transport | 47/3918 | 102/18723 | 1.09e-08 | 6.52e-07 | 47 |
| GO:0015931 | Colorectum | AD | nucleobase-containing compound transport | 73/3918 | 222/18723 | 2.02e-05 | 4.10e-04 | 73 |
| GO:0051881 | Colorectum | AD | regulation of mitochondrial membrane potential | 29/3918 | 74/18723 | 2.54e-04 | 3.20e-03 | 29 |
| GO:0015748 | Colorectum | AD | organophosphate ester transport | 42/3918 | 140/18723 | 7.04e-03 | 4.31e-02 | 42 |
| GO:00068391 | Colorectum | SER | mitochondrial transport | 87/2897 | 254/18723 | 7.91e-14 | 3.03e-11 | 87 |
| GO:19905421 | Colorectum | SER | mitochondrial transmembrane transport | 42/2897 | 102/18723 | 3.65e-10 | 4.77e-08 | 42 |
| GO:00159311 | Colorectum | SER | nucleobase-containing compound transport | 54/2897 | 222/18723 | 3.65e-04 | 5.67e-03 | 54 |
| GO:00518811 | Colorectum | SER | regulation of mitochondrial membrane potential | 22/2897 | 74/18723 | 1.41e-03 | 1.53e-02 | 22 |
| GO:00068392 | Colorectum | MSS | mitochondrial transport | 93/3467 | 254/18723 | 6.14e-12 | 9.82e-10 | 93 |
| GO:19905422 | Colorectum | MSS | mitochondrial transmembrane transport | 41/3467 | 102/18723 | 2.70e-07 | 1.11e-05 | 41 |
| GO:00159312 | Colorectum | MSS | nucleobase-containing compound transport | 70/3467 | 222/18723 | 1.92e-06 | 6.01e-05 | 70 |
| GO:00518812 | Colorectum | MSS | regulation of mitochondrial membrane potential | 25/3467 | 74/18723 | 1.25e-03 | 1.20e-02 | 25 |
| GO:19905423 | Colorectum | FAP | mitochondrial transmembrane transport | 29/2622 | 102/18723 | 1.09e-04 | 1.80e-03 | 29 |
| GO:00068394 | Colorectum | FAP | mitochondrial transport | 55/2622 | 254/18723 | 5.58e-04 | 6.24e-03 | 55 |
| GO:00159314 | Colorectum | FAP | nucleobase-containing compound transport | 45/2622 | 222/18723 | 6.22e-03 | 3.90e-02 | 45 |
| GO:0042391 | Colorectum | CRC | regulation of membrane potential | 67/2078 | 434/18723 | 3.27e-03 | 2.81e-02 | 67 |
| GO:000683910 | Endometrium | AEH | mitochondrial transport | 66/2100 | 254/18723 | 3.55e-11 | 4.96e-09 | 66 |
| GO:19905429 | Endometrium | AEH | mitochondrial transmembrane transport | 31/2100 | 102/18723 | 1.29e-07 | 5.97e-06 | 31 |
| GO:00518817 | Endometrium | AEH | regulation of mitochondrial membrane potential | 24/2100 | 74/18723 | 8.97e-07 | 3.19e-05 | 24 |
| Page: 1 2 3 4 |
| Pathway ID | Tissue | Disease Stage | Description | Gene Ratio | Bg Ratio | pvalue | p.adjust | qvalue | Count |
| Page: 1 |
Top |
Cell-cell communication analysis |
| Identification of potential cell-cell interactions between two cell types and their ligand-receptor pairs for different disease states |
| Ligand | Receptor | LRpair | Pathway | Tissue | Disease Stage |
| Page: 1 |
Top |
Single-cell gene regulatory network inference analysis |
| Find out the significant the regulons (TFs) and the target genes of each regulon across cell types for different disease states |
| TF | Cell Type | Tissue | Disease Stage | Target Gene | RSS | Regulon Activity |
| ∗The dot plots of a searched regulon are shown for all cell subpopulations in each disease state of each tissue based on the regulon specific score inferred using pySCENIC and by calculating the average expression. |
| Page: 1 |
Top |
Somatic mutation of malignant transformation related genes |
| Annotation of somatic variants for genes involved in malignant transformation |
| Hugo Symbol | Variant Class | Variant Classification | dbSNP RS | HGVSc | HGVSp | HGVSp Short | SWISSPROT | BIOTYPE | SIFT | PolyPhen | Tumor Sample Barcode | Tissue | Histology | Sex | Age | Stage | Therapy Types | Drugs | Outcome |
| SLC25A36 | SNV | Missense_Mutation | c.169N>G | p.Asn57Asp | p.N57D | Q96CQ1 | protein_coding | tolerated(0.64) | benign(0.061) | TCGA-AR-A24M-01 | Breast | breast invasive carcinoma | Female | <65 | III/IV | Hormone Therapy | tamoxiphen | SD | |
| SLC25A36 | SNV | Missense_Mutation | c.592N>C | p.Glu198Gln | p.E198Q | Q96CQ1 | protein_coding | deleterious(0) | probably_damaging(0.998) | TCGA-JW-A5VL-01 | Cervix | cervical & endocervical cancer | Female | <65 | I/II | Unknown | Unknown | SD | |
| SLC25A36 | SNV | Missense_Mutation | c.722N>T | p.Thr241Ile | p.T241I | Q96CQ1 | protein_coding | tolerated(0.1) | probably_damaging(0.998) | TCGA-AA-3710-01 | Colorectum | colon adenocarcinoma | Female | >=65 | I/II | Unknown | Unknown | SD | |
| SLC25A36 | SNV | Missense_Mutation | novel | c.385N>T | p.Gly129Cys | p.G129C | Q96CQ1 | protein_coding | deleterious(0) | benign(0.144) | TCGA-AZ-6601-01 | Colorectum | colon adenocarcinoma | Male | >=65 | I/II | Unknown | Unknown | PD |
| SLC25A36 | SNV | Missense_Mutation | novel | c.251N>G | p.Leu84Arg | p.L84R | Q96CQ1 | protein_coding | deleterious(0) | probably_damaging(0.999) | TCGA-CA-6717-01 | Colorectum | colon adenocarcinoma | Male | <65 | I/II | Chemotherapy | oxaliplatin | CR |
| SLC25A36 | SNV | Missense_Mutation | novel | c.788N>A | p.Ser263Tyr | p.S263Y | Q96CQ1 | protein_coding | deleterious(0.05) | possibly_damaging(0.863) | TCGA-CA-6717-01 | Colorectum | colon adenocarcinoma | Male | <65 | I/II | Chemotherapy | oxaliplatin | CR |
| SLC25A36 | deletion | Frame_Shift_Del | novel | c.522delA | p.Gly175AspfsTer26 | p.G175Dfs*26 | Q96CQ1 | protein_coding | TCGA-AA-3950-01 | Colorectum | colon adenocarcinoma | Female | >=65 | I/II | Unknown | Unknown | SD | ||
| SLC25A36 | SNV | Missense_Mutation | c.493N>T | p.Arg165Cys | p.R165C | Q96CQ1 | protein_coding | deleterious(0) | probably_damaging(0.94) | TCGA-A5-A0G2-01 | Endometrium | uterine corpus endometrioid carcinoma | Female | <65 | III/IV | Unknown | Unknown | SD | |
| SLC25A36 | SNV | Missense_Mutation | novel | c.848N>C | p.Gly283Ala | p.G283A | Q96CQ1 | protein_coding | deleterious(0) | probably_damaging(0.995) | TCGA-A5-A0G2-01 | Endometrium | uterine corpus endometrioid carcinoma | Female | <65 | III/IV | Unknown | Unknown | SD |
| SLC25A36 | SNV | Missense_Mutation | novel | c.628N>A | p.Ala210Thr | p.A210T | Q96CQ1 | protein_coding | tolerated(0.37) | benign(0.001) | TCGA-A5-A1OF-01 | Endometrium | uterine corpus endometrioid carcinoma | Female | <65 | I/II | Unknown | Unknown | SD |
| Page: 1 2 3 |
Top |
Related drugs of malignant transformation related genes |
| Identification of chemicals and drugs interact with genes involved in malignant transfromation |
| (DGIdb 4.0) |
| Entrez ID | Symbol | Category | Interaction Types | Drug Claim Name | Drug Name | PMIDs |
| Page: 1 |

Copyright 2023-Present -The University of Texas Health Science Center at Houston |