
|
|||||
|
 | |
| |
| |
| |
| |
| |
|
Gene: SLC25A33 |
Gene summary for SLC25A33 |
| Gene information | Species | Human | Gene symbol | SLC25A33 | Gene ID | 84275 |
| Gene name | solute carrier family 25 member 33 | |
| Gene Alias | BMSC-MCP | |
| Cytomap | 1p36.22 | |
| Gene Type | protein-coding | GO ID | GO:0000002 | UniProtAcc | Q9BSK2 |
Top |
Malignant transformation analysis |
| Identification of the aberrant gene expression in precancerous and cancerous lesions by comparing the gene expression of stem-like cells in diseased tissues with normal stem cells |
| Entrez ID | Symbol | Replicates | Species | Organ | Tissue | Adj P-value | Log2FC | Malignancy |
| 84275 | SLC25A33 | LZE20T | Human | Esophagus | ESCC | 8.45e-09 | 1.54e-01 | 0.0662 |
| 84275 | SLC25A33 | LZE24T | Human | Esophagus | ESCC | 1.33e-24 | 1.00e+00 | 0.0596 |
| 84275 | SLC25A33 | LZE21T | Human | Esophagus | ESCC | 3.20e-02 | 2.91e-01 | 0.0655 |
| 84275 | SLC25A33 | P1T-E | Human | Esophagus | ESCC | 1.54e-10 | 7.55e-01 | 0.0875 |
| 84275 | SLC25A33 | P2T-E | Human | Esophagus | ESCC | 2.77e-63 | 1.12e+00 | 0.1177 |
| 84275 | SLC25A33 | P4T-E | Human | Esophagus | ESCC | 4.05e-40 | 1.21e+00 | 0.1323 |
| 84275 | SLC25A33 | P5T-E | Human | Esophagus | ESCC | 5.33e-37 | 8.80e-01 | 0.1327 |
| 84275 | SLC25A33 | P8T-E | Human | Esophagus | ESCC | 1.61e-20 | 4.26e-01 | 0.0889 |
| 84275 | SLC25A33 | P9T-E | Human | Esophagus | ESCC | 7.49e-17 | 4.82e-01 | 0.1131 |
| 84275 | SLC25A33 | P10T-E | Human | Esophagus | ESCC | 3.18e-48 | 9.15e-01 | 0.116 |
| 84275 | SLC25A33 | P11T-E | Human | Esophagus | ESCC | 2.05e-14 | 9.69e-01 | 0.1426 |
| 84275 | SLC25A33 | P12T-E | Human | Esophagus | ESCC | 2.63e-47 | 9.88e-01 | 0.1122 |
| 84275 | SLC25A33 | P15T-E | Human | Esophagus | ESCC | 1.58e-31 | 8.31e-01 | 0.1149 |
| 84275 | SLC25A33 | P16T-E | Human | Esophagus | ESCC | 7.27e-34 | 5.80e-01 | 0.1153 |
| 84275 | SLC25A33 | P17T-E | Human | Esophagus | ESCC | 2.88e-05 | 3.31e-01 | 0.1278 |
| 84275 | SLC25A33 | P19T-E | Human | Esophagus | ESCC | 3.08e-05 | 3.94e-01 | 0.1662 |
| 84275 | SLC25A33 | P20T-E | Human | Esophagus | ESCC | 5.41e-36 | 9.93e-01 | 0.1124 |
| 84275 | SLC25A33 | P21T-E | Human | Esophagus | ESCC | 7.36e-28 | 6.15e-01 | 0.1617 |
| 84275 | SLC25A33 | P22T-E | Human | Esophagus | ESCC | 3.53e-20 | 4.02e-01 | 0.1236 |
| 84275 | SLC25A33 | P23T-E | Human | Esophagus | ESCC | 2.68e-36 | 1.07e+00 | 0.108 |
| Page: 1 2 3 4 5 |
| Tissue | Expression Dynamics | Abbreviation |
| Esophagus | 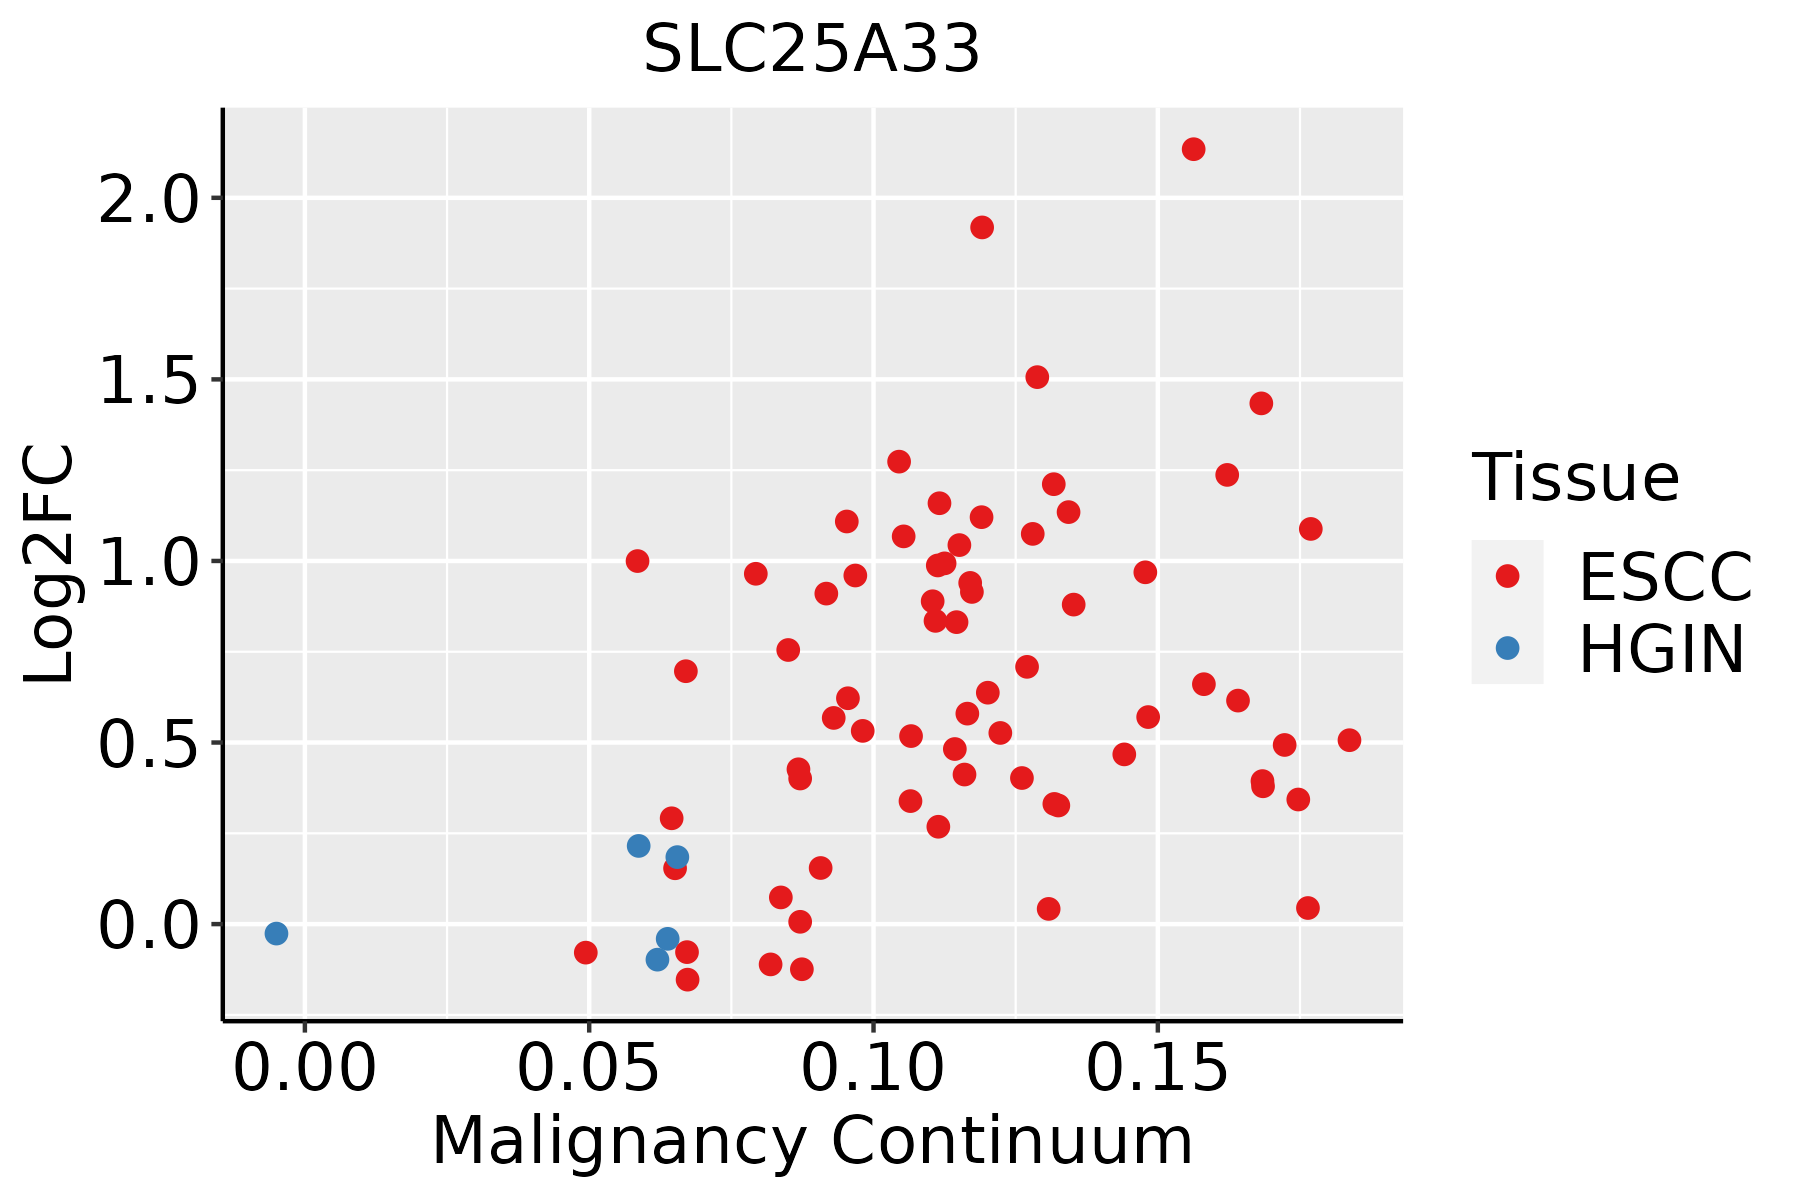 | ESCC: Esophageal squamous cell carcinoma |
| HGIN: High-grade intraepithelial neoplasias | ||
| LGIN: Low-grade intraepithelial neoplasias | ||
| Liver | 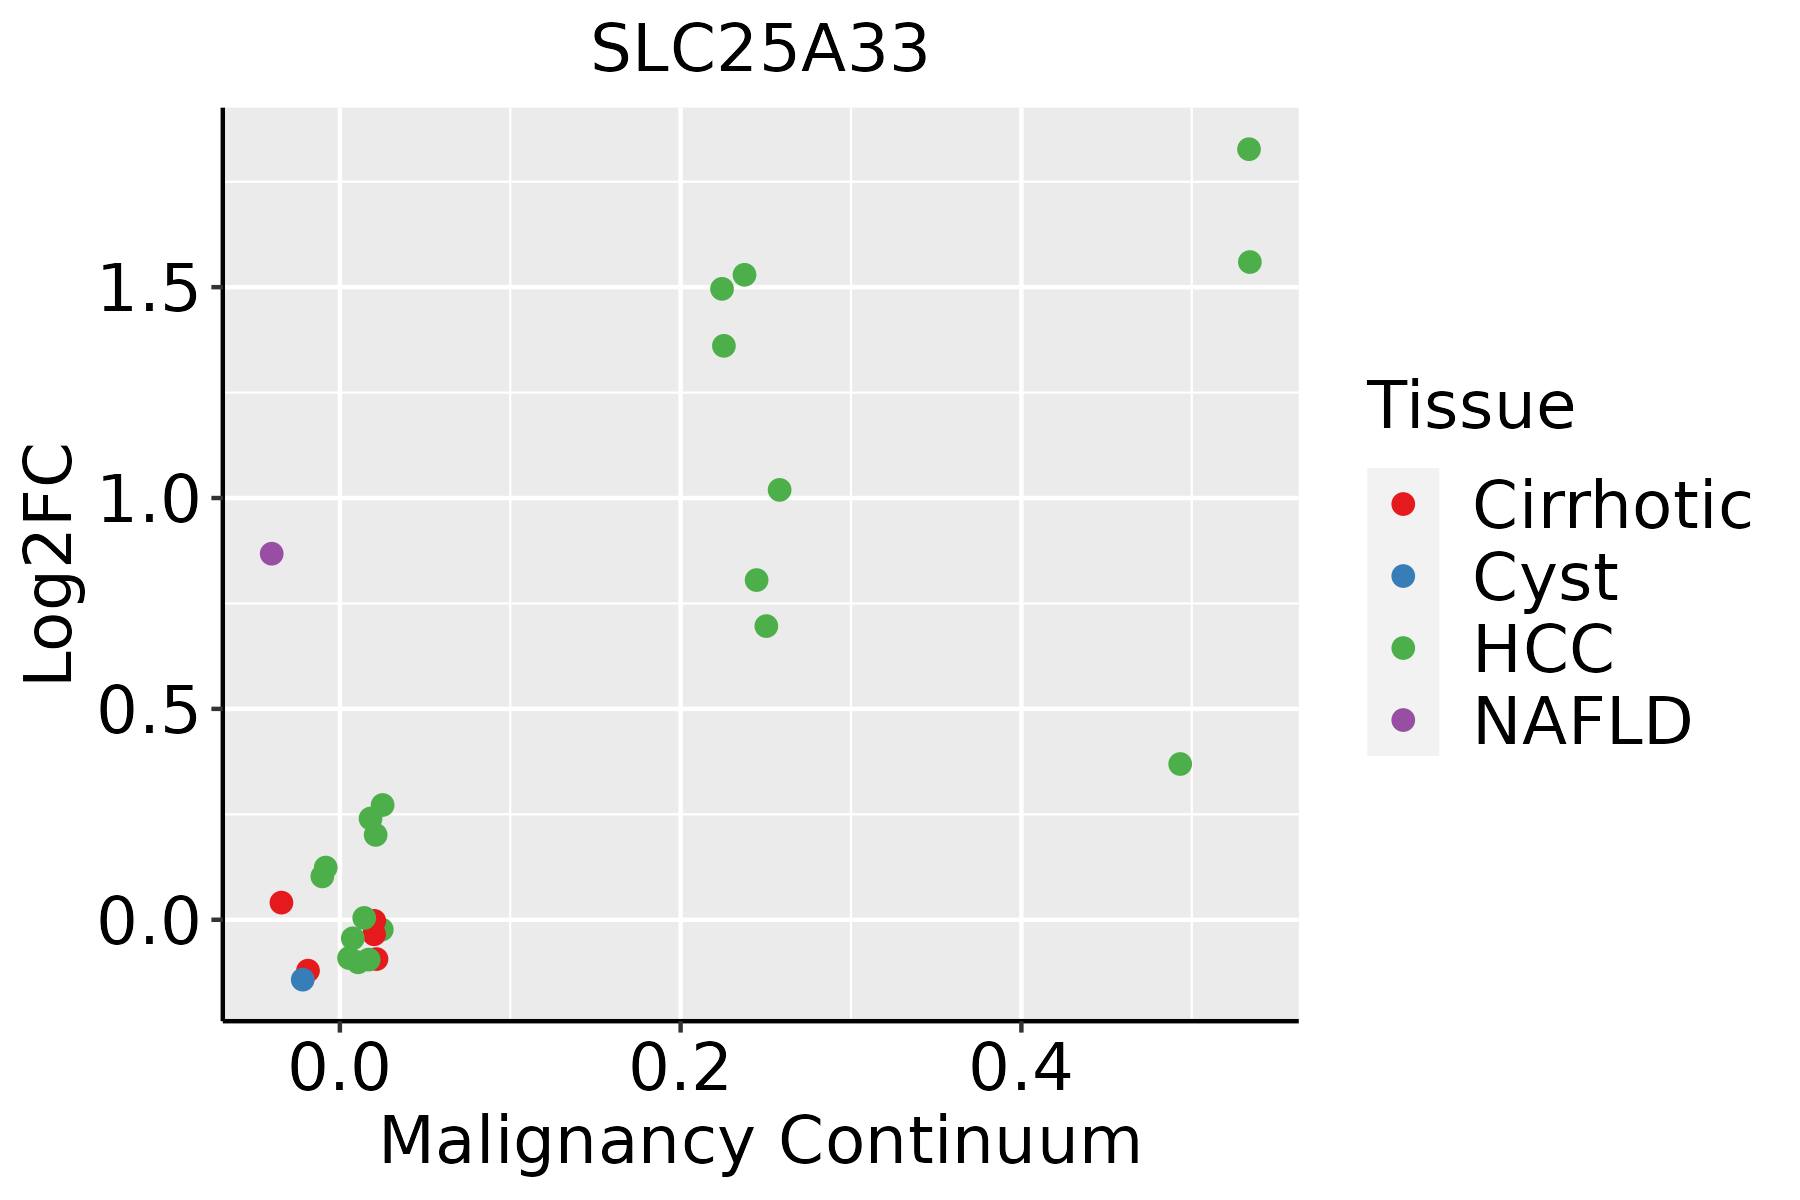 | HCC: Hepatocellular carcinoma |
| NAFLD: Non-alcoholic fatty liver disease | ||
| Lung |  | AAH: Atypical adenomatous hyperplasia |
| AIS: Adenocarcinoma in situ | ||
| IAC: Invasive lung adenocarcinoma | ||
| MIA: Minimally invasive adenocarcinoma | ||
| Oral Cavity | 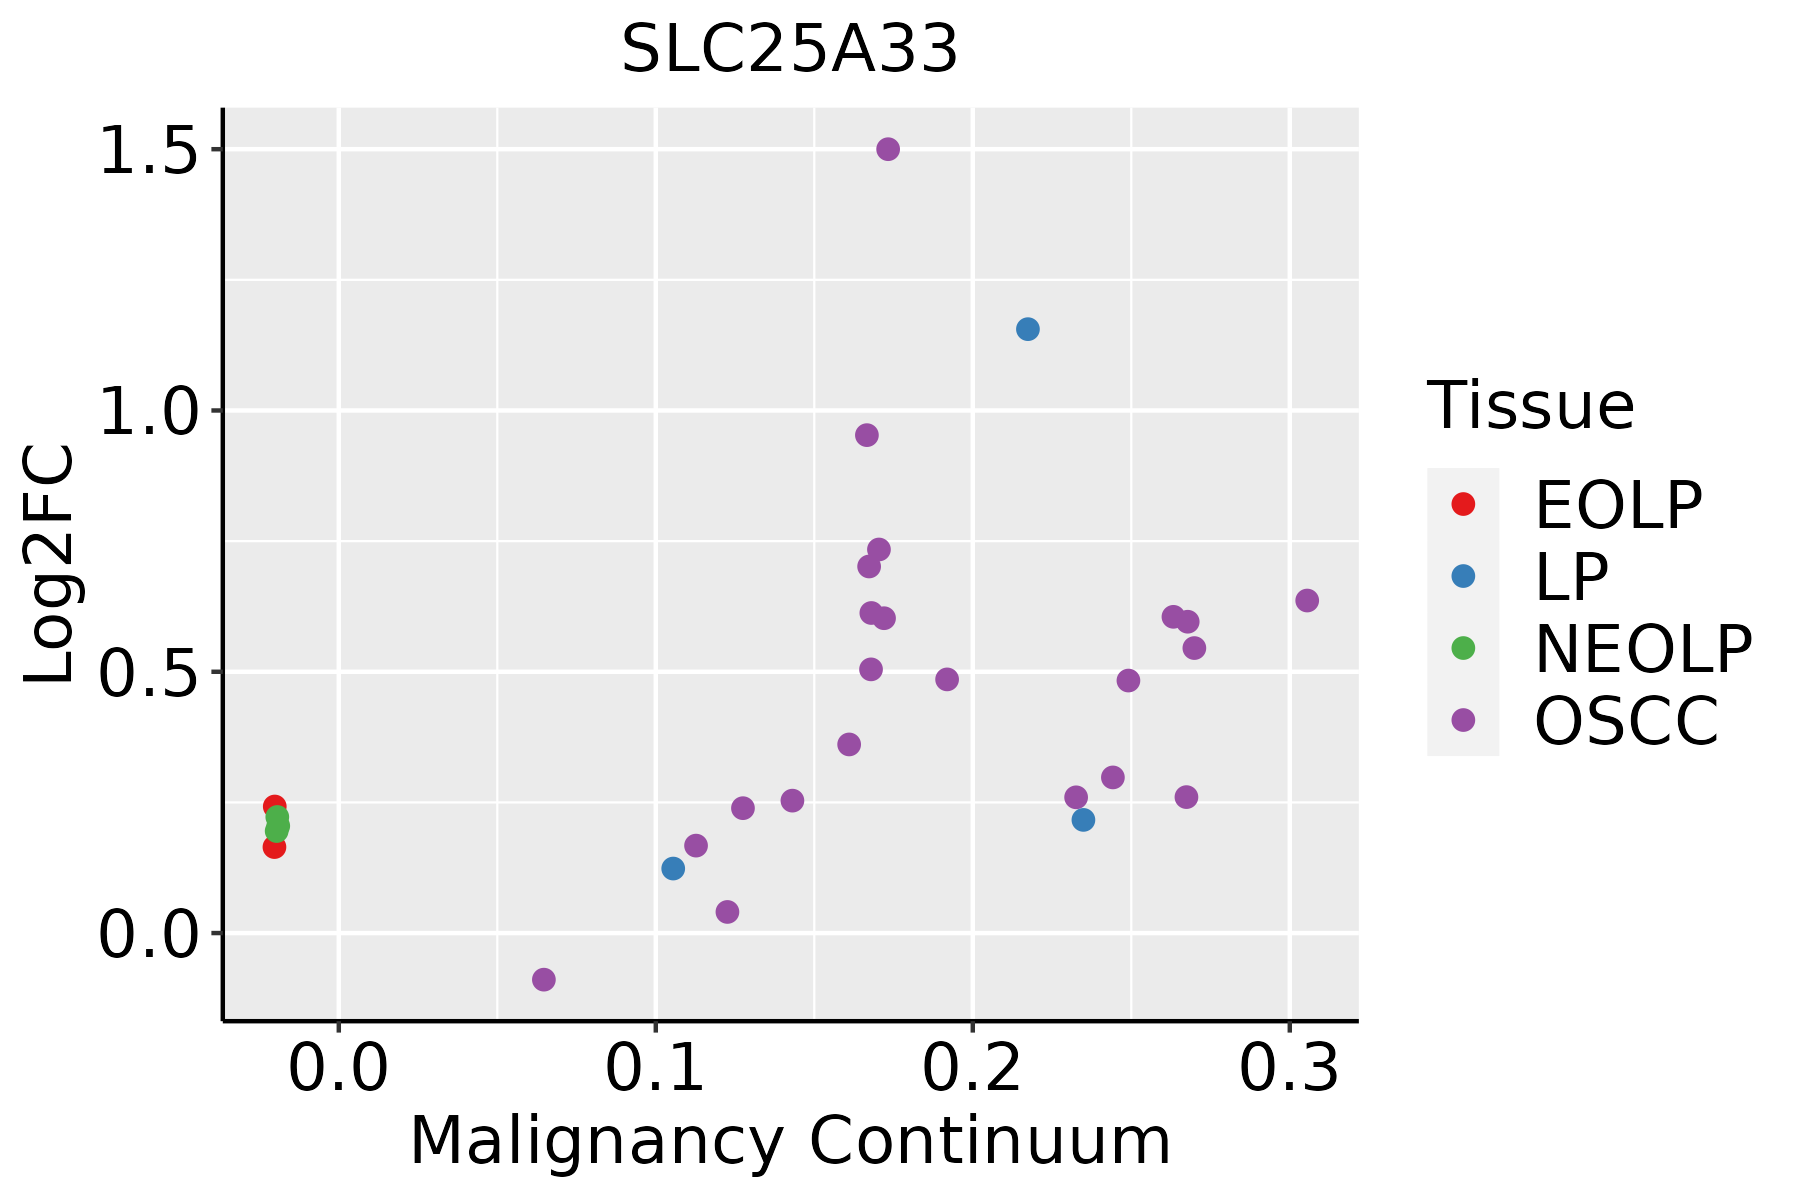 | EOLP: Erosive Oral lichen planus |
| LP: leukoplakia | ||
| NEOLP: Non-erosive oral lichen planus | ||
| OSCC: Oral squamous cell carcinoma | ||
| Prostate | 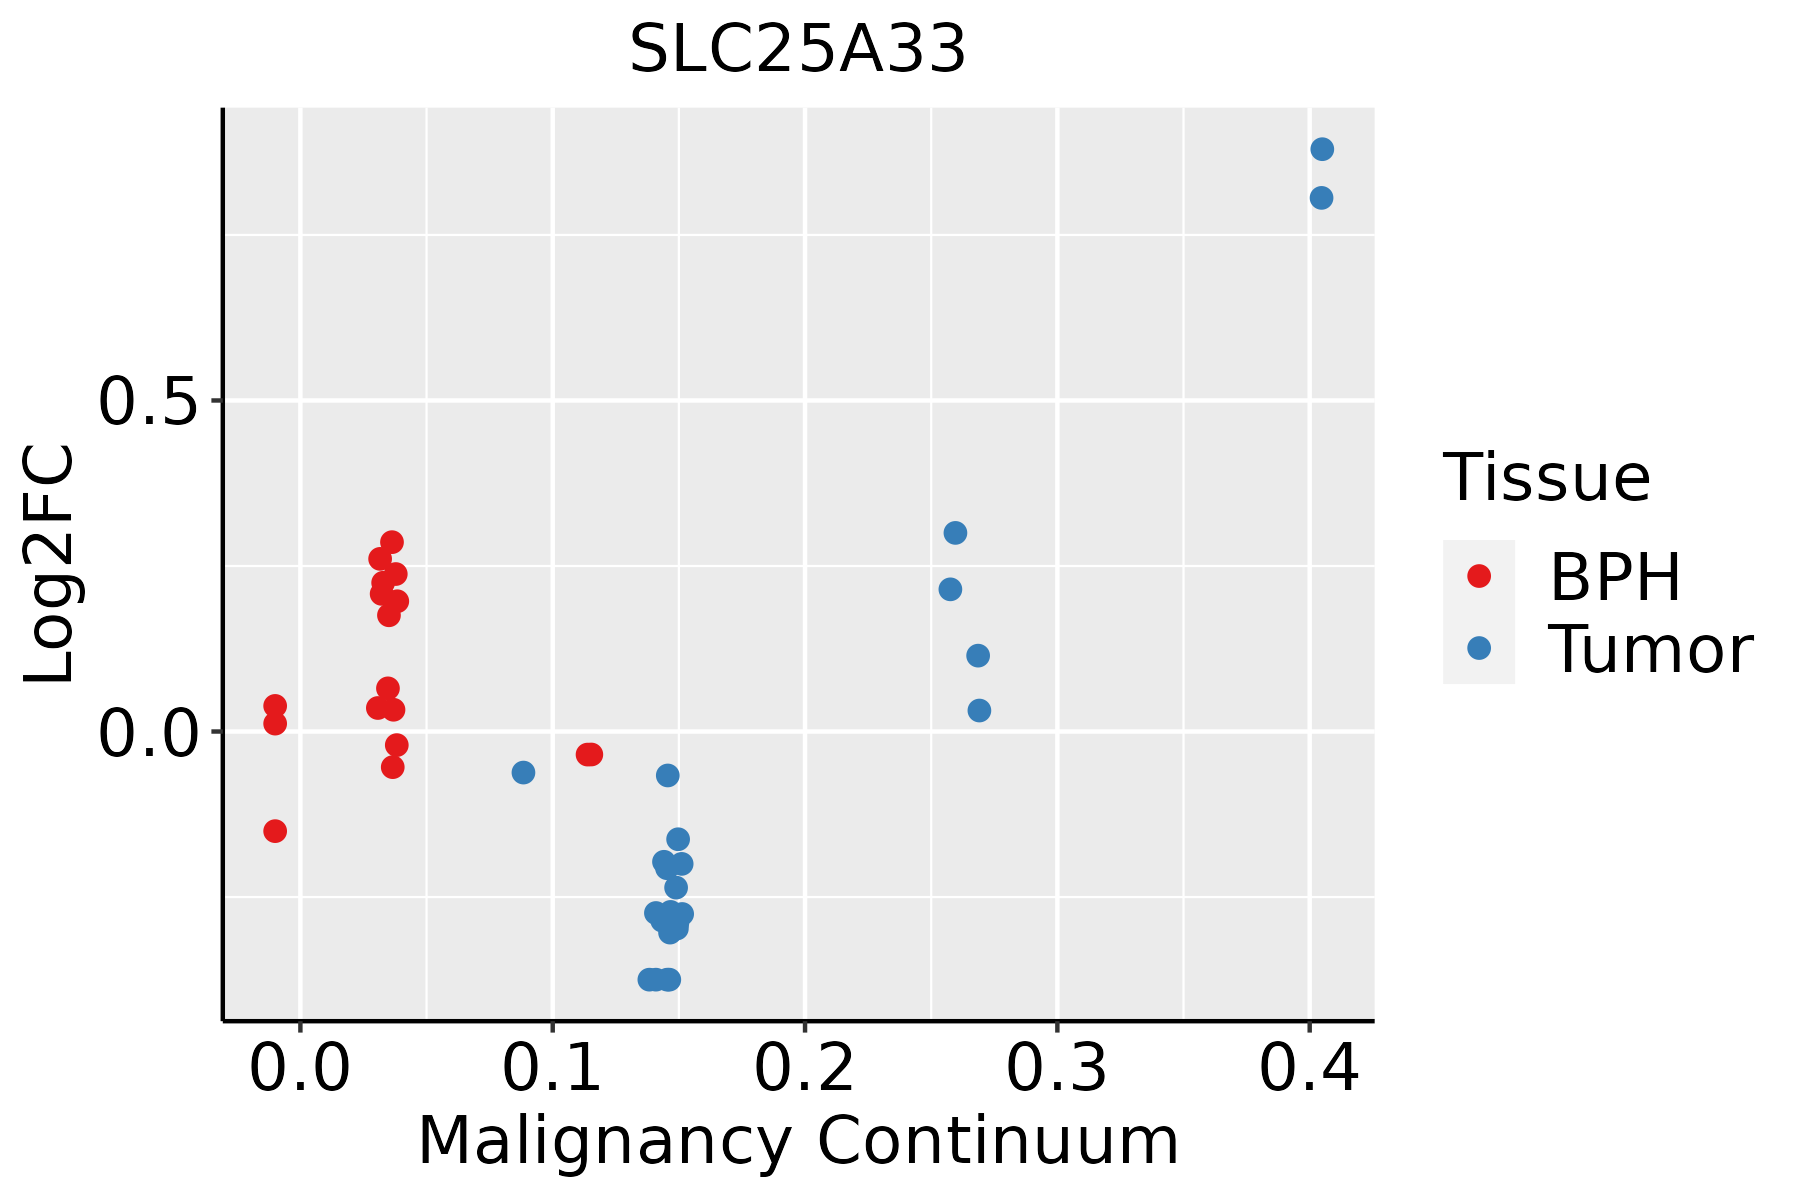 | BPH: Benign Prostatic Hyperplasia |
| ∗log2FC in expression of this searched gene in stem-like cells from each diseased tissue sample relative to stem-like cells in normal samples in each tissue plotted against the malignancy continuum. Samples are colored based on if they are from different disease stage. |
Top |
Malignant transformation related pathway analysis |
| Find out the enriched GO biological processes and KEGG pathways involved in transition from healthy to precancer to cancer |
| Tissue | Disease Stage | Enriched GO biological Processes |
| Colorectum | AD |  |
| Colorectum | SER |  |
| Colorectum | MSS |  |
| Colorectum | MSI-H |  |
| Colorectum | FAP |  |
| ∗Top 15 enriched GO BP terms are showed in the bar plot of each disease state in each tissue. Each row represents a significant GO biological process which is colored according to the -log10(p.adjust). |
| Page: 1 2 3 4 5 6 7 8 9 |
| GO ID | Tissue | Disease Stage | Description | Gene Ratio | Bg Ratio | pvalue | p.adjust | Count |
| GO:0006091110 | Esophagus | ESCC | generation of precursor metabolites and energy | 331/8552 | 490/18723 | 3.86e-23 | 8.45e-21 | 331 |
| GO:0045333110 | Esophagus | ESCC | cellular respiration | 173/8552 | 230/18723 | 4.53e-20 | 5.99e-18 | 173 |
| GO:0006839110 | Esophagus | ESCC | mitochondrial transport | 187/8552 | 254/18723 | 8.35e-20 | 9.81e-18 | 187 |
| GO:0033108110 | Esophagus | ESCC | mitochondrial respiratory chain complex assembly | 83/8552 | 93/18723 | 9.56e-19 | 1.05e-16 | 83 |
| GO:014005313 | Esophagus | ESCC | mitochondrial gene expression | 93/8552 | 108/18723 | 1.96e-18 | 2.03e-16 | 93 |
| GO:0009060110 | Esophagus | ESCC | aerobic respiration | 145/8552 | 189/18723 | 2.16e-18 | 2.21e-16 | 145 |
| GO:0015980110 | Esophagus | ESCC | energy derivation by oxidation of organic compounds | 220/8552 | 318/18723 | 1.20e-17 | 1.09e-15 | 220 |
| GO:001593117 | Esophagus | ESCC | nucleobase-containing compound transport | 162/8552 | 222/18723 | 9.87e-17 | 7.93e-15 | 162 |
| GO:0046034111 | Esophagus | ESCC | ATP metabolic process | 189/8552 | 277/18723 | 1.99e-14 | 1.04e-12 | 189 |
| GO:0006119111 | Esophagus | ESCC | oxidative phosphorylation | 106/8552 | 141/18723 | 8.19e-13 | 3.63e-11 | 106 |
| GO:0016049110 | Esophagus | ESCC | cell growth | 289/8552 | 482/18723 | 1.29e-10 | 3.77e-09 | 289 |
| GO:001700413 | Esophagus | ESCC | cytochrome complex assembly | 34/8552 | 36/18723 | 5.08e-10 | 1.31e-08 | 34 |
| GO:000155819 | Esophagus | ESCC | regulation of cell growth | 248/8552 | 414/18723 | 2.97e-09 | 6.45e-08 | 248 |
| GO:1990542110 | Esophagus | ESCC | mitochondrial transmembrane transport | 72/8552 | 102/18723 | 2.94e-07 | 4.23e-06 | 72 |
| GO:00009592 | Esophagus | ESCC | mitochondrial RNA metabolic process | 39/8552 | 49/18723 | 1.20e-06 | 1.49e-05 | 39 |
| GO:190165319 | Esophagus | ESCC | cellular response to peptide | 208/8552 | 359/18723 | 1.68e-06 | 2.01e-05 | 208 |
| GO:200037718 | Esophagus | ESCC | regulation of reactive oxygen species metabolic process | 100/8552 | 157/18723 | 3.87e-06 | 4.17e-05 | 100 |
| GO:0043434111 | Esophagus | ESCC | response to peptide hormone | 234/8552 | 414/18723 | 4.93e-06 | 5.21e-05 | 234 |
| GO:003286918 | Esophagus | ESCC | cellular response to insulin stimulus | 124/8552 | 203/18723 | 6.63e-06 | 6.75e-05 | 124 |
| GO:003286818 | Esophagus | ESCC | response to insulin | 156/8552 | 264/18723 | 7.21e-06 | 7.20e-05 | 156 |
| Page: 1 2 3 4 5 6 7 8 9 10 11 12 13 14 |
| Pathway ID | Tissue | Disease Stage | Description | Gene Ratio | Bg Ratio | pvalue | p.adjust | qvalue | Count |
| Page: 1 |
Top |
Cell-cell communication analysis |
| Identification of potential cell-cell interactions between two cell types and their ligand-receptor pairs for different disease states |
| Ligand | Receptor | LRpair | Pathway | Tissue | Disease Stage |
| Page: 1 |
Top |
Single-cell gene regulatory network inference analysis |
| Find out the significant the regulons (TFs) and the target genes of each regulon across cell types for different disease states |
| TF | Cell Type | Tissue | Disease Stage | Target Gene | RSS | Regulon Activity |
| ∗The dot plots of a searched regulon are shown for all cell subpopulations in each disease state of each tissue based on the regulon specific score inferred using pySCENIC and by calculating the average expression. |
| Page: 1 |
Top |
Somatic mutation of malignant transformation related genes |
| Annotation of somatic variants for genes involved in malignant transformation |
| Hugo Symbol | Variant Class | Variant Classification | dbSNP RS | HGVSc | HGVSp | HGVSp Short | SWISSPROT | BIOTYPE | SIFT | PolyPhen | Tumor Sample Barcode | Tissue | Histology | Sex | Age | Stage | Therapy Types | Drugs | Outcome |
| SLC25A33 | SNV | Missense_Mutation | novel | c.578C>T | p.Ser193Leu | p.S193L | Q9BSK2 | protein_coding | deleterious(0) | probably_damaging(1) | TCGA-2W-A8YY-01 | Cervix | cervical & endocervical cancer | Female | <65 | I/II | Chemotherapy | cisplatin | CR |
| SLC25A33 | SNV | Missense_Mutation | c.847G>C | p.Gly283Arg | p.G283R | Q9BSK2 | protein_coding | deleterious(0.01) | probably_damaging(0.967) | TCGA-A6-5659-01 | Colorectum | colon adenocarcinoma | Male | >=65 | I/II | Unknown | Unknown | SD | |
| SLC25A33 | SNV | Missense_Mutation | rs750582662 | c.112C>T | p.Arg38Trp | p.R38W | Q9BSK2 | protein_coding | deleterious(0) | probably_damaging(1) | TCGA-AD-5900-01 | Colorectum | colon adenocarcinoma | Male | >=65 | I/II | Unknown | Unknown | SD |
| SLC25A33 | insertion | Frame_Shift_Ins | novel | c.695_696insT | p.Gly235TrpfsTer10 | p.G235Wfs*10 | Q9BSK2 | protein_coding | TCGA-AD-6889-01 | Colorectum | colon adenocarcinoma | Male | >=65 | I/II | Chemotherapy | xeloda | PD | ||
| SLC25A33 | SNV | Missense_Mutation | rs138525926 | c.956N>A | p.Arg319His | p.R319H | Q9BSK2 | protein_coding | tolerated(0.38) | benign(0.005) | TCGA-A5-A0G2-01 | Endometrium | uterine corpus endometrioid carcinoma | Female | <65 | III/IV | Unknown | Unknown | SD |
| SLC25A33 | SNV | Missense_Mutation | c.775N>G | p.Thr259Ala | p.T259A | Q9BSK2 | protein_coding | deleterious(0) | probably_damaging(0.983) | TCGA-AP-A059-01 | Endometrium | uterine corpus endometrioid carcinoma | Female | >=65 | I/II | Unknown | Unknown | SD | |
| SLC25A33 | SNV | Missense_Mutation | novel | c.641N>C | p.Leu214Pro | p.L214P | Q9BSK2 | protein_coding | deleterious(0) | probably_damaging(0.969) | TCGA-AP-A1DK-01 | Endometrium | uterine corpus endometrioid carcinoma | Female | <65 | I/II | Unknown | Unknown | SD |
| SLC25A33 | SNV | Missense_Mutation | rs750582662 | c.112C>T | p.Arg38Trp | p.R38W | Q9BSK2 | protein_coding | deleterious(0) | probably_damaging(1) | TCGA-AX-A1CE-01 | Endometrium | uterine corpus endometrioid carcinoma | Female | <65 | I/II | Unspecific | Paclitaxel | SD |
| SLC25A33 | SNV | Missense_Mutation | rs750582662 | c.112N>T | p.Arg38Trp | p.R38W | Q9BSK2 | protein_coding | deleterious(0) | probably_damaging(1) | TCGA-B5-A3FA-01 | Endometrium | uterine corpus endometrioid carcinoma | Female | >=65 | I/II | Unknown | Unknown | SD |
| SLC25A33 | SNV | Missense_Mutation | c.100N>T | p.Val34Phe | p.V34F | Q9BSK2 | protein_coding | deleterious(0) | probably_damaging(0.999) | TCGA-D1-A103-01 | Endometrium | uterine corpus endometrioid carcinoma | Female | >=65 | I/II | Unknown | Unknown | SD |
| Page: 1 2 3 |
Top |
Related drugs of malignant transformation related genes |
| Identification of chemicals and drugs interact with genes involved in malignant transfromation |
| (DGIdb 4.0) |
| Entrez ID | Symbol | Category | Interaction Types | Drug Claim Name | Drug Name | PMIDs |
| Page: 1 |

Copyright 2023-Present -The University of Texas Health Science Center at Houston |