
|
|||||
|
 | |
| |
| |
| |
| |
| |
|
Gene: SLC25A32 |
Gene summary for SLC25A32 |
| Gene information | Species | Human | Gene symbol | SLC25A32 | Gene ID | 81034 |
| Gene name | solute carrier family 25 member 32 | |
| Gene Alias | GLYB | |
| Cytomap | 8q22.3 | |
| Gene Type | protein-coding | GO ID | GO:0006082 | UniProtAcc | A0A024R9D0 |
Top |
Malignant transformation analysis |
| Identification of the aberrant gene expression in precancerous and cancerous lesions by comparing the gene expression of stem-like cells in diseased tissues with normal stem cells |
| Entrez ID | Symbol | Replicates | Species | Organ | Tissue | Adj P-value | Log2FC | Malignancy |
| 81034 | SLC25A32 | LZE2T | Human | Esophagus | ESCC | 3.66e-05 | 1.02e+00 | 0.082 |
| 81034 | SLC25A32 | LZE4T | Human | Esophagus | ESCC | 1.21e-13 | 4.94e-01 | 0.0811 |
| 81034 | SLC25A32 | LZE7T | Human | Esophagus | ESCC | 5.72e-12 | 2.87e-01 | 0.0667 |
| 81034 | SLC25A32 | LZE8T | Human | Esophagus | ESCC | 1.98e-15 | 4.16e-01 | 0.067 |
| 81034 | SLC25A32 | LZE20T | Human | Esophagus | ESCC | 2.33e-05 | 1.78e-01 | 0.0662 |
| 81034 | SLC25A32 | LZE24T | Human | Esophagus | ESCC | 6.72e-15 | 4.39e-01 | 0.0596 |
| 81034 | SLC25A32 | LZE21T | Human | Esophagus | ESCC | 1.50e-04 | 2.00e-01 | 0.0655 |
| 81034 | SLC25A32 | LZE6T | Human | Esophagus | ESCC | 3.75e-03 | 1.82e-01 | 0.0845 |
| 81034 | SLC25A32 | P1T-E | Human | Esophagus | ESCC | 3.35e-05 | 3.20e-01 | 0.0875 |
| 81034 | SLC25A32 | P2T-E | Human | Esophagus | ESCC | 2.97e-21 | 2.75e-01 | 0.1177 |
| 81034 | SLC25A32 | P4T-E | Human | Esophagus | ESCC | 8.61e-13 | 4.56e-01 | 0.1323 |
| 81034 | SLC25A32 | P5T-E | Human | Esophagus | ESCC | 7.23e-14 | 3.21e-01 | 0.1327 |
| 81034 | SLC25A32 | P8T-E | Human | Esophagus | ESCC | 2.28e-15 | 1.44e-01 | 0.0889 |
| 81034 | SLC25A32 | P9T-E | Human | Esophagus | ESCC | 3.37e-18 | 4.39e-01 | 0.1131 |
| 81034 | SLC25A32 | P10T-E | Human | Esophagus | ESCC | 7.63e-21 | 3.25e-01 | 0.116 |
| 81034 | SLC25A32 | P11T-E | Human | Esophagus | ESCC | 6.04e-07 | 3.59e-01 | 0.1426 |
| 81034 | SLC25A32 | P12T-E | Human | Esophagus | ESCC | 4.18e-25 | 5.77e-01 | 0.1122 |
| 81034 | SLC25A32 | P15T-E | Human | Esophagus | ESCC | 8.67e-12 | 2.32e-01 | 0.1149 |
| 81034 | SLC25A32 | P16T-E | Human | Esophagus | ESCC | 1.64e-26 | 5.85e-01 | 0.1153 |
| 81034 | SLC25A32 | P19T-E | Human | Esophagus | ESCC | 8.19e-06 | 3.75e-01 | 0.1662 |
| Page: 1 2 3 4 5 |
| Tissue | Expression Dynamics | Abbreviation |
| Esophagus |  | ESCC: Esophageal squamous cell carcinoma |
| HGIN: High-grade intraepithelial neoplasias | ||
| LGIN: Low-grade intraepithelial neoplasias | ||
| Liver | 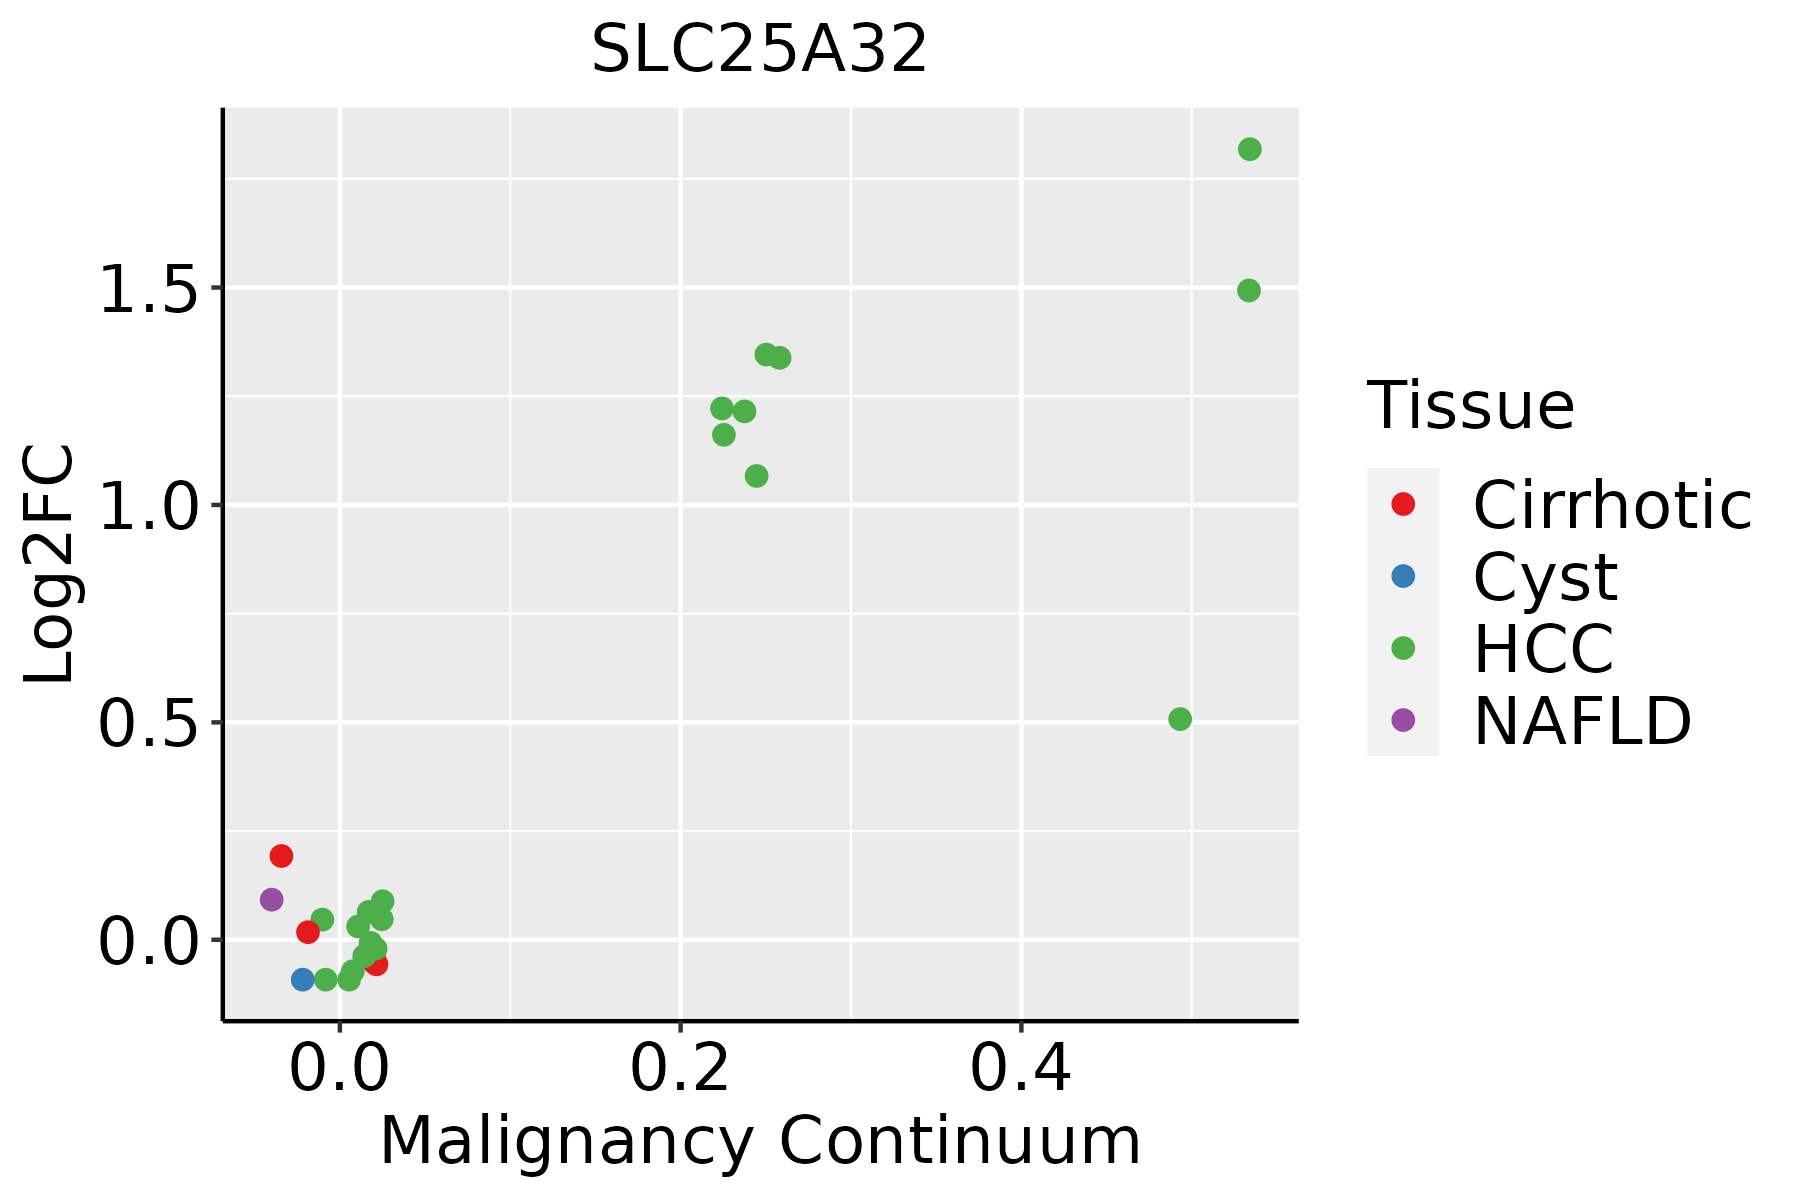 | HCC: Hepatocellular carcinoma |
| NAFLD: Non-alcoholic fatty liver disease | ||
| Oral Cavity |  | EOLP: Erosive Oral lichen planus |
| LP: leukoplakia | ||
| NEOLP: Non-erosive oral lichen planus | ||
| OSCC: Oral squamous cell carcinoma |
| ∗log2FC in expression of this searched gene in stem-like cells from each diseased tissue sample relative to stem-like cells in normal samples in each tissue plotted against the malignancy continuum. Samples are colored based on if they are from different disease stage. |
Top |
Malignant transformation related pathway analysis |
| Find out the enriched GO biological processes and KEGG pathways involved in transition from healthy to precancer to cancer |
| Tissue | Disease Stage | Enriched GO biological Processes |
| Colorectum | AD |  |
| Colorectum | SER |  |
| Colorectum | MSS |  |
| Colorectum | MSI-H |  |
| Colorectum | FAP |  |
| ∗Top 15 enriched GO BP terms are showed in the bar plot of each disease state in each tissue. Each row represents a significant GO biological process which is colored according to the -log10(p.adjust). |
| Page: 1 2 3 4 5 6 7 8 9 |
| GO ID | Tissue | Disease Stage | Description | Gene Ratio | Bg Ratio | pvalue | p.adjust | Count |
| GO:0006839110 | Esophagus | ESCC | mitochondrial transport | 187/8552 | 254/18723 | 8.35e-20 | 9.81e-18 | 187 |
| GO:001593117 | Esophagus | ESCC | nucleobase-containing compound transport | 162/8552 | 222/18723 | 9.87e-17 | 7.93e-15 | 162 |
| GO:1990542110 | Esophagus | ESCC | mitochondrial transmembrane transport | 72/8552 | 102/18723 | 2.94e-07 | 4.23e-06 | 72 |
| GO:00065757 | Esophagus | ESCC | cellular modified amino acid metabolic process | 112/8552 | 188/18723 | 8.31e-05 | 6.06e-04 | 112 |
| GO:00067671 | Esophagus | ESCC | water-soluble vitamin metabolic process | 41/8552 | 59/18723 | 1.84e-04 | 1.17e-03 | 41 |
| GO:00067661 | Esophagus | ESCC | vitamin metabolic process | 67/8552 | 106/18723 | 2.03e-04 | 1.28e-03 | 67 |
| GO:00425584 | Esophagus | ESCC | pteridine-containing compound metabolic process | 25/8552 | 33/18723 | 4.30e-04 | 2.43e-03 | 25 |
| GO:00436485 | Esophagus | ESCC | dicarboxylic acid metabolic process | 58/8552 | 96/18723 | 2.55e-03 | 1.09e-02 | 58 |
| GO:00067602 | Esophagus | ESCC | folic acid-containing compound metabolic process | 19/8552 | 26/18723 | 4.31e-03 | 1.71e-02 | 19 |
| GO:00466551 | Esophagus | ESCC | folic acid metabolic process | 11/8552 | 14/18723 | 1.30e-02 | 4.27e-02 | 11 |
| GO:000683912 | Liver | HCC | mitochondrial transport | 184/7958 | 254/18723 | 2.30e-22 | 3.83e-20 | 184 |
| GO:001593111 | Liver | HCC | nucleobase-containing compound transport | 150/7958 | 222/18723 | 3.17e-14 | 2.03e-12 | 150 |
| GO:199054212 | Liver | HCC | mitochondrial transmembrane transport | 78/7958 | 102/18723 | 2.73e-12 | 1.26e-10 | 78 |
| GO:000657521 | Liver | HCC | cellular modified amino acid metabolic process | 119/7958 | 188/18723 | 6.47e-09 | 1.67e-07 | 119 |
| GO:00436482 | Liver | HCC | dicarboxylic acid metabolic process | 68/7958 | 96/18723 | 1.73e-08 | 4.14e-07 | 68 |
| GO:00425581 | Liver | HCC | pteridine-containing compound metabolic process | 28/7958 | 33/18723 | 6.57e-07 | 1.03e-05 | 28 |
| GO:00067601 | Liver | HCC | folic acid-containing compound metabolic process | 22/7958 | 26/18723 | 1.23e-05 | 1.39e-04 | 22 |
| GO:0006767 | Liver | HCC | water-soluble vitamin metabolic process | 39/7958 | 59/18723 | 2.14e-04 | 1.63e-03 | 39 |
| GO:0046655 | Liver | HCC | folic acid metabolic process | 12/7958 | 14/18723 | 1.17e-03 | 6.54e-03 | 12 |
| GO:0006766 | Liver | HCC | vitamin metabolic process | 57/7958 | 106/18723 | 1.25e-02 | 4.53e-02 | 57 |
| Page: 1 2 |
| Pathway ID | Tissue | Disease Stage | Description | Gene Ratio | Bg Ratio | pvalue | p.adjust | qvalue | Count |
| Page: 1 |
Top |
Cell-cell communication analysis |
| Identification of potential cell-cell interactions between two cell types and their ligand-receptor pairs for different disease states |
| Ligand | Receptor | LRpair | Pathway | Tissue | Disease Stage |
| Page: 1 |
Top |
Single-cell gene regulatory network inference analysis |
| Find out the significant the regulons (TFs) and the target genes of each regulon across cell types for different disease states |
| TF | Cell Type | Tissue | Disease Stage | Target Gene | RSS | Regulon Activity |
| ∗The dot plots of a searched regulon are shown for all cell subpopulations in each disease state of each tissue based on the regulon specific score inferred using pySCENIC and by calculating the average expression. |
| Page: 1 |
Top |
Somatic mutation of malignant transformation related genes |
| Annotation of somatic variants for genes involved in malignant transformation |
| Hugo Symbol | Variant Class | Variant Classification | dbSNP RS | HGVSc | HGVSp | HGVSp Short | SWISSPROT | BIOTYPE | SIFT | PolyPhen | Tumor Sample Barcode | Tissue | Histology | Sex | Age | Stage | Therapy Types | Drugs | Outcome |
| SLC25A32 | SNV | Missense_Mutation | c.212N>A | p.Thr71Asn | p.T71N | Q9H2D1 | protein_coding | tolerated(0.06) | benign(0.078) | TCGA-A2-A3Y0-01 | Breast | breast invasive carcinoma | Female | <65 | I/II | Chemotherapy | adriamycin | CR | |
| SLC25A32 | SNV | Missense_Mutation | rs765876520 | c.247N>G | p.Gln83Glu | p.Q83E | Q9H2D1 | protein_coding | deleterious(0.02) | benign(0.309) | TCGA-C8-A12P-01 | Breast | breast invasive carcinoma | Female | <65 | I/II | Unknown | Unknown | SD |
| SLC25A32 | SNV | Missense_Mutation | c.932G>A | p.Arg311Lys | p.R311K | Q9H2D1 | protein_coding | tolerated(0.2) | benign(0.003) | TCGA-D8-A13Y-01 | Breast | breast invasive carcinoma | Female | <65 | I/II | Chemotherapy | doxorubicin | SD | |
| SLC25A32 | SNV | Missense_Mutation | c.320N>G | p.Lys107Arg | p.K107R | Q9H2D1 | protein_coding | deleterious(0.03) | probably_damaging(0.951) | TCGA-D8-A1XQ-01 | Breast | breast invasive carcinoma | Female | >=65 | I/II | Unknown | Unknown | SD | |
| SLC25A32 | SNV | Missense_Mutation | rs765876520 | c.247N>G | p.Gln83Glu | p.Q83E | Q9H2D1 | protein_coding | deleterious(0.02) | benign(0.309) | TCGA-E9-A1RD-01 | Breast | breast invasive carcinoma | Female | >=65 | I/II | Hormone Therapy | tamoxiphen | SD |
| SLC25A32 | insertion | Frame_Shift_Ins | novel | c.257_258insTGTGCCTGTCTCAATA | p.Pro87ValfsTer29 | p.P87Vfs*29 | Q9H2D1 | protein_coding | TCGA-A8-A08H-01 | Breast | breast invasive carcinoma | Female | >=65 | I/II | Unknown | Unknown | SD | ||
| SLC25A32 | insertion | Frame_Shift_Ins | novel | c.255_256insTCTTTTTCCTTGTTGAA | p.Thr86SerfsTer39 | p.T86Sfs*39 | Q9H2D1 | protein_coding | TCGA-A8-A08H-01 | Breast | breast invasive carcinoma | Female | >=65 | I/II | Unknown | Unknown | SD | ||
| SLC25A32 | SNV | Missense_Mutation | novel | c.939N>T | p.Lys313Asn | p.K313N | Q9H2D1 | protein_coding | tolerated_low_confidence(0.23) | benign(0) | TCGA-2W-A8YY-01 | Cervix | cervical & endocervical cancer | Female | <65 | I/II | Chemotherapy | cisplatin | CR |
| SLC25A32 | SNV | Missense_Mutation | novel | c.694N>A | p.Ala232Thr | p.A232T | Q9H2D1 | protein_coding | deleterious(0) | probably_damaging(0.987) | TCGA-2W-A8YY-01 | Cervix | cervical & endocervical cancer | Female | <65 | I/II | Chemotherapy | cisplatin | CR |
| SLC25A32 | SNV | Missense_Mutation | novel | c.671N>T | p.Thr224Ile | p.T224I | Q9H2D1 | protein_coding | deleterious(0.03) | benign(0.285) | TCGA-5M-AAT6-01 | Colorectum | colon adenocarcinoma | Female | <65 | III/IV | Unknown | Unknown | PD |
| Page: 1 2 3 4 5 |
Top |
Related drugs of malignant transformation related genes |
| Identification of chemicals and drugs interact with genes involved in malignant transfromation |
| (DGIdb 4.0) |
| Entrez ID | Symbol | Category | Interaction Types | Drug Claim Name | Drug Name | PMIDs |
| Page: 1 |

Copyright 2023-Present -The University of Texas Health Science Center at Houston |