
|
|||||
|
 | |
| |
| |
| |
| |
| |
|
Gene: SLC25A3 |
Gene summary for SLC25A3 |
| Gene information | Species | Human | Gene symbol | SLC25A3 | Gene ID | 5250 |
| Gene name | solute carrier family 25 member 3 | |
| Gene Alias | OK/SW-cl.48 | |
| Cytomap | 12q23.1 | |
| Gene Type | protein-coding | GO ID | GO:0006810 | UniProtAcc | A0A024RBE8 |
Top |
Malignant transformation analysis |
| Identification of the aberrant gene expression in precancerous and cancerous lesions by comparing the gene expression of stem-like cells in diseased tissues with normal stem cells |
| Entrez ID | Symbol | Replicates | Species | Organ | Tissue | Adj P-value | Log2FC | Malignancy |
| 5250 | SLC25A3 | GSM4909281 | Human | Breast | IDC | 1.19e-06 | -3.02e-01 | 0.21 |
| 5250 | SLC25A3 | GSM4909282 | Human | Breast | IDC | 2.41e-12 | -4.59e-01 | -0.0288 |
| 5250 | SLC25A3 | GSM4909287 | Human | Breast | IDC | 4.19e-02 | -3.39e-01 | 0.2057 |
| 5250 | SLC25A3 | GSM4909288 | Human | Breast | IDC | 3.96e-03 | 5.27e-03 | 0.0988 |
| 5250 | SLC25A3 | GSM4909294 | Human | Breast | IDC | 5.05e-07 | -8.92e-02 | 0.2022 |
| 5250 | SLC25A3 | GSM4909296 | Human | Breast | IDC | 4.43e-11 | -2.96e-01 | 0.1524 |
| 5250 | SLC25A3 | GSM4909297 | Human | Breast | IDC | 8.03e-29 | -4.08e-01 | 0.1517 |
| 5250 | SLC25A3 | GSM4909301 | Human | Breast | IDC | 2.79e-26 | -7.03e-01 | 0.1577 |
| 5250 | SLC25A3 | GSM4909302 | Human | Breast | IDC | 1.50e-11 | -5.51e-01 | 0.1545 |
| 5250 | SLC25A3 | GSM4909307 | Human | Breast | IDC | 2.08e-08 | -4.16e-01 | 0.1569 |
| 5250 | SLC25A3 | GSM4909309 | Human | Breast | IDC | 5.38e-03 | -2.59e-01 | 0.0483 |
| 5250 | SLC25A3 | GSM4909311 | Human | Breast | IDC | 2.07e-59 | -7.57e-01 | 0.1534 |
| 5250 | SLC25A3 | GSM4909312 | Human | Breast | IDC | 4.15e-09 | -1.41e-01 | 0.1552 |
| 5250 | SLC25A3 | GSM4909313 | Human | Breast | IDC | 4.49e-03 | -1.90e-01 | 0.0391 |
| 5250 | SLC25A3 | GSM4909315 | Human | Breast | IDC | 8.42e-12 | 2.27e-01 | 0.21 |
| 5250 | SLC25A3 | GSM4909316 | Human | Breast | IDC | 3.12e-13 | 1.66e-01 | 0.21 |
| 5250 | SLC25A3 | GSM4909319 | Human | Breast | IDC | 1.70e-70 | -6.35e-01 | 0.1563 |
| 5250 | SLC25A3 | GSM4909320 | Human | Breast | IDC | 4.81e-14 | -8.00e-01 | 0.1575 |
| 5250 | SLC25A3 | GSM4909321 | Human | Breast | IDC | 3.13e-22 | -4.52e-01 | 0.1559 |
| 5250 | SLC25A3 | brca1 | Human | Breast | Precancer | 2.84e-13 | 3.97e-01 | -0.0338 |
| Page: 1 2 3 4 5 6 7 8 9 10 11 12 13 14 15 |
| Tissue | Expression Dynamics | Abbreviation |
| Breast | 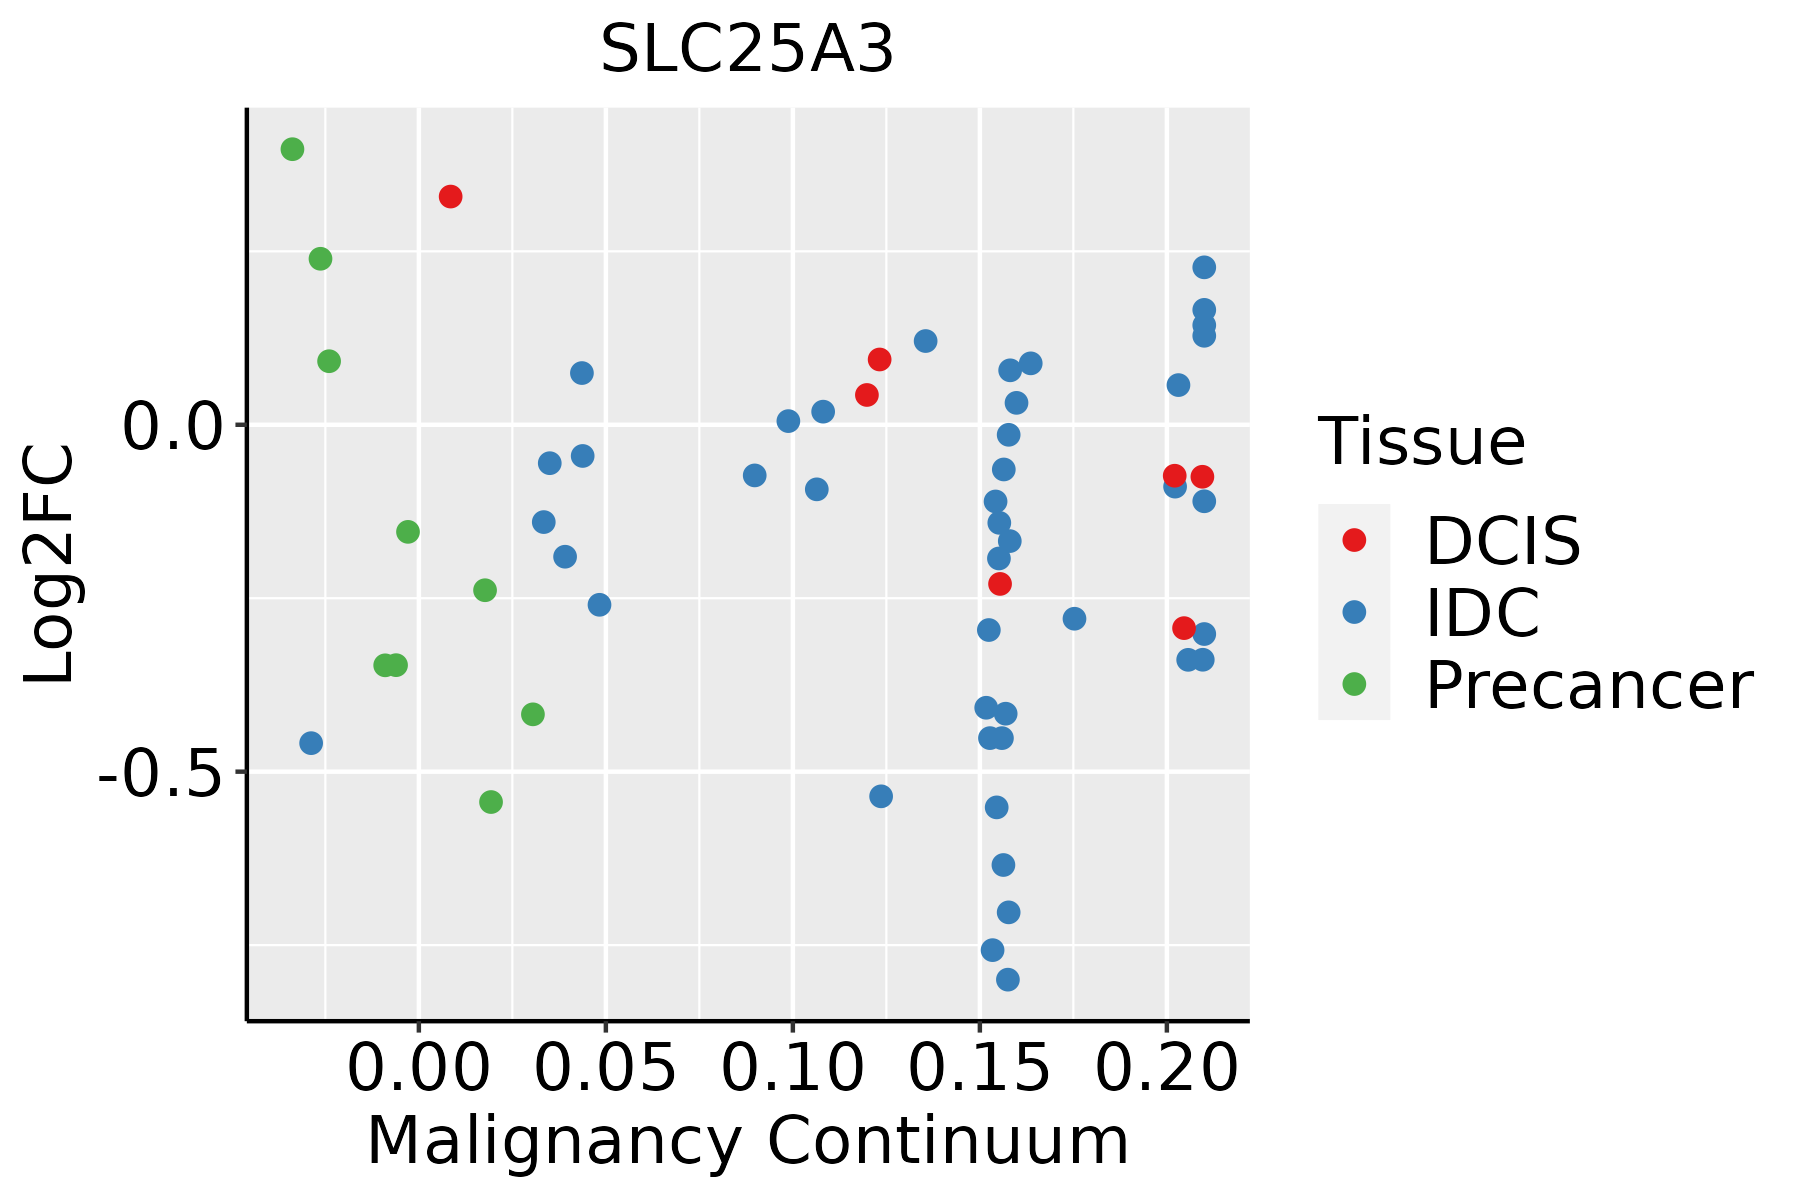 | IDC: Invasive ductal carcinoma |
| DCIS: Ductal carcinoma in situ | ||
| Precancer(BRCA1-mut): Precancerous lesion from BRCA1 mutation carriers | ||
| Cervix | 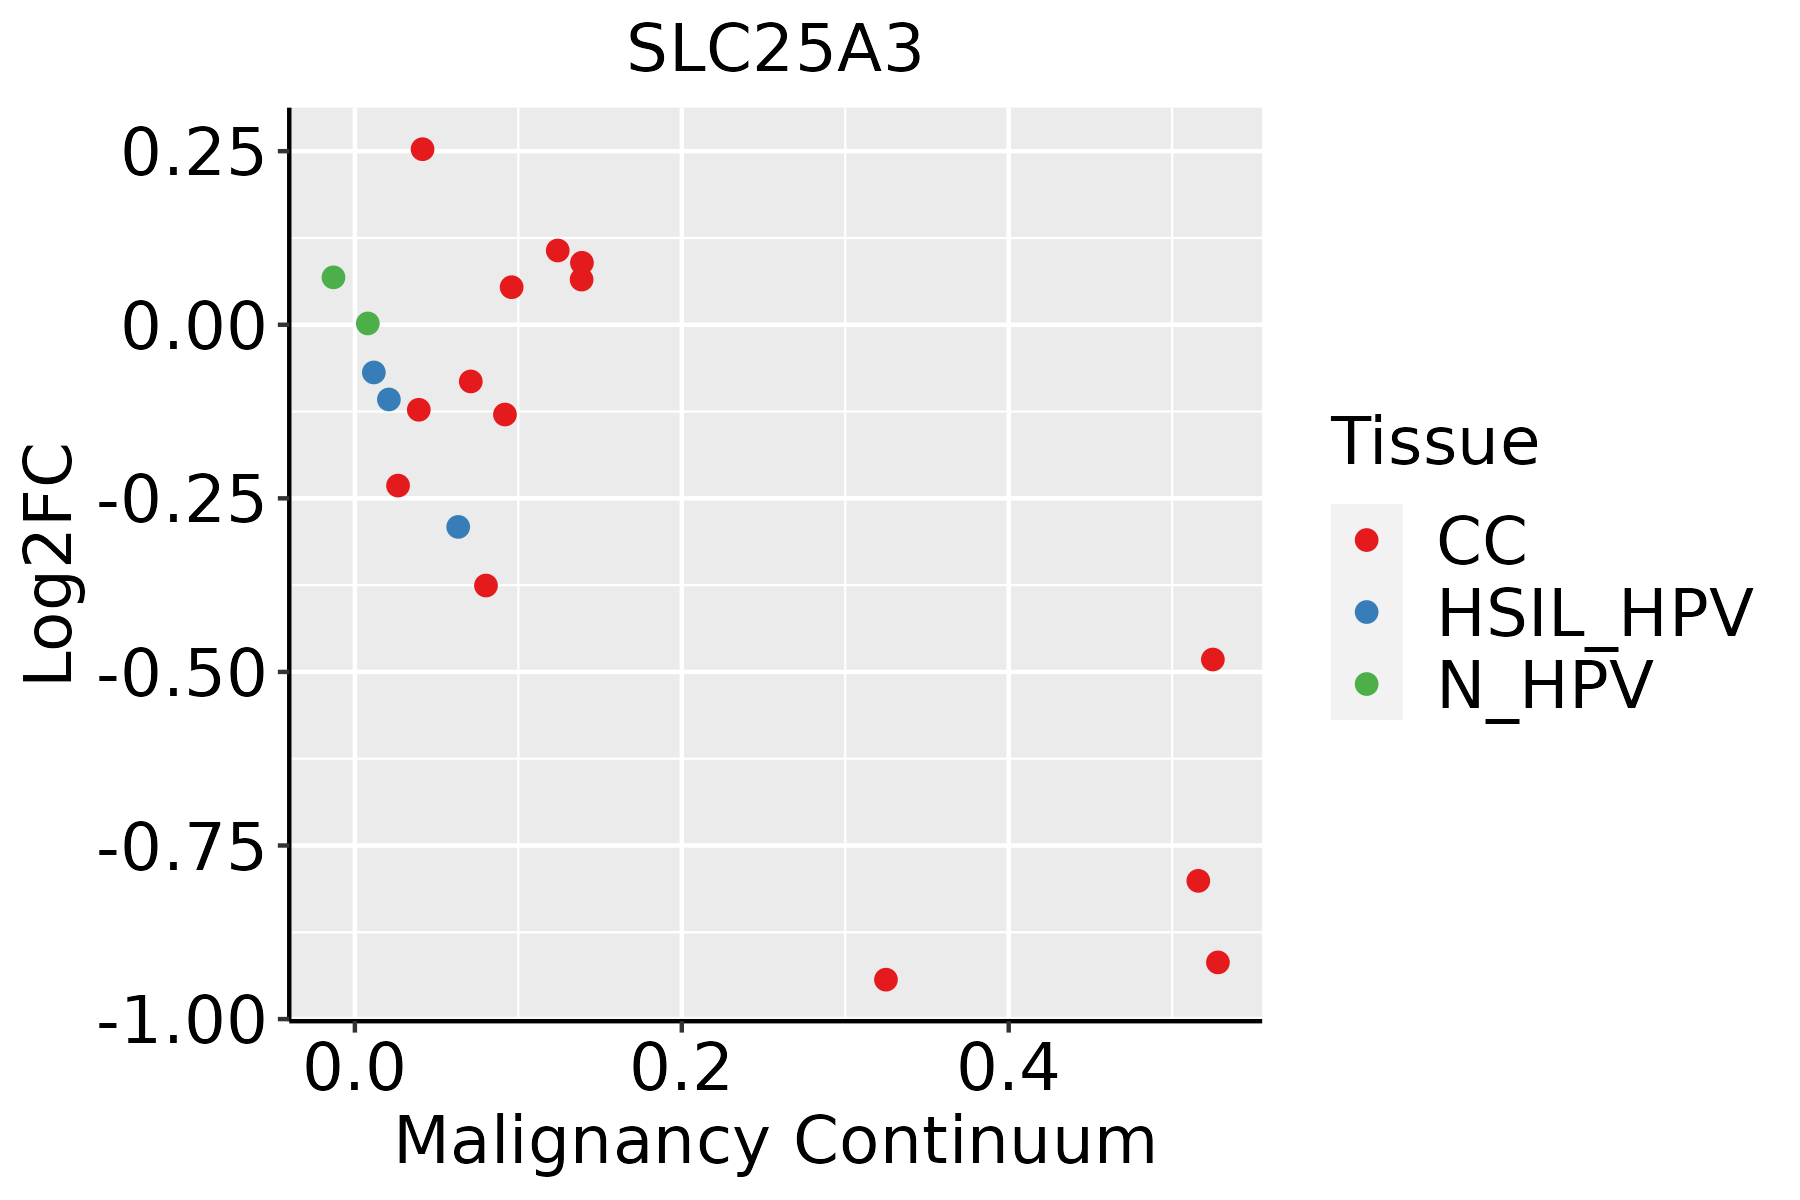 | CC: Cervix cancer |
| HSIL_HPV: HPV-infected high-grade squamous intraepithelial lesions | ||
| N_HPV: HPV-infected normal cervix | ||
| Colorectum (GSE201348) |  | FAP: Familial adenomatous polyposis |
| CRC: Colorectal cancer | ||
| Colorectum (HTA11) |  | AD: Adenomas |
| SER: Sessile serrated lesions | ||
| MSI-H: Microsatellite-high colorectal cancer | ||
| MSS: Microsatellite stable colorectal cancer | ||
| Endometrium | 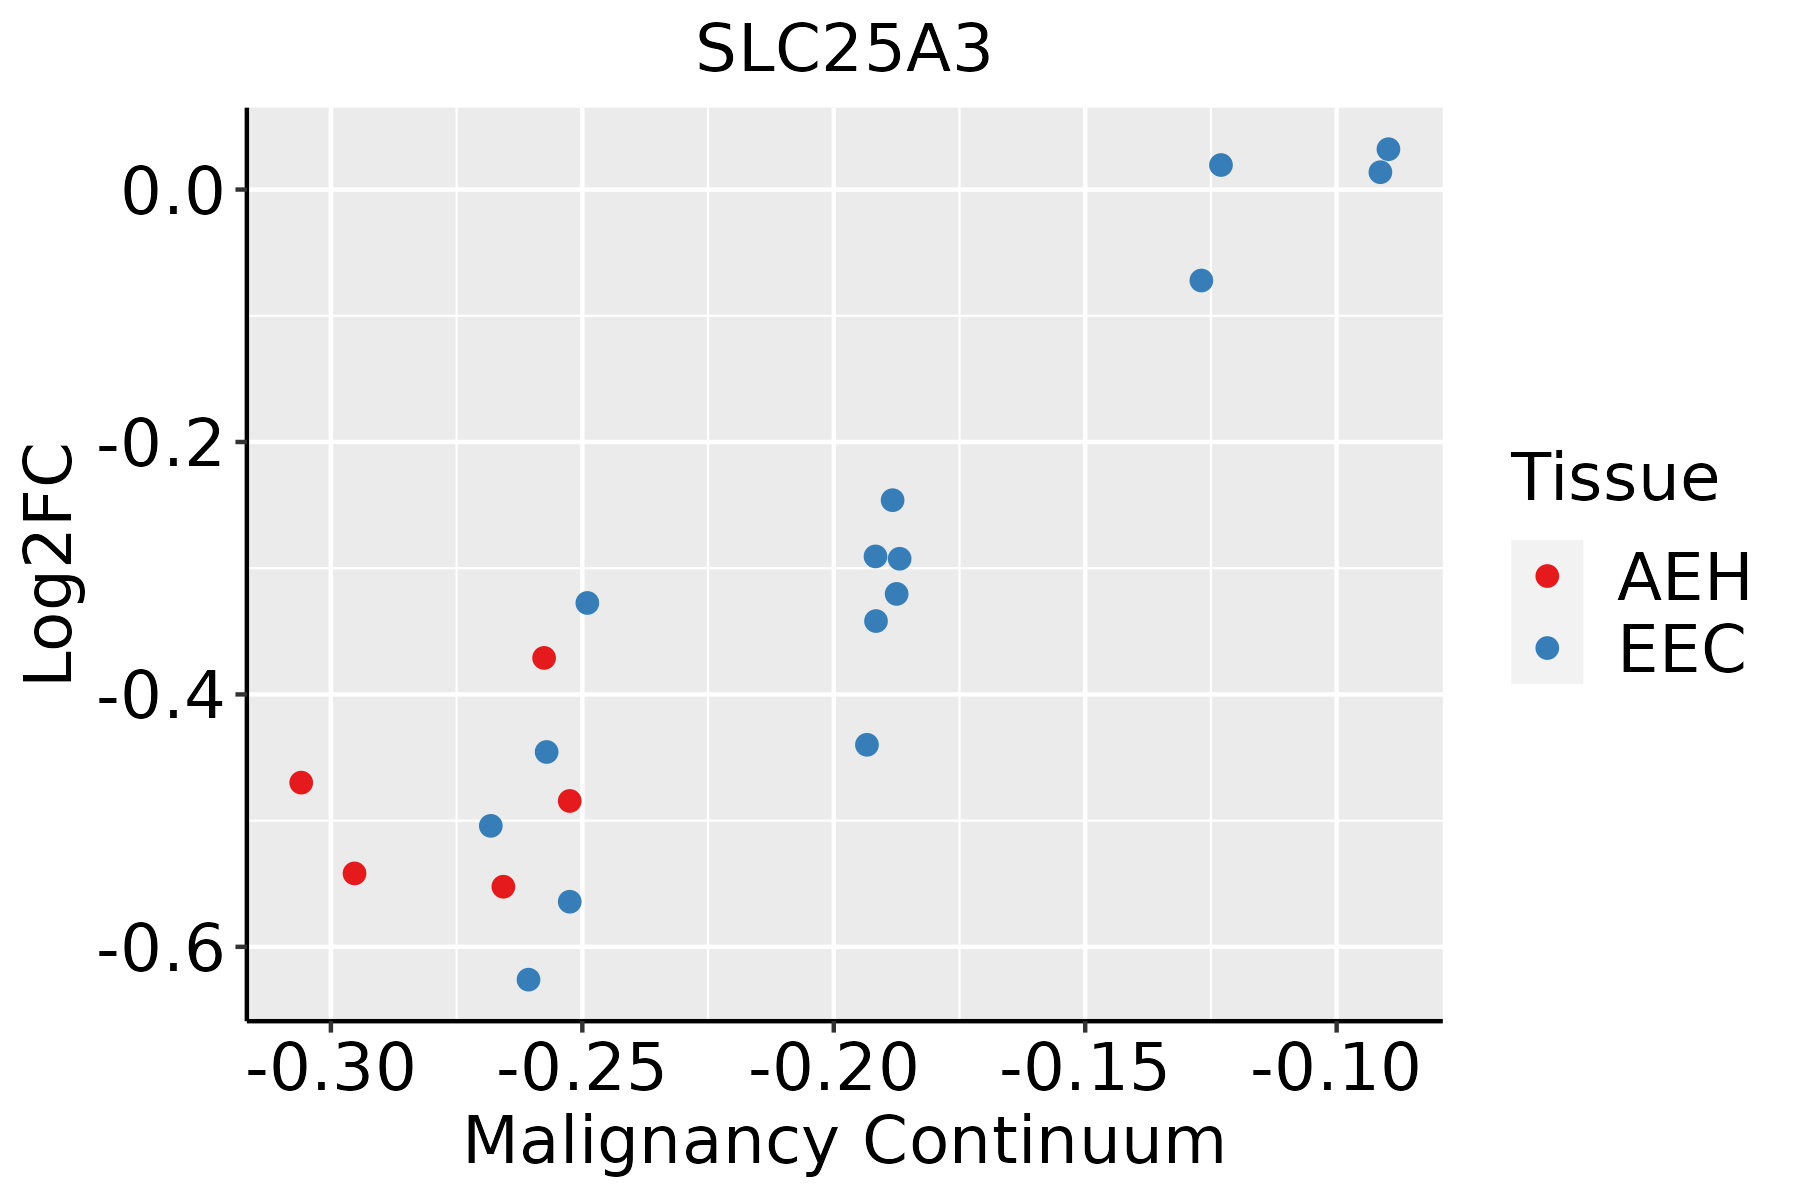 | AEH: Atypical endometrial hyperplasia |
| EEC: Endometrioid Cancer | ||
| Esophagus |  | ESCC: Esophageal squamous cell carcinoma |
| HGIN: High-grade intraepithelial neoplasias | ||
| LGIN: Low-grade intraepithelial neoplasias | ||
| Liver |  | HCC: Hepatocellular carcinoma |
| NAFLD: Non-alcoholic fatty liver disease | ||
| Lung | 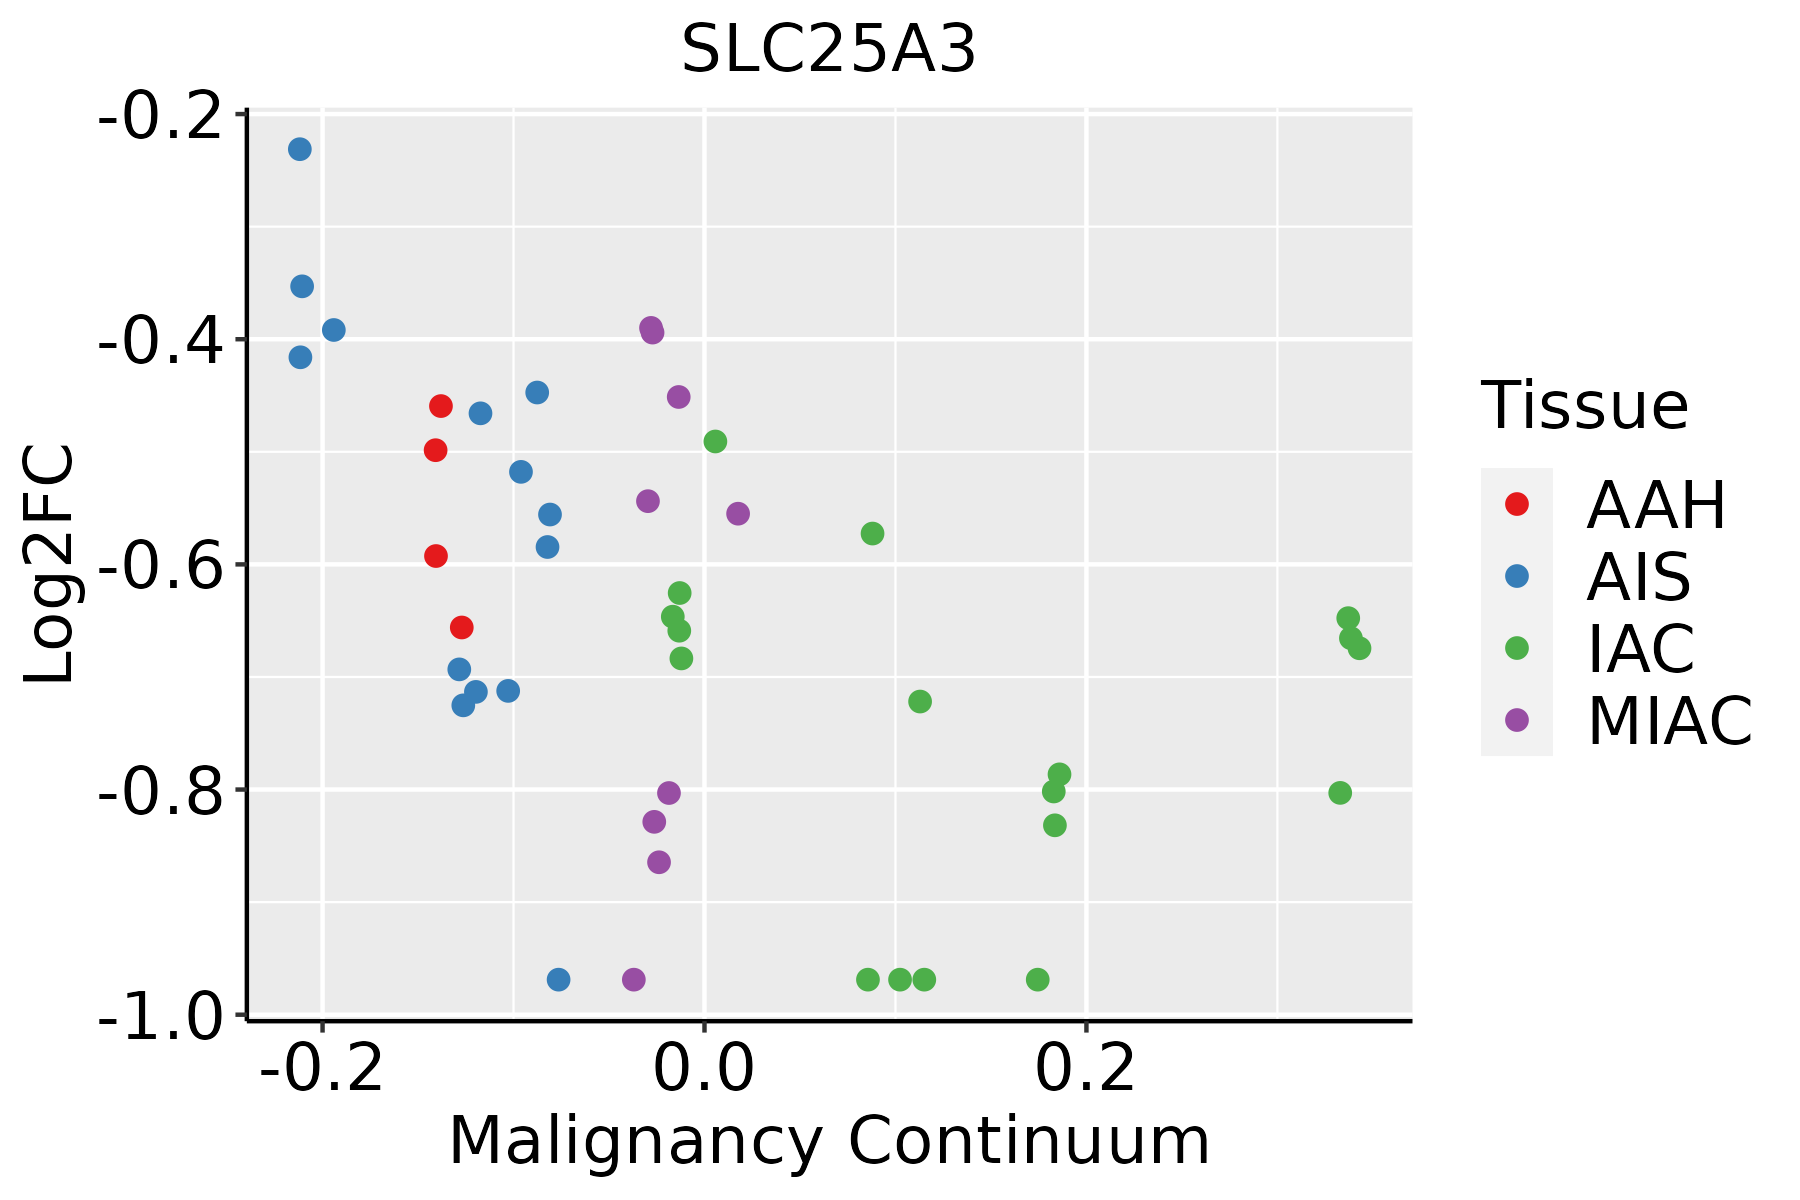 | AAH: Atypical adenomatous hyperplasia |
| AIS: Adenocarcinoma in situ | ||
| IAC: Invasive lung adenocarcinoma | ||
| MIA: Minimally invasive adenocarcinoma | ||
| Oral Cavity | 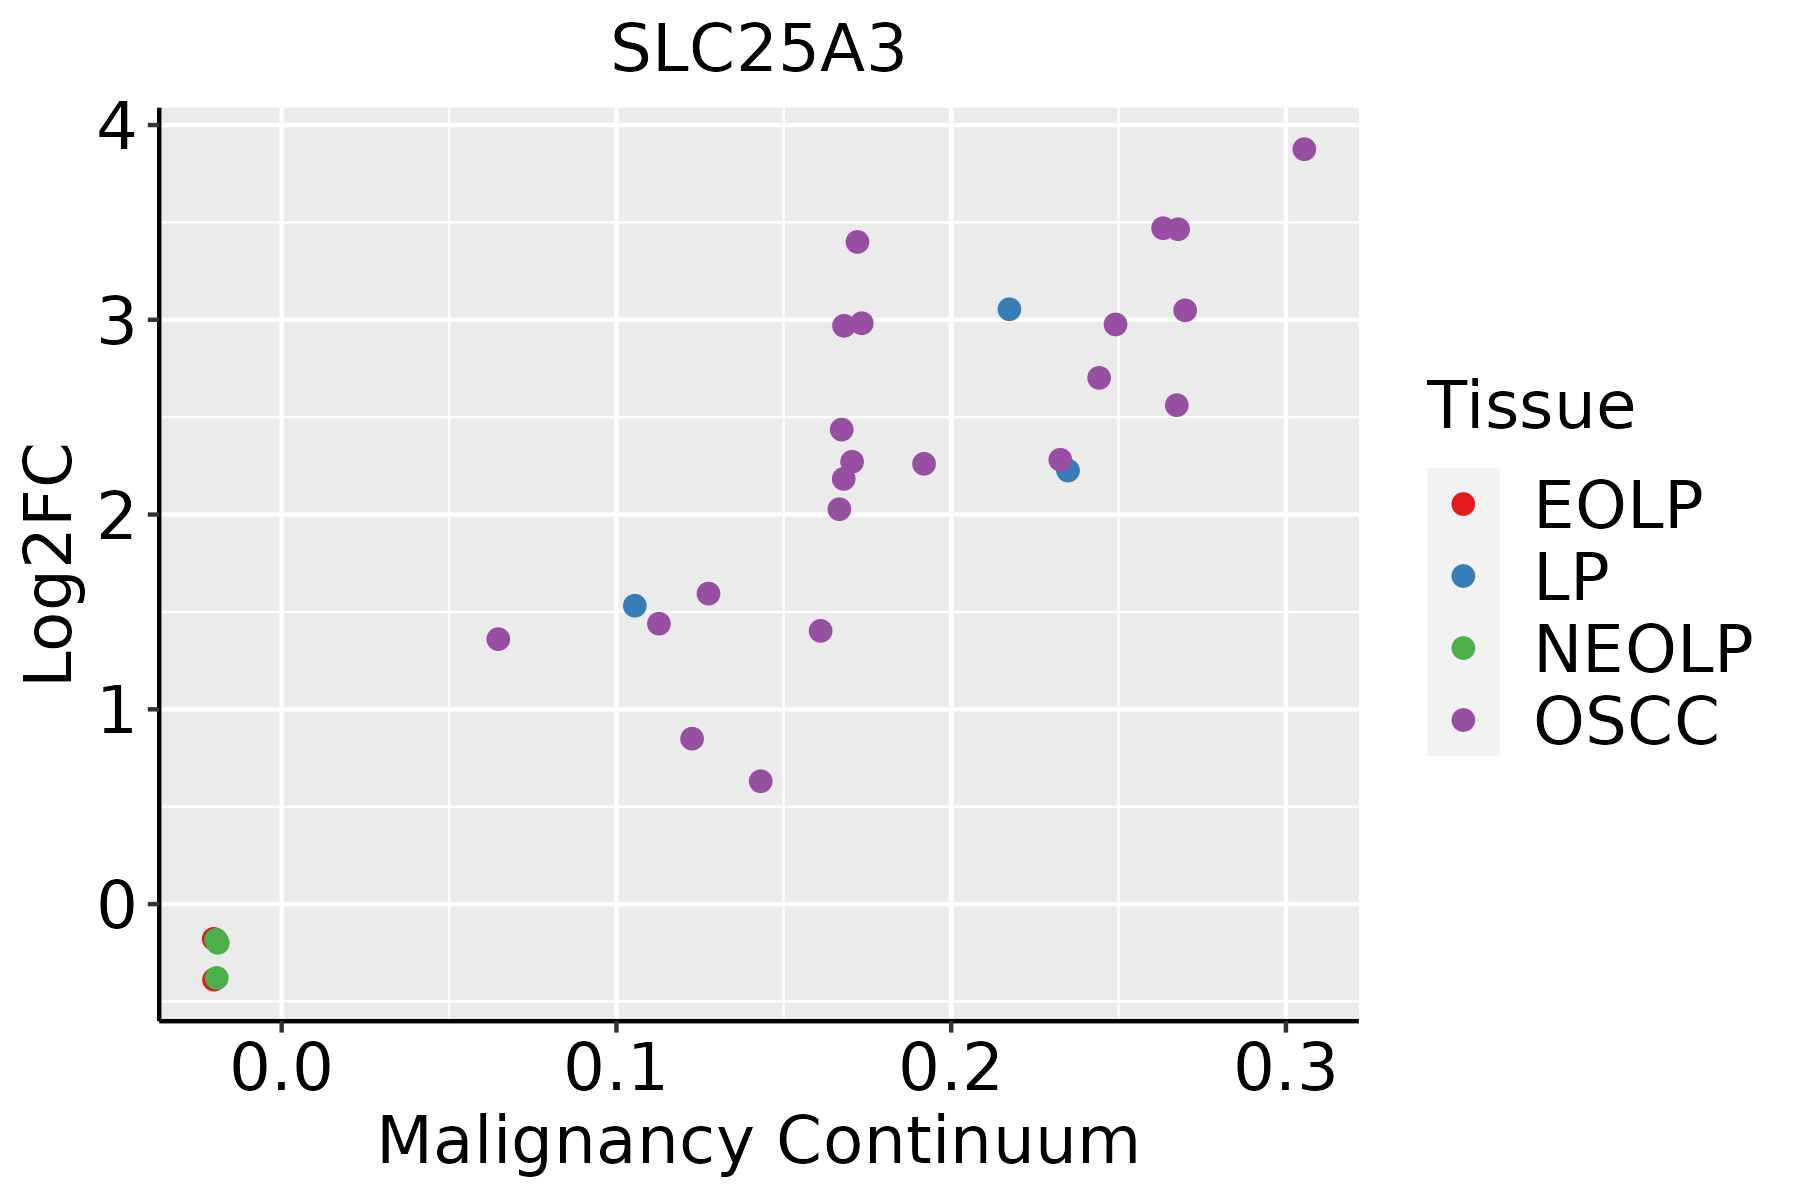 | EOLP: Erosive Oral lichen planus |
| LP: leukoplakia | ||
| NEOLP: Non-erosive oral lichen planus | ||
| OSCC: Oral squamous cell carcinoma | ||
| Prostate | 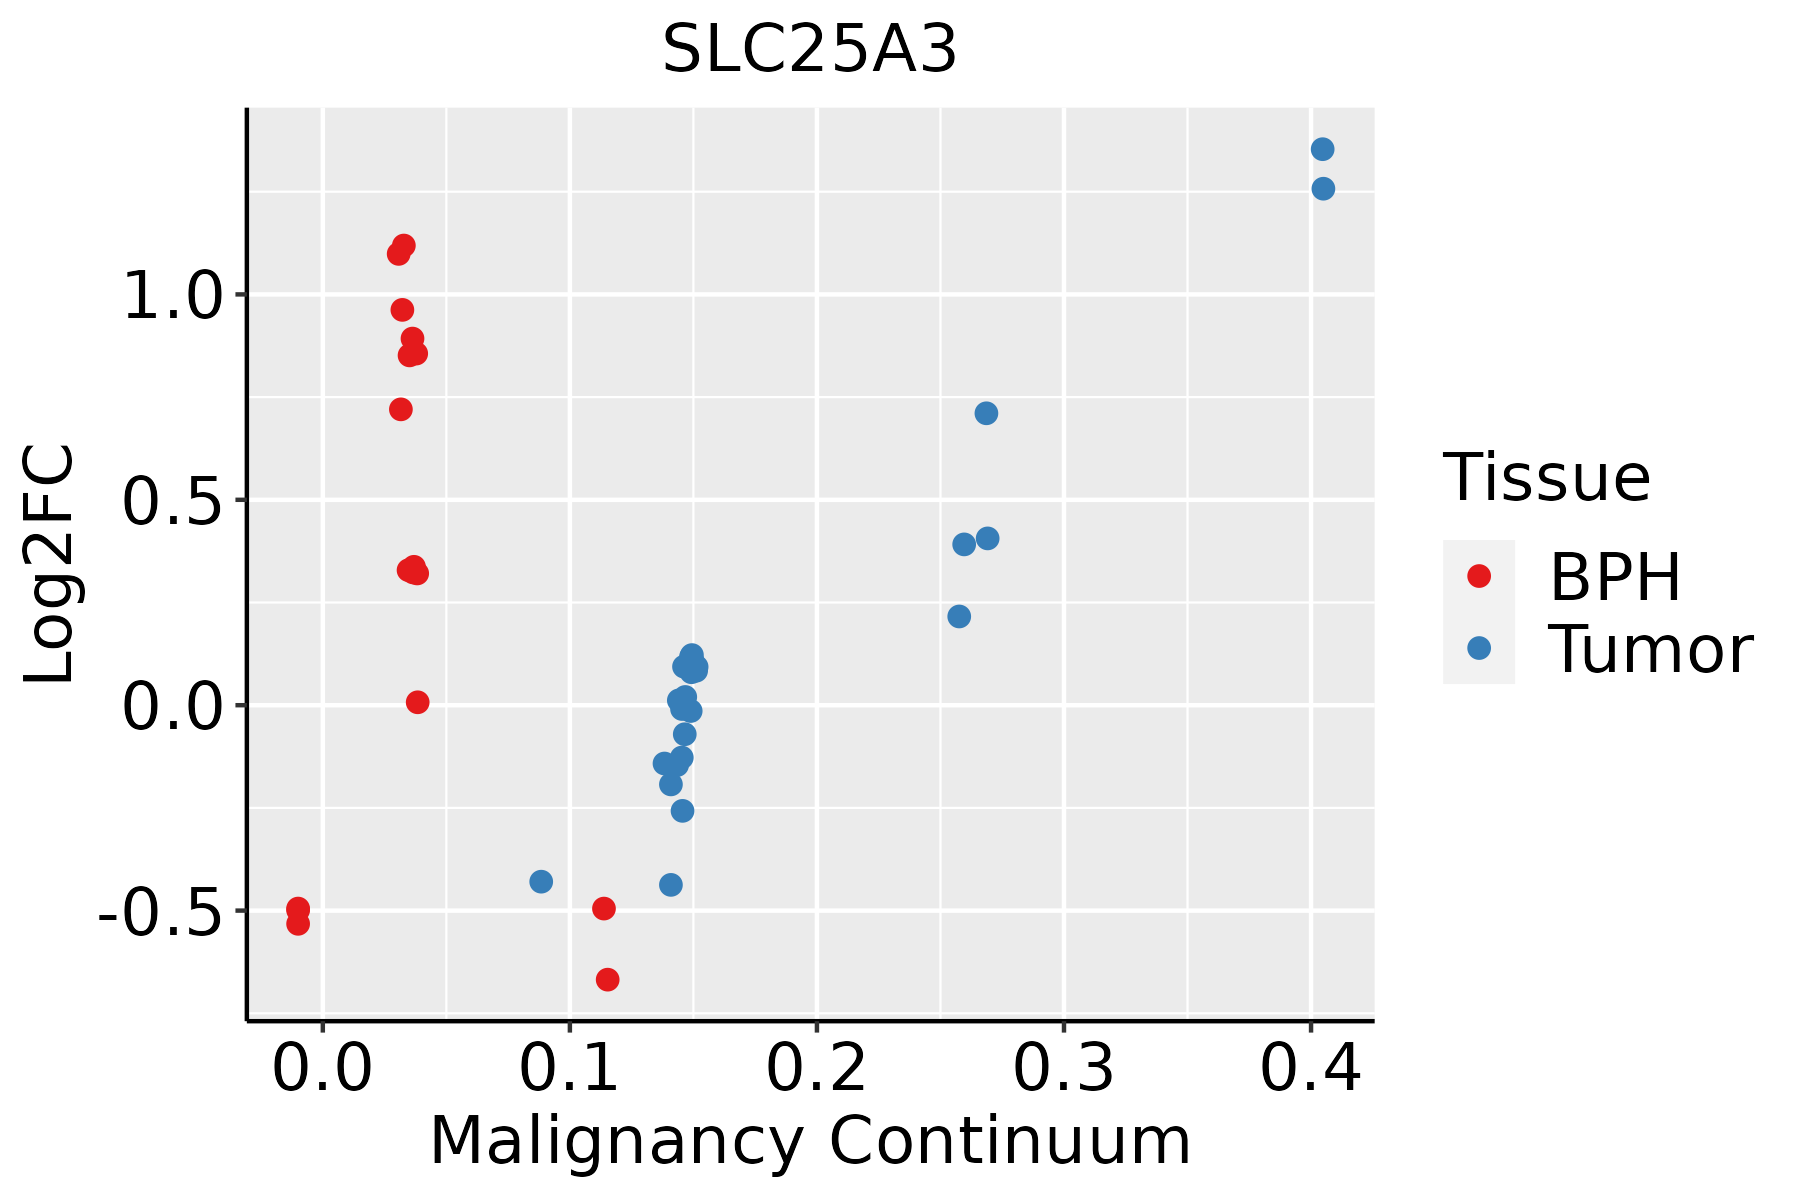 | BPH: Benign Prostatic Hyperplasia |
| Skin | 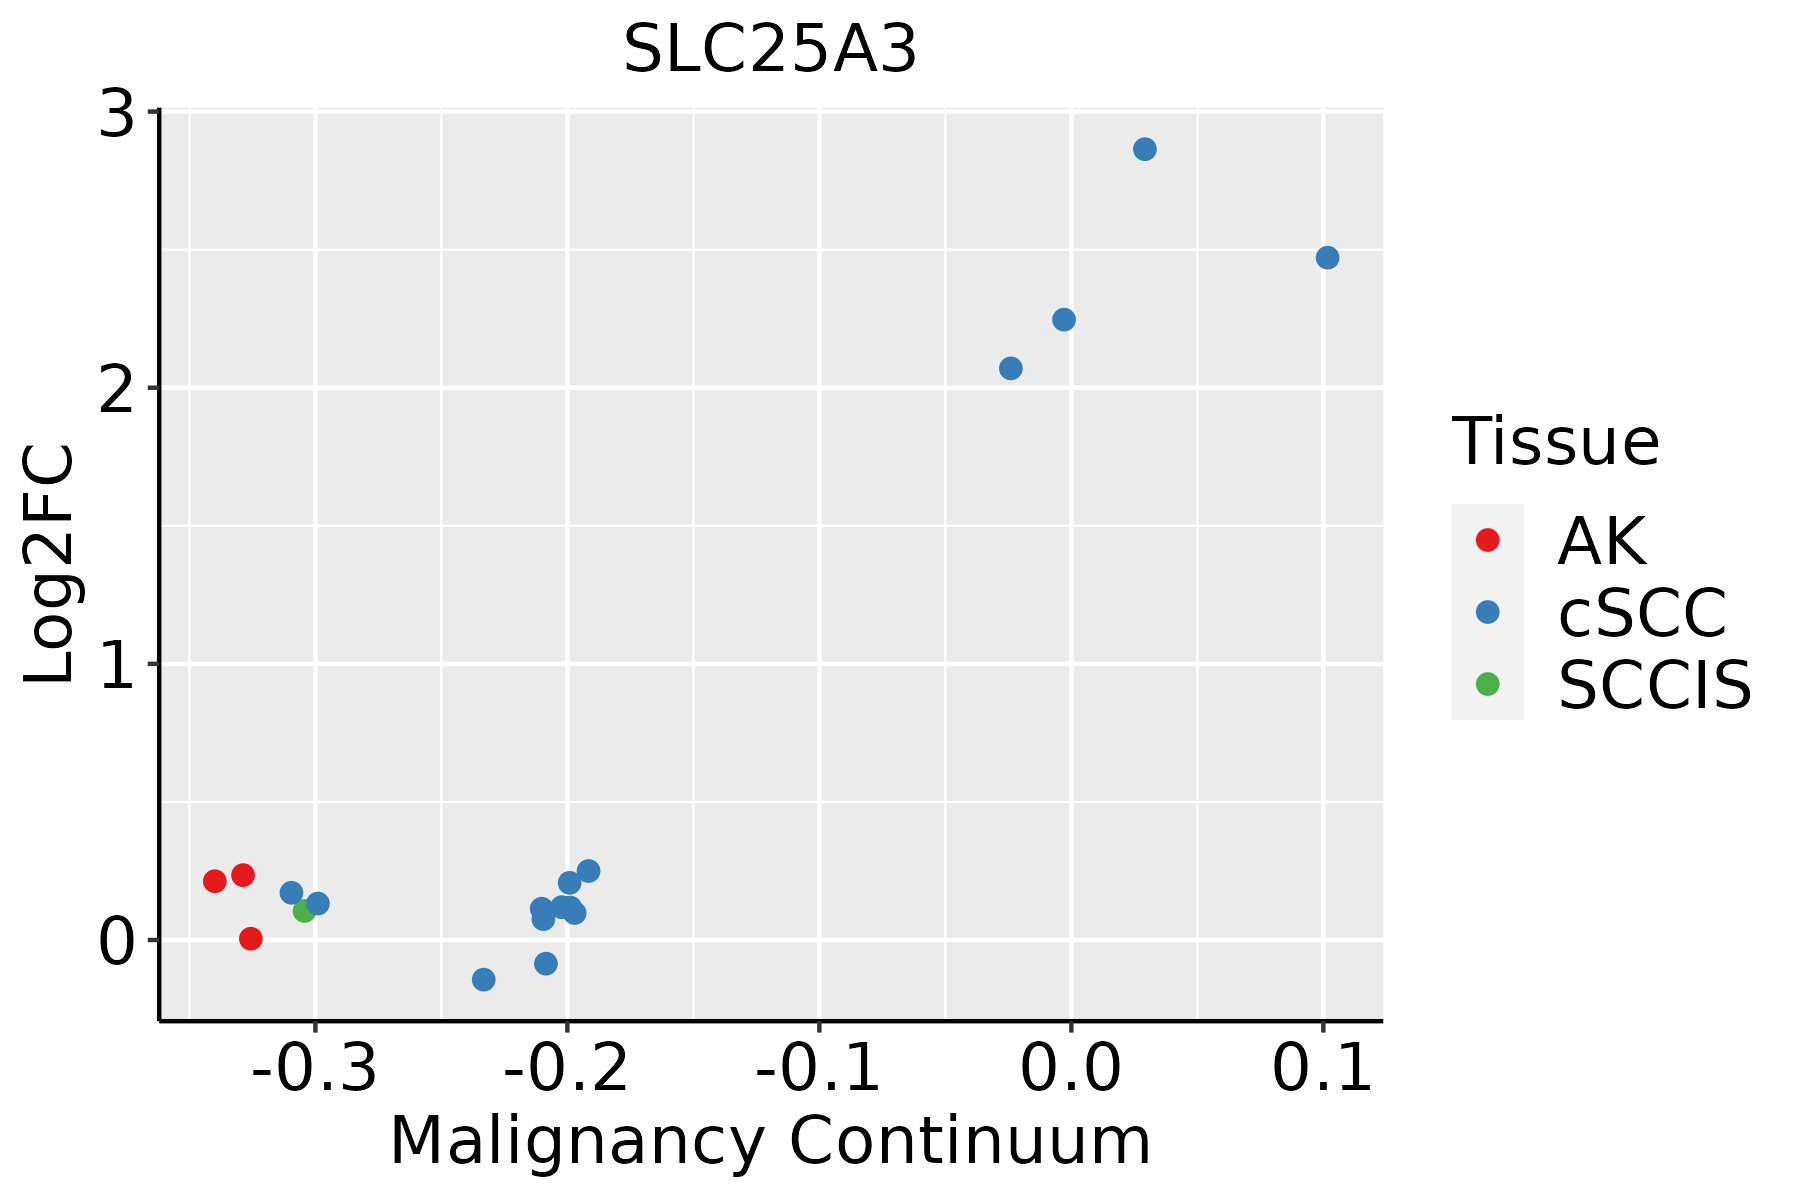 | AK: Actinic keratosis |
| cSCC: Cutaneous squamous cell carcinoma | ||
| SCCIS:squamous cell carcinoma in situ | ||
| Thyroid |  | ATC: Anaplastic thyroid cancer |
| HT: Hashimoto's thyroiditis | ||
| PTC: Papillary thyroid cancer |
| ∗log2FC in expression of this searched gene in stem-like cells from each diseased tissue sample relative to stem-like cells in normal samples in each tissue plotted against the malignancy continuum. Samples are colored based on if they are from different disease stage. |
Top |
Malignant transformation related pathway analysis |
| Find out the enriched GO biological processes and KEGG pathways involved in transition from healthy to precancer to cancer |
| Tissue | Disease Stage | Enriched GO biological Processes |
| Colorectum | AD |  |
| Colorectum | SER |  |
| Colorectum | MSS |  |
| Colorectum | MSI-H |  |
| Colorectum | FAP |  |
| ∗Top 15 enriched GO BP terms are showed in the bar plot of each disease state in each tissue. Each row represents a significant GO biological process which is colored according to the -log10(p.adjust). |
| Page: 1 2 3 4 5 6 7 8 9 |
| GO ID | Tissue | Disease Stage | Description | Gene Ratio | Bg Ratio | pvalue | p.adjust | Count |
| GO:19026008 | Breast | Precancer | proton transmembrane transport | 39/1080 | 157/18723 | 4.18e-15 | 1.18e-12 | 39 |
| GO:00068398 | Breast | Precancer | mitochondrial transport | 45/1080 | 254/18723 | 1.37e-11 | 1.88e-09 | 45 |
| GO:19905427 | Breast | Precancer | mitochondrial transmembrane transport | 22/1080 | 102/18723 | 6.38e-08 | 3.80e-06 | 22 |
| GO:00550767 | Breast | Precancer | transition metal ion homeostasis | 20/1080 | 138/18723 | 1.28e-04 | 2.24e-03 | 20 |
| GO:00550725 | Breast | Precancer | iron ion homeostasis | 12/1080 | 85/18723 | 3.41e-03 | 2.85e-02 | 12 |
| GO:00068263 | Breast | Precancer | iron ion transport | 9/1080 | 58/18723 | 5.67e-03 | 4.08e-02 | 9 |
| GO:00000412 | Breast | Precancer | transition metal ion transport | 13/1080 | 105/18723 | 7.35e-03 | 4.89e-02 | 13 |
| GO:190260012 | Breast | IDC | proton transmembrane transport | 40/1434 | 157/18723 | 7.34e-12 | 1.34e-09 | 40 |
| GO:000683913 | Breast | IDC | mitochondrial transport | 51/1434 | 254/18723 | 1.54e-10 | 1.83e-08 | 51 |
| GO:199054214 | Breast | IDC | mitochondrial transmembrane transport | 25/1434 | 102/18723 | 1.39e-07 | 7.74e-06 | 25 |
| GO:005507613 | Breast | IDC | transition metal ion homeostasis | 23/1434 | 138/18723 | 3.20e-04 | 4.79e-03 | 23 |
| GO:000682611 | Breast | IDC | iron ion transport | 11/1434 | 58/18723 | 4.10e-03 | 3.25e-02 | 11 |
| GO:005507212 | Breast | IDC | iron ion homeostasis | 14/1434 | 85/18723 | 4.98e-03 | 3.77e-02 | 14 |
| GO:190260022 | Breast | DCIS | proton transmembrane transport | 40/1390 | 157/18723 | 2.77e-12 | 5.80e-10 | 40 |
| GO:000683923 | Breast | DCIS | mitochondrial transport | 51/1390 | 254/18723 | 5.04e-11 | 6.79e-09 | 51 |
| GO:199054222 | Breast | DCIS | mitochondrial transmembrane transport | 25/1390 | 102/18723 | 7.63e-08 | 4.45e-06 | 25 |
| GO:005507622 | Breast | DCIS | transition metal ion homeostasis | 23/1390 | 138/18723 | 2.04e-04 | 3.27e-03 | 23 |
| GO:000682621 | Breast | DCIS | iron ion transport | 11/1390 | 58/18723 | 3.23e-03 | 2.73e-02 | 11 |
| GO:005507221 | Breast | DCIS | iron ion homeostasis | 14/1390 | 85/18723 | 3.78e-03 | 3.03e-02 | 14 |
| GO:00068399 | Cervix | CC | mitochondrial transport | 60/2311 | 254/18723 | 4.21e-07 | 1.67e-05 | 60 |
| Page: 1 2 3 4 5 6 7 8 9 10 11 12 13 14 15 16 17 18 19 20 21 22 23 |
| Pathway ID | Tissue | Disease Stage | Description | Gene Ratio | Bg Ratio | pvalue | p.adjust | qvalue | Count |
| Page: 1 |
Top |
Cell-cell communication analysis |
| Identification of potential cell-cell interactions between two cell types and their ligand-receptor pairs for different disease states |
| Ligand | Receptor | LRpair | Pathway | Tissue | Disease Stage |
| Page: 1 |
Top |
Single-cell gene regulatory network inference analysis |
| Find out the significant the regulons (TFs) and the target genes of each regulon across cell types for different disease states |
| TF | Cell Type | Tissue | Disease Stage | Target Gene | RSS | Regulon Activity |
| ∗The dot plots of a searched regulon are shown for all cell subpopulations in each disease state of each tissue based on the regulon specific score inferred using pySCENIC and by calculating the average expression. |
| Page: 1 |
Top |
Somatic mutation of malignant transformation related genes |
| Annotation of somatic variants for genes involved in malignant transformation |
| Hugo Symbol | Variant Class | Variant Classification | dbSNP RS | HGVSc | HGVSp | HGVSp Short | SWISSPROT | BIOTYPE | SIFT | PolyPhen | Tumor Sample Barcode | Tissue | Histology | Sex | Age | Stage | Therapy Types | Drugs | Outcome |
| SLC25A3 | insertion | Nonsense_Mutation | novel | c.832_833insTTTTTTTTTTTTCCCTAGAGTAAGGAC | p.Ala278delinsValPhePhePheSerLeuGluTerGlyPro | p.A278delinsVFFFSLE*GP | Q00325 | protein_coding | TCGA-A8-A07R-01 | Breast | breast invasive carcinoma | Female | >=65 | III/IV | Ancillary | zoledronic | SD | ||
| SLC25A3 | SNV | Missense_Mutation | novel | c.1031N>A | p.Arg344His | p.R344H | Q00325 | protein_coding | deleterious(0) | benign(0.007) | TCGA-2W-A8YY-01 | Cervix | cervical & endocervical cancer | Female | <65 | I/II | Chemotherapy | cisplatin | CR |
| SLC25A3 | SNV | Missense_Mutation | c.607G>A | p.Ala203Thr | p.A203T | Q00325 | protein_coding | tolerated(0.07) | possibly_damaging(0.845) | TCGA-A6-3809-01 | Colorectum | colon adenocarcinoma | Female | >=65 | I/II | Unknown | Unknown | SD | |
| SLC25A3 | SNV | Missense_Mutation | novel | c.566N>A | p.Arg189Gln | p.R189Q | Q00325 | protein_coding | deleterious(0.01) | probably_damaging(0.962) | TCGA-AA-3818-01 | Colorectum | colon adenocarcinoma | Female | >=65 | I/II | Unknown | Unknown | PD |
| SLC25A3 | SNV | Missense_Mutation | c.914N>T | p.Arg305Ile | p.R305I | Q00325 | protein_coding | deleterious(0.01) | benign(0.14) | TCGA-AA-3977-01 | Colorectum | colon adenocarcinoma | Male | >=65 | I/II | Unknown | Unknown | SD | |
| SLC25A3 | SNV | Missense_Mutation | c.883N>C | p.Lys295Gln | p.K295Q | Q00325 | protein_coding | deleterious(0.02) | benign(0.152) | TCGA-CA-6718-01 | Colorectum | colon adenocarcinoma | Male | <65 | I/II | Unknown | Unknown | PD | |
| SLC25A3 | SNV | Missense_Mutation | c.32C>T | p.Ala11Val | p.A11V | Q00325 | protein_coding | tolerated_low_confidence(0.51) | benign(0.03) | TCGA-D5-6930-01 | Colorectum | colon adenocarcinoma | Male | >=65 | I/II | Unknown | Unknown | SD | |
| SLC25A3 | SNV | Missense_Mutation | c.963N>T | p.Met321Ile | p.M321I | Q00325 | protein_coding | deleterious(0) | probably_damaging(0.948) | TCGA-AG-A002-01 | Colorectum | rectum adenocarcinoma | Male | <65 | I/II | Unknown | Unknown | SD | |
| SLC25A3 | SNV | Missense_Mutation | c.880N>A | p.Glu294Lys | p.E294K | Q00325 | protein_coding | tolerated(0.21) | benign(0.174) | TCGA-A5-A2K5-01 | Endometrium | uterine corpus endometrioid carcinoma | Female | >=65 | I/II | Unknown | Unknown | SD | |
| SLC25A3 | SNV | Missense_Mutation | novel | c.206N>T | p.Gly69Val | p.G69V | Q00325 | protein_coding | deleterious(0.02) | probably_damaging(0.964) | TCGA-AP-A051-01 | Endometrium | uterine corpus endometrioid carcinoma | Female | >=65 | I/II | Unknown | Unknown | SD |
| Page: 1 2 3 4 5 |
Top |
Related drugs of malignant transformation related genes |
| Identification of chemicals and drugs interact with genes involved in malignant transfromation |
| (DGIdb 4.0) |
| Entrez ID | Symbol | Category | Interaction Types | Drug Claim Name | Drug Name | PMIDs |
| Page: 1 |

Copyright 2023-Present -The University of Texas Health Science Center at Houston |