
|
|||||
|
 | |
| |
| |
| |
| |
| |
|
Gene: SLC25A29 |
Gene summary for SLC25A29 |
| Gene information | Species | Human | Gene symbol | SLC25A29 | Gene ID | 123096 |
| Gene name | solute carrier family 25 member 29 | |
| Gene Alias | C14orf69 | |
| Cytomap | 14q32.2 | |
| Gene Type | protein-coding | GO ID | GO:0003333 | UniProtAcc | Q8N8R3 |
Top |
Malignant transformation analysis |
| Identification of the aberrant gene expression in precancerous and cancerous lesions by comparing the gene expression of stem-like cells in diseased tissues with normal stem cells |
| Entrez ID | Symbol | Replicates | Species | Organ | Tissue | Adj P-value | Log2FC | Malignancy |
| 123096 | SLC25A29 | AEH-subject1 | Human | Endometrium | AEH | 5.11e-11 | 4.84e-01 | -0.3059 |
| 123096 | SLC25A29 | AEH-subject2 | Human | Endometrium | AEH | 7.96e-13 | 5.53e-01 | -0.2525 |
| 123096 | SLC25A29 | AEH-subject3 | Human | Endometrium | AEH | 2.04e-12 | 4.57e-01 | -0.2576 |
| 123096 | SLC25A29 | AEH-subject5 | Human | Endometrium | AEH | 1.16e-05 | 3.39e-01 | -0.2953 |
| 123096 | SLC25A29 | EEC-subject1 | Human | Endometrium | EEC | 1.46e-02 | 2.61e-01 | -0.2682 |
| 123096 | SLC25A29 | EEC-subject2 | Human | Endometrium | EEC | 7.49e-41 | 9.10e-01 | -0.2607 |
| 123096 | SLC25A29 | GSM5276934 | Human | Endometrium | EEC | 2.40e-05 | -2.19e-01 | -0.0913 |
| 123096 | SLC25A29 | GSM5276935 | Human | Endometrium | EEC | 1.75e-16 | 4.97e-01 | -0.123 |
| 123096 | SLC25A29 | GSM6177620_NYU_UCEC1_lib1_lib1 | Human | Endometrium | EEC | 6.62e-03 | -1.26e-03 | -0.1869 |
| 123096 | SLC25A29 | GSM6177620_NYU_UCEC1_lib2_lib2 | Human | Endometrium | EEC | 4.16e-06 | 7.60e-02 | -0.1875 |
| 123096 | SLC25A29 | GSM6177620_NYU_UCEC1_lib3_lib3 | Human | Endometrium | EEC | 9.27e-05 | -6.44e-02 | -0.1883 |
| 123096 | SLC25A29 | GSM6177621_NYU_UCEC2_lib1_lib1 | Human | Endometrium | EEC | 1.90e-03 | 3.40e-02 | -0.1934 |
| 123096 | SLC25A29 | GSM6177622_NYU_UCEC3_lib1_lib1 | Human | Endometrium | EEC | 1.91e-08 | -7.31e-02 | -0.1917 |
| 123096 | SLC25A29 | GSM6177622_NYU_UCEC3_lib2_lib2 | Human | Endometrium | EEC | 5.00e-09 | 6.19e-03 | -0.1916 |
| 123096 | SLC25A29 | GSM6177623_NYU_UCEC3_Vis | Human | Endometrium | EEC | 5.98e-07 | 4.25e-01 | -0.1269 |
| 123096 | SLC25A29 | LZE7T | Human | Esophagus | ESCC | 1.10e-02 | 5.22e-02 | 0.0667 |
| 123096 | SLC25A29 | LZE20T | Human | Esophagus | ESCC | 1.15e-02 | 5.84e-02 | 0.0662 |
| 123096 | SLC25A29 | LZE24T | Human | Esophagus | ESCC | 7.37e-05 | 2.30e-01 | 0.0596 |
| 123096 | SLC25A29 | LZE21T | Human | Esophagus | ESCC | 9.02e-06 | 3.23e-01 | 0.0655 |
| 123096 | SLC25A29 | P1T-E | Human | Esophagus | ESCC | 6.41e-03 | 1.35e-01 | 0.0875 |
| Page: 1 2 3 4 5 |
| Tissue | Expression Dynamics | Abbreviation |
| Endometrium | 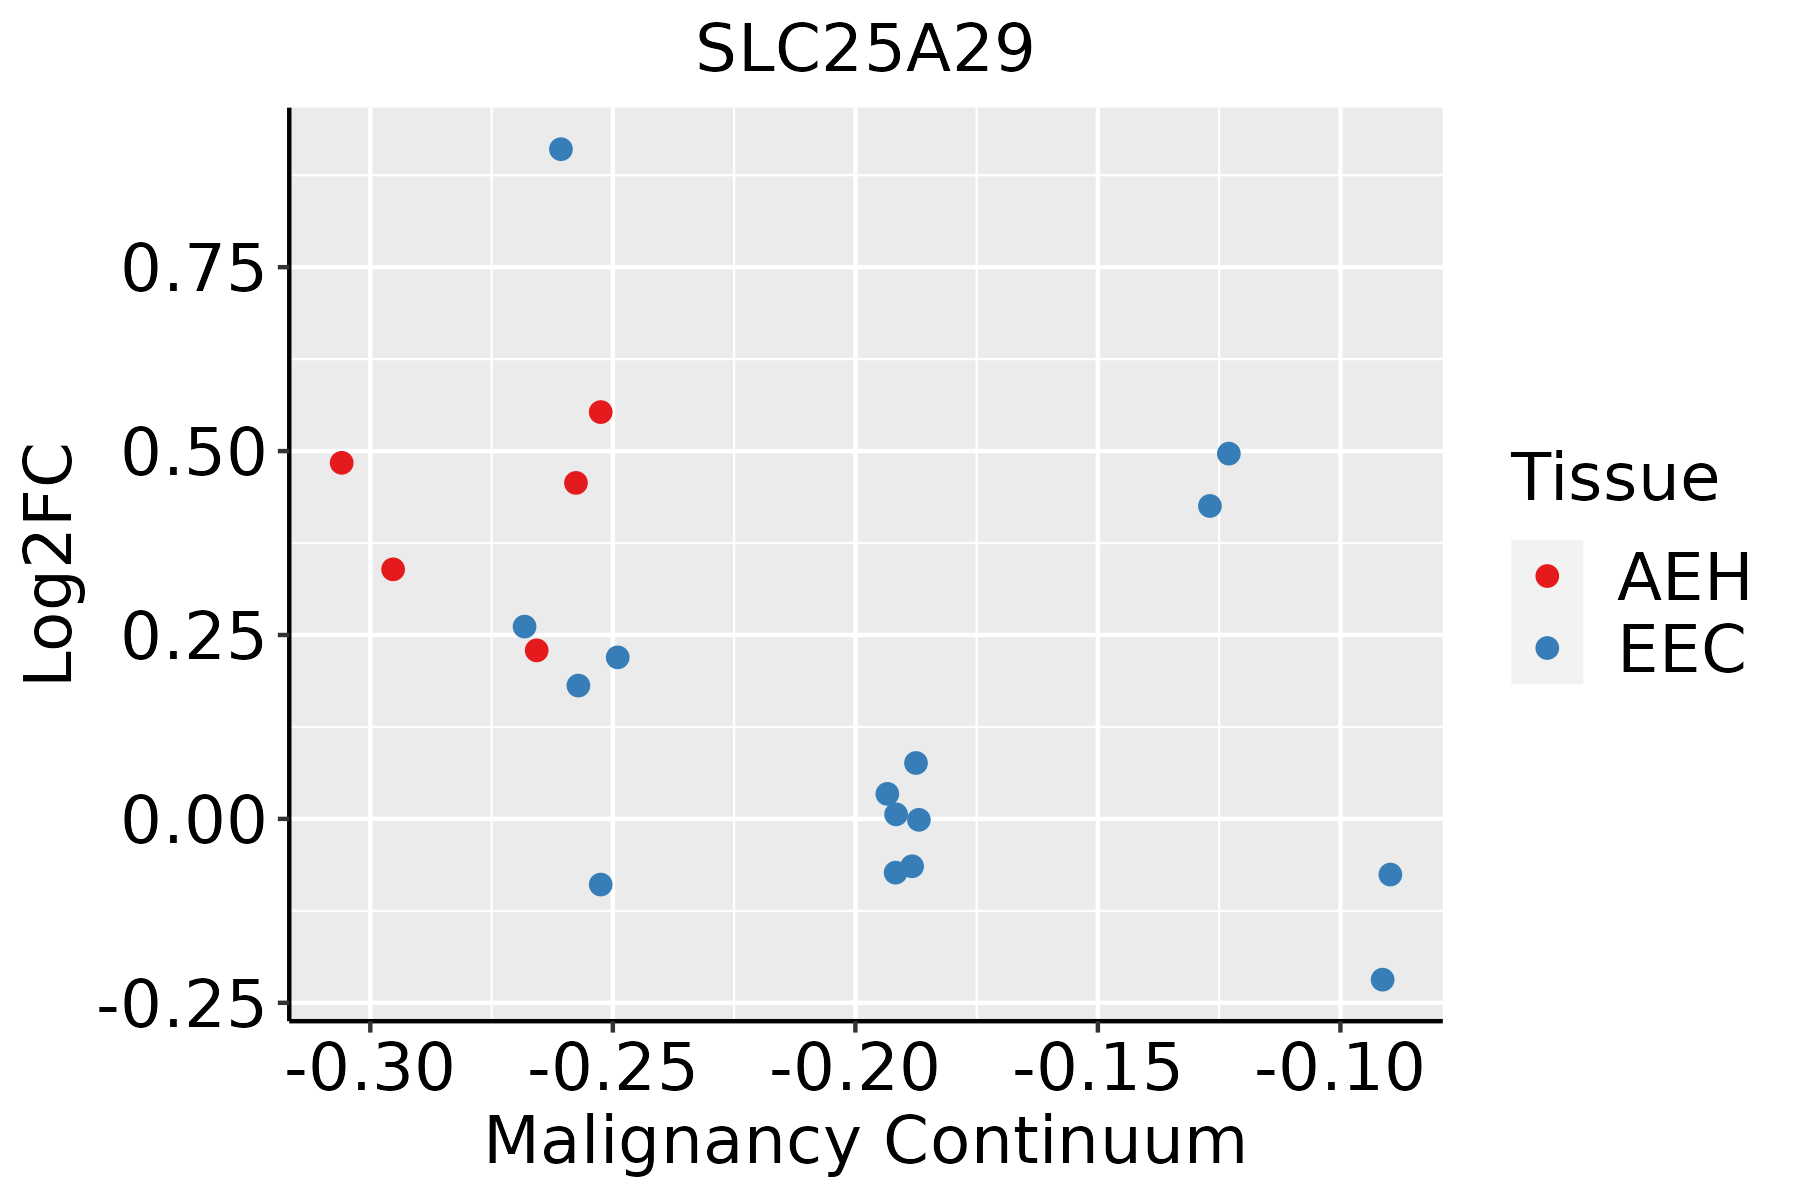 | AEH: Atypical endometrial hyperplasia |
| EEC: Endometrioid Cancer | ||
| Esophagus | 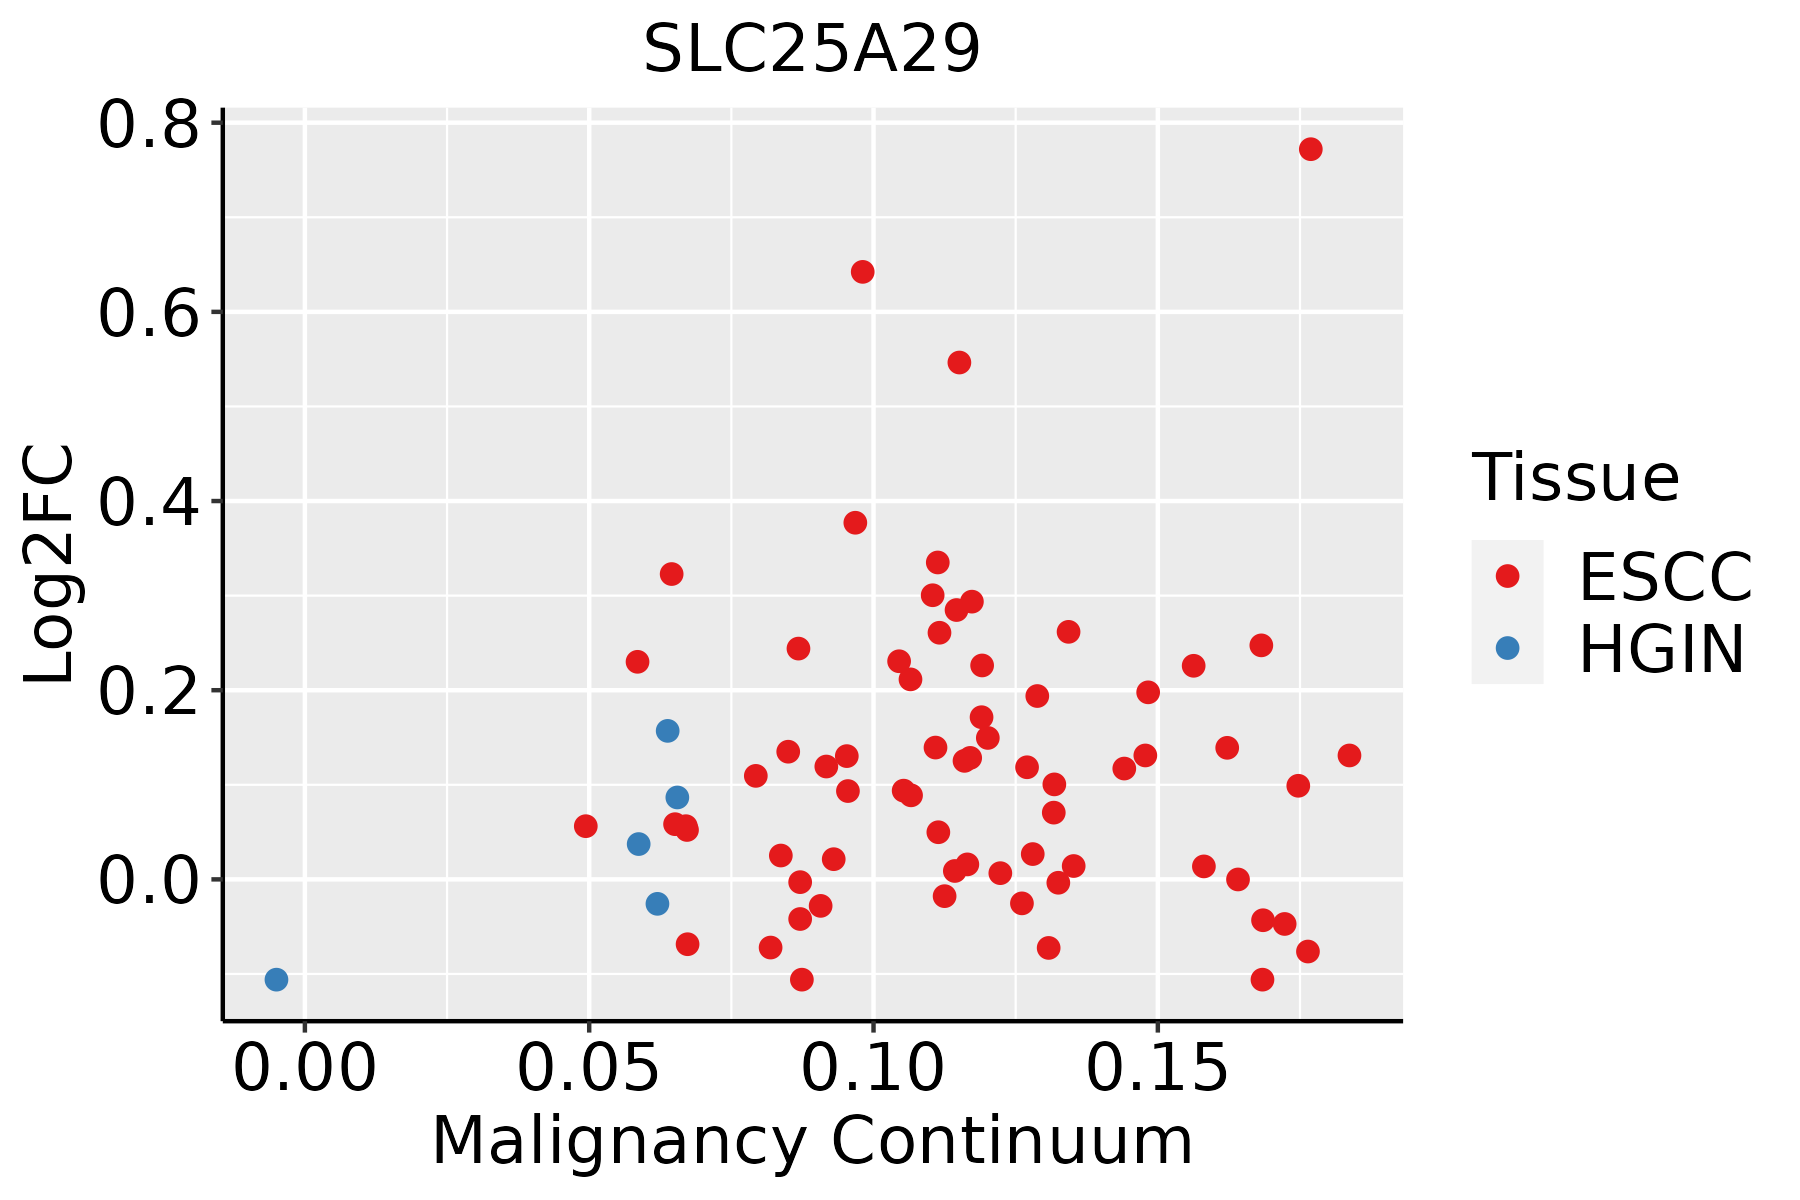 | ESCC: Esophageal squamous cell carcinoma |
| HGIN: High-grade intraepithelial neoplasias | ||
| LGIN: Low-grade intraepithelial neoplasias | ||
| Thyroid | 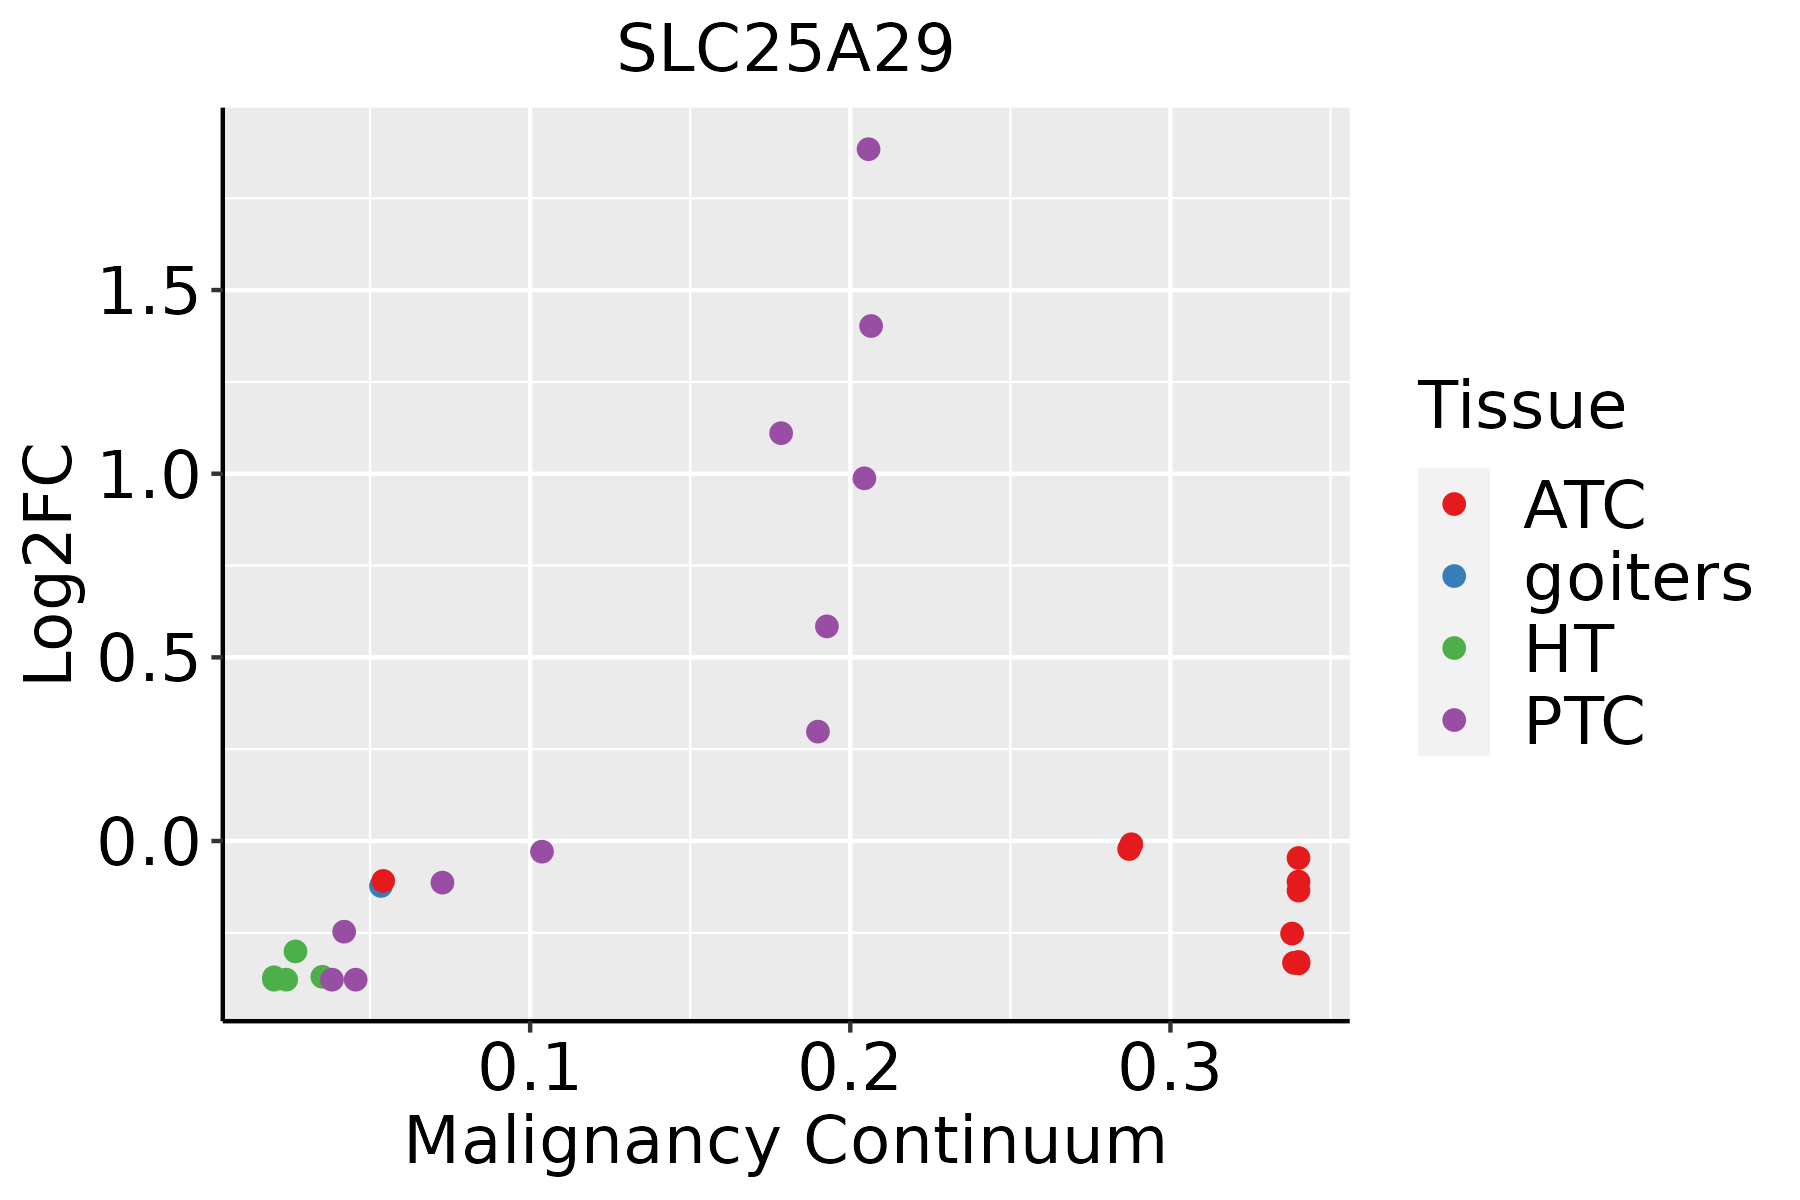 | ATC: Anaplastic thyroid cancer |
| HT: Hashimoto's thyroiditis | ||
| PTC: Papillary thyroid cancer |
| ∗log2FC in expression of this searched gene in stem-like cells from each diseased tissue sample relative to stem-like cells in normal samples in each tissue plotted against the malignancy continuum. Samples are colored based on if they are from different disease stage. |
Top |
Malignant transformation related pathway analysis |
| Find out the enriched GO biological processes and KEGG pathways involved in transition from healthy to precancer to cancer |
| Tissue | Disease Stage | Enriched GO biological Processes |
| Colorectum | AD |  |
| Colorectum | SER |  |
| Colorectum | MSS |  |
| Colorectum | MSI-H |  |
| Colorectum | FAP |  |
| ∗Top 15 enriched GO BP terms are showed in the bar plot of each disease state in each tissue. Each row represents a significant GO biological process which is colored according to the -log10(p.adjust). |
| Page: 1 2 3 4 5 6 7 8 9 |
| GO ID | Tissue | Disease Stage | Description | Gene Ratio | Bg Ratio | pvalue | p.adjust | Count |
| GO:000683910 | Endometrium | AEH | mitochondrial transport | 66/2100 | 254/18723 | 3.55e-11 | 4.96e-09 | 66 |
| GO:19905429 | Endometrium | AEH | mitochondrial transmembrane transport | 31/2100 | 102/18723 | 1.29e-07 | 5.97e-06 | 31 |
| GO:000683915 | Endometrium | EEC | mitochondrial transport | 67/2168 | 254/18723 | 5.04e-11 | 7.03e-09 | 67 |
| GO:199054216 | Endometrium | EEC | mitochondrial transmembrane transport | 31/2168 | 102/18723 | 2.65e-07 | 1.11e-05 | 31 |
| GO:0006839110 | Esophagus | ESCC | mitochondrial transport | 187/8552 | 254/18723 | 8.35e-20 | 9.81e-18 | 187 |
| GO:1990542110 | Esophagus | ESCC | mitochondrial transmembrane transport | 72/8552 | 102/18723 | 2.94e-07 | 4.23e-06 | 72 |
| GO:000683928 | Thyroid | PTC | mitochondrial transport | 150/5968 | 254/18723 | 2.76e-19 | 3.34e-17 | 150 |
| GO:199054225 | Thyroid | PTC | mitochondrial transmembrane transport | 57/5968 | 102/18723 | 4.49e-07 | 7.38e-06 | 57 |
| GO:000683929 | Thyroid | ATC | mitochondrial transport | 151/6293 | 254/18723 | 2.07e-17 | 2.14e-15 | 151 |
| GO:199054226 | Thyroid | ATC | mitochondrial transmembrane transport | 57/6293 | 102/18723 | 3.05e-06 | 3.49e-05 | 57 |
| Page: 1 |
| Pathway ID | Tissue | Disease Stage | Description | Gene Ratio | Bg Ratio | pvalue | p.adjust | qvalue | Count |
| hsa0471426 | Endometrium | AEH | Thermogenesis | 85/1197 | 232/8465 | 3.44e-18 | 9.33e-17 | 6.83e-17 | 85 |
| hsa04714111 | Endometrium | AEH | Thermogenesis | 85/1197 | 232/8465 | 3.44e-18 | 9.33e-17 | 6.83e-17 | 85 |
| hsa0471427 | Endometrium | EEC | Thermogenesis | 85/1237 | 232/8465 | 2.79e-17 | 7.05e-16 | 5.26e-16 | 85 |
| hsa0471436 | Endometrium | EEC | Thermogenesis | 85/1237 | 232/8465 | 2.79e-17 | 7.05e-16 | 5.26e-16 | 85 |
| hsa04714211 | Esophagus | ESCC | Thermogenesis | 163/4205 | 232/8465 | 9.22e-11 | 1.14e-09 | 5.86e-10 | 163 |
| hsa04714310 | Esophagus | ESCC | Thermogenesis | 163/4205 | 232/8465 | 9.22e-11 | 1.14e-09 | 5.86e-10 | 163 |
| Page: 1 |
Top |
Cell-cell communication analysis |
| Identification of potential cell-cell interactions between two cell types and their ligand-receptor pairs for different disease states |
| Ligand | Receptor | LRpair | Pathway | Tissue | Disease Stage |
| Page: 1 |
Top |
Single-cell gene regulatory network inference analysis |
| Find out the significant the regulons (TFs) and the target genes of each regulon across cell types for different disease states |
| TF | Cell Type | Tissue | Disease Stage | Target Gene | RSS | Regulon Activity |
| ∗The dot plots of a searched regulon are shown for all cell subpopulations in each disease state of each tissue based on the regulon specific score inferred using pySCENIC and by calculating the average expression. |
| Page: 1 |
Top |
Somatic mutation of malignant transformation related genes |
| Annotation of somatic variants for genes involved in malignant transformation |
| Hugo Symbol | Variant Class | Variant Classification | dbSNP RS | HGVSc | HGVSp | HGVSp Short | SWISSPROT | BIOTYPE | SIFT | PolyPhen | Tumor Sample Barcode | Tissue | Histology | Sex | Age | Stage | Therapy Types | Drugs | Outcome |
| SLC25A29 | SNV | Missense_Mutation | c.805G>A | p.Val269Ile | p.V269I | Q8N8R3 | protein_coding | deleterious(0.01) | probably_damaging(0.985) | TCGA-A6-5661-01 | Colorectum | colon adenocarcinoma | Female | >=65 | I/II | Unknown | Unknown | SD | |
| SLC25A29 | SNV | Missense_Mutation | novel | c.68N>G | p.Asp23Gly | p.D23G | Q8N8R3 | protein_coding | deleterious(0) | probably_damaging(1) | TCGA-AP-A0LM-01 | Endometrium | uterine corpus endometrioid carcinoma | Female | <65 | III/IV | Chemotherapy | cisplatin | SD |
| SLC25A29 | SNV | Missense_Mutation | novel | c.121G>A | p.Gly41Arg | p.G41R | Q8N8R3 | protein_coding | deleterious(0) | probably_damaging(0.999) | TCGA-AX-A1CE-01 | Endometrium | uterine corpus endometrioid carcinoma | Female | <65 | I/II | Unspecific | Paclitaxel | SD |
| SLC25A29 | SNV | Missense_Mutation | c.473N>C | p.Leu158Ser | p.L158S | Q8N8R3 | protein_coding | deleterious(0.01) | possibly_damaging(0.783) | TCGA-D1-A176-01 | Endometrium | uterine corpus endometrioid carcinoma | Female | >=65 | I/II | Unknown | Unknown | SD | |
| SLC25A29 | SNV | Missense_Mutation | novel | c.73N>A | p.Val25Ile | p.V25I | Q8N8R3 | protein_coding | tolerated(0.34) | possibly_damaging(0.735) | TCGA-FI-A2D0-01 | Endometrium | uterine corpus endometrioid carcinoma | Female | <65 | I/II | Unknown | Unknown | SD |
| SLC25A29 | SNV | Missense_Mutation | c.728G>A | p.Gly243Asp | p.G243D | Q8N8R3 | protein_coding | deleterious(0) | probably_damaging(0.999) | TCGA-DD-A73A-01 | Liver | liver hepatocellular carcinoma | Male | >=65 | I/II | Unknown | Unknown | SD | |
| SLC25A29 | SNV | Missense_Mutation | rs770340054 | c.80N>C | p.Val27Ala | p.V27A | Q8N8R3 | protein_coding | deleterious(0) | probably_damaging(0.991) | TCGA-BR-8372-01 | Stomach | stomach adenocarcinoma | Male | <65 | III/IV | Chemotherapy | etoposide | CR |
| Page: 1 |
Top |
Related drugs of malignant transformation related genes |
| Identification of chemicals and drugs interact with genes involved in malignant transfromation |
| (DGIdb 4.0) |
| Entrez ID | Symbol | Category | Interaction Types | Drug Claim Name | Drug Name | PMIDs |
| 123096 | SLC25A29 | TRANSPORTER, DRUGGABLE GENOME | PROPIONYL-L-CARNITINE |
| Page: 1 |

Copyright 2023-Present -The University of Texas Health Science Center at Houston |