
|
|||||
|
 | |
| |
| |
| |
| |
| |
|
Gene: SLC25A28 |
Gene summary for SLC25A28 |
| Gene information | Species | Human | Gene symbol | SLC25A28 | Gene ID | 81894 |
| Gene name | solute carrier family 25 member 28 | |
| Gene Alias | MFRN2 | |
| Cytomap | 10q24.2 | |
| Gene Type | protein-coding | GO ID | GO:0000041 | UniProtAcc | Q96A46 |
Top |
Malignant transformation analysis |
| Identification of the aberrant gene expression in precancerous and cancerous lesions by comparing the gene expression of stem-like cells in diseased tissues with normal stem cells |
| Entrez ID | Symbol | Replicates | Species | Organ | Tissue | Adj P-value | Log2FC | Malignancy |
| 81894 | SLC25A28 | HCC1_Meng | Human | Liver | HCC | 1.73e-19 | -1.98e-03 | 0.0246 |
| 81894 | SLC25A28 | HCC2_Meng | Human | Liver | HCC | 6.75e-11 | 7.83e-02 | 0.0107 |
| 81894 | SLC25A28 | HCC1 | Human | Liver | HCC | 7.86e-04 | 2.35e+00 | 0.5336 |
| 81894 | SLC25A28 | HCC2 | Human | Liver | HCC | 5.98e-03 | 1.98e+00 | 0.5341 |
| 81894 | SLC25A28 | S014 | Human | Liver | HCC | 5.42e-03 | 2.31e-01 | 0.2254 |
| 81894 | SLC25A28 | S028 | Human | Liver | HCC | 7.81e-04 | 2.95e-01 | 0.2503 |
| 81894 | SLC25A28 | S029 | Human | Liver | HCC | 4.31e-06 | 5.22e-01 | 0.2581 |
| 81894 | SLC25A28 | C04 | Human | Oral cavity | OSCC | 1.49e-05 | 4.06e-01 | 0.2633 |
| 81894 | SLC25A28 | C21 | Human | Oral cavity | OSCC | 1.51e-08 | 3.65e-01 | 0.2678 |
| 81894 | SLC25A28 | C30 | Human | Oral cavity | OSCC | 1.53e-32 | 1.22e+00 | 0.3055 |
| 81894 | SLC25A28 | C38 | Human | Oral cavity | OSCC | 1.41e-03 | 4.78e-01 | 0.172 |
| 81894 | SLC25A28 | C46 | Human | Oral cavity | OSCC | 3.57e-14 | 3.97e-01 | 0.1673 |
| 81894 | SLC25A28 | C51 | Human | Oral cavity | OSCC | 8.92e-06 | 4.35e-01 | 0.2674 |
| 81894 | SLC25A28 | C06 | Human | Oral cavity | OSCC | 1.76e-02 | 6.27e-01 | 0.2699 |
| 81894 | SLC25A28 | C08 | Human | Oral cavity | OSCC | 2.85e-10 | 3.88e-01 | 0.1919 |
| 81894 | SLC25A28 | C09 | Human | Oral cavity | OSCC | 1.88e-02 | 1.37e-01 | 0.1431 |
| 81894 | SLC25A28 | LN22 | Human | Oral cavity | OSCC | 2.78e-05 | 7.18e-01 | 0.1733 |
| 81894 | SLC25A28 | LN38 | Human | Oral cavity | OSCC | 1.13e-02 | 4.30e-01 | 0.168 |
| 81894 | SLC25A28 | LN46 | Human | Oral cavity | OSCC | 7.50e-16 | 7.16e-01 | 0.1666 |
| 81894 | SLC25A28 | SYSMH1 | Human | Oral cavity | OSCC | 1.79e-20 | 3.62e-01 | 0.1127 |
| Page: 1 2 |
| Tissue | Expression Dynamics | Abbreviation |
| Liver |  | HCC: Hepatocellular carcinoma |
| NAFLD: Non-alcoholic fatty liver disease | ||
| Oral Cavity |  | EOLP: Erosive Oral lichen planus |
| LP: leukoplakia | ||
| NEOLP: Non-erosive oral lichen planus | ||
| OSCC: Oral squamous cell carcinoma | ||
| Thyroid | 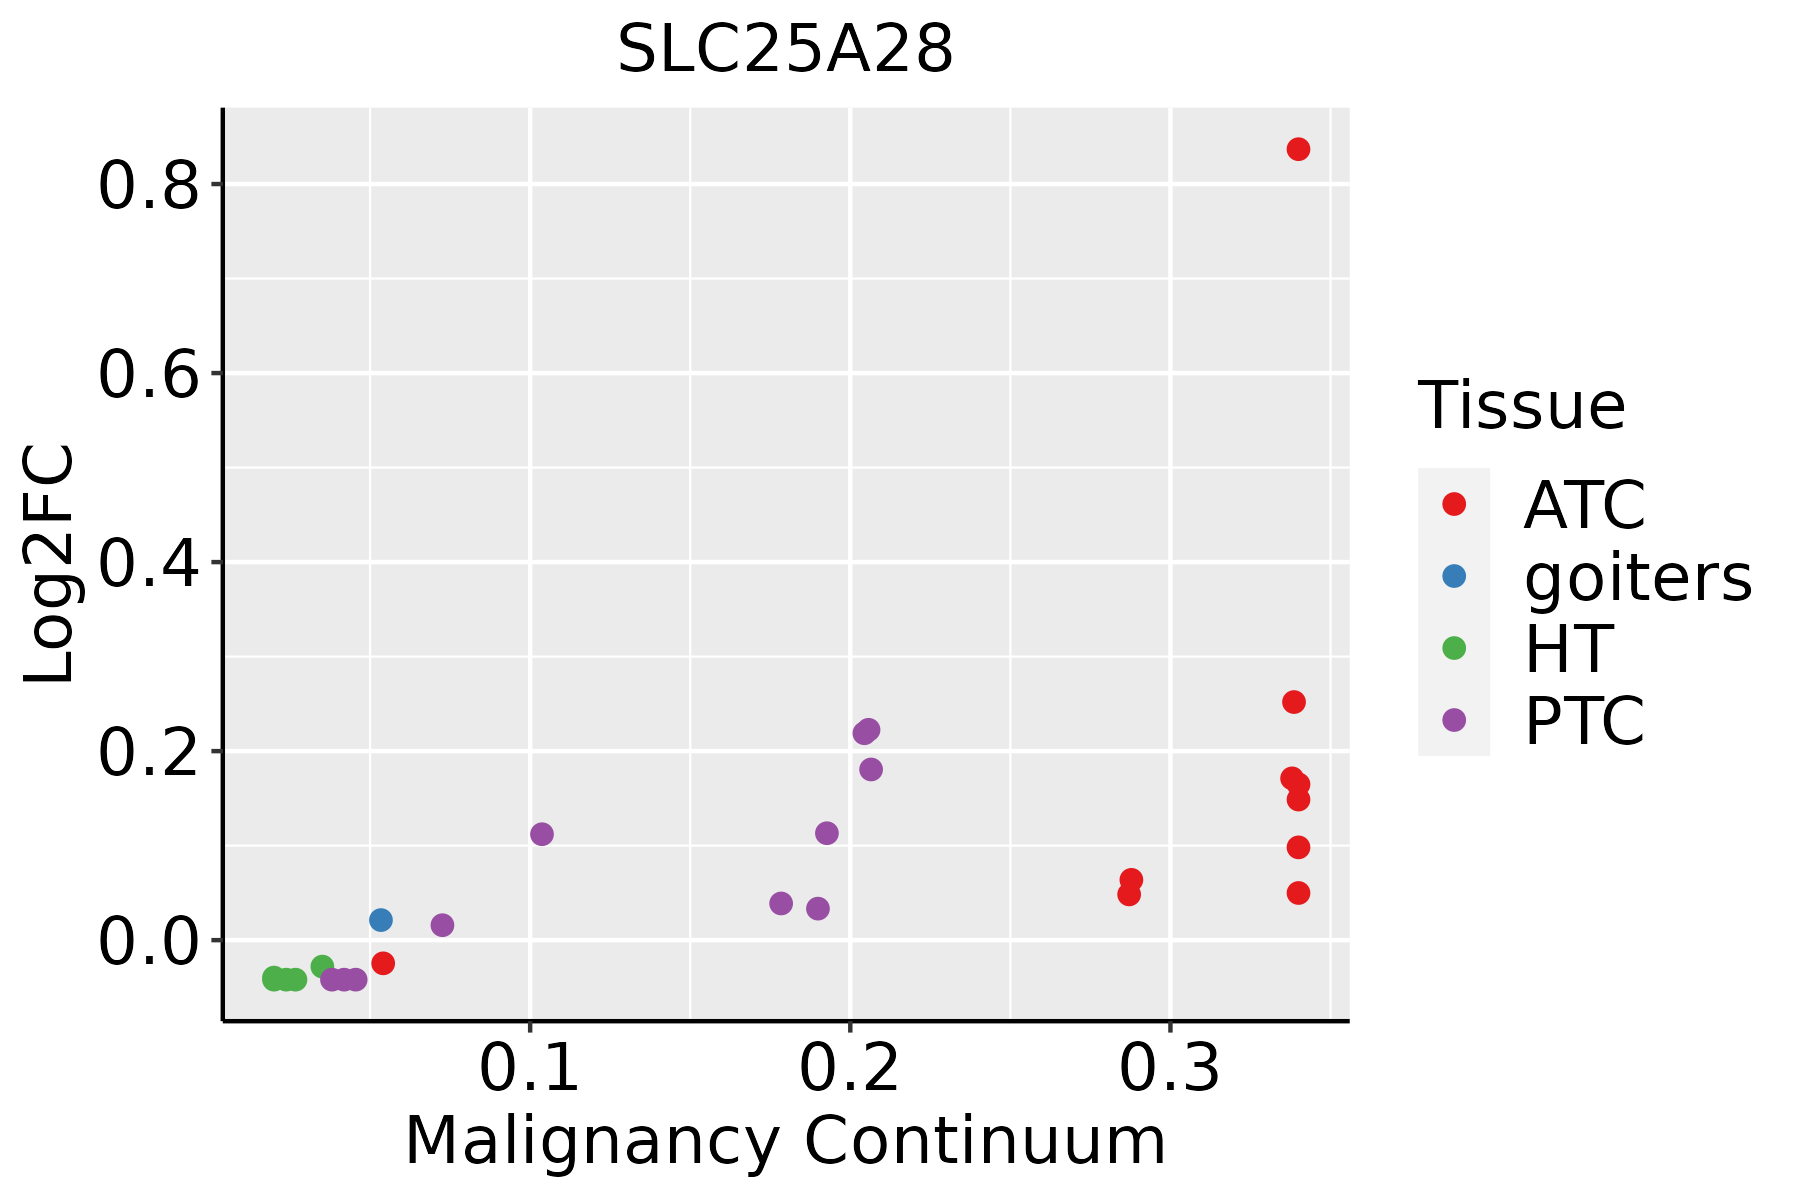 | ATC: Anaplastic thyroid cancer |
| HT: Hashimoto's thyroiditis | ||
| PTC: Papillary thyroid cancer |
| ∗log2FC in expression of this searched gene in stem-like cells from each diseased tissue sample relative to stem-like cells in normal samples in each tissue plotted against the malignancy continuum. Samples are colored based on if they are from different disease stage. |
Top |
Malignant transformation related pathway analysis |
| Find out the enriched GO biological processes and KEGG pathways involved in transition from healthy to precancer to cancer |
| Tissue | Disease Stage | Enriched GO biological Processes |
| Colorectum | AD |  |
| Colorectum | SER |  |
| Colorectum | MSS |  |
| Colorectum | MSI-H |  |
| Colorectum | FAP |  |
| ∗Top 15 enriched GO BP terms are showed in the bar plot of each disease state in each tissue. Each row represents a significant GO biological process which is colored according to the -log10(p.adjust). |
| Page: 1 2 3 4 5 6 7 8 9 |
| GO ID | Tissue | Disease Stage | Description | Gene Ratio | Bg Ratio | pvalue | p.adjust | Count |
| GO:000683912 | Liver | HCC | mitochondrial transport | 184/7958 | 254/18723 | 2.30e-22 | 3.83e-20 | 184 |
| GO:199054212 | Liver | HCC | mitochondrial transmembrane transport | 78/7958 | 102/18723 | 2.73e-12 | 1.26e-10 | 78 |
| GO:005507612 | Liver | HCC | transition metal ion homeostasis | 81/7958 | 138/18723 | 8.87e-05 | 7.72e-04 | 81 |
| GO:00000411 | Liver | HCC | transition metal ion transport | 59/7958 | 105/18723 | 3.18e-03 | 1.47e-02 | 59 |
| GO:00068261 | Liver | HCC | iron ion transport | 34/7958 | 58/18723 | 9.66e-03 | 3.63e-02 | 34 |
| GO:005507211 | Liver | HCC | iron ion homeostasis | 47/7958 | 85/18723 | 1.17e-02 | 4.28e-02 | 47 |
| GO:000683918 | Oral cavity | OSCC | mitochondrial transport | 162/7305 | 254/18723 | 8.96e-16 | 6.52e-14 | 162 |
| GO:005507610 | Oral cavity | OSCC | transition metal ion homeostasis | 81/7305 | 138/18723 | 2.13e-06 | 2.72e-05 | 81 |
| GO:199054218 | Oral cavity | OSCC | mitochondrial transmembrane transport | 56/7305 | 102/18723 | 8.06e-04 | 4.32e-03 | 56 |
| GO:00550728 | Oral cavity | OSCC | iron ion homeostasis | 46/7305 | 85/18723 | 3.31e-03 | 1.42e-02 | 46 |
| GO:000683928 | Thyroid | PTC | mitochondrial transport | 150/5968 | 254/18723 | 2.76e-19 | 3.34e-17 | 150 |
| GO:199054225 | Thyroid | PTC | mitochondrial transmembrane transport | 57/5968 | 102/18723 | 4.49e-07 | 7.38e-06 | 57 |
| GO:0055076110 | Thyroid | PTC | transition metal ion homeostasis | 62/5968 | 138/18723 | 8.66e-04 | 5.30e-03 | 62 |
| GO:005507210 | Thyroid | PTC | iron ion homeostasis | 39/5968 | 85/18723 | 4.71e-03 | 2.21e-02 | 39 |
| GO:000683929 | Thyroid | ATC | mitochondrial transport | 151/6293 | 254/18723 | 2.07e-17 | 2.14e-15 | 151 |
| GO:199054226 | Thyroid | ATC | mitochondrial transmembrane transport | 57/6293 | 102/18723 | 3.05e-06 | 3.49e-05 | 57 |
| GO:005507632 | Thyroid | ATC | transition metal ion homeostasis | 66/6293 | 138/18723 | 3.64e-04 | 2.25e-03 | 66 |
| GO:005507214 | Thyroid | ATC | iron ion homeostasis | 41/6293 | 85/18723 | 3.62e-03 | 1.58e-02 | 41 |
| Page: 1 |
| Pathway ID | Tissue | Disease Stage | Description | Gene Ratio | Bg Ratio | pvalue | p.adjust | qvalue | Count |
| Page: 1 |
Top |
Cell-cell communication analysis |
| Identification of potential cell-cell interactions between two cell types and their ligand-receptor pairs for different disease states |
| Ligand | Receptor | LRpair | Pathway | Tissue | Disease Stage |
| Page: 1 |
Top |
Single-cell gene regulatory network inference analysis |
| Find out the significant the regulons (TFs) and the target genes of each regulon across cell types for different disease states |
| TF | Cell Type | Tissue | Disease Stage | Target Gene | RSS | Regulon Activity |
| ∗The dot plots of a searched regulon are shown for all cell subpopulations in each disease state of each tissue based on the regulon specific score inferred using pySCENIC and by calculating the average expression. |
| Page: 1 |
Top |
Somatic mutation of malignant transformation related genes |
| Annotation of somatic variants for genes involved in malignant transformation |
| Hugo Symbol | Variant Class | Variant Classification | dbSNP RS | HGVSc | HGVSp | HGVSp Short | SWISSPROT | BIOTYPE | SIFT | PolyPhen | Tumor Sample Barcode | Tissue | Histology | Sex | Age | Stage | Therapy Types | Drugs | Outcome |
| SLC25A28 | SNV | Missense_Mutation | c.898C>G | p.His300Asp | p.H300D | Q96A46 | protein_coding | tolerated(0.28) | benign(0.145) | TCGA-A8-A06Z-01 | Breast | breast invasive carcinoma | Female | >=65 | I/II | Unknown | Unknown | SD | |
| SLC25A28 | SNV | Missense_Mutation | rs375360825 | c.335N>A | p.Arg112His | p.R112H | Q96A46 | protein_coding | deleterious(0.05) | possibly_damaging(0.806) | TCGA-AA-3984-01 | Colorectum | colon adenocarcinoma | Female | <65 | I/II | Unknown | Unknown | SD |
| SLC25A28 | SNV | Missense_Mutation | rs764564076 | c.664G>A | p.Gly222Arg | p.G222R | Q96A46 | protein_coding | tolerated(0.4) | benign(0.031) | TCGA-AA-A01I-01 | Colorectum | colon adenocarcinoma | Male | >=65 | I/II | Unknown | Unknown | SD |
| SLC25A28 | SNV | Missense_Mutation | c.706G>A | p.Val236Ile | p.V236I | Q96A46 | protein_coding | tolerated(0.78) | benign(0.029) | TCGA-CK-5916-01 | Colorectum | colon adenocarcinoma | Female | >=65 | I/II | Unknown | Unknown | PD | |
| SLC25A28 | SNV | Missense_Mutation | c.659N>T | p.Gly220Val | p.G220V | Q96A46 | protein_coding | deleterious(0) | probably_damaging(1) | TCGA-F4-6807-01 | Colorectum | colon adenocarcinoma | Female | <65 | III/IV | Chemotherapy | xeloda | CR | |
| SLC25A28 | SNV | Missense_Mutation | c.701N>C | p.Met234Thr | p.M234T | Q96A46 | protein_coding | deleterious(0.02) | probably_damaging(0.996) | TCGA-NH-A5IV-01 | Colorectum | colon adenocarcinoma | Female | >=65 | I/II | Unknown | Unknown | SD | |
| SLC25A28 | SNV | Missense_Mutation | c.360N>C | p.Arg120Ser | p.R120S | Q96A46 | protein_coding | tolerated(0.17) | benign(0.017) | TCGA-AG-3878-01 | Colorectum | rectum adenocarcinoma | Male | <65 | I/II | Unknown | Unknown | SD | |
| SLC25A28 | SNV | Missense_Mutation | novel | c.358N>G | p.Arg120Gly | p.R120G | Q96A46 | protein_coding | deleterious(0.02) | benign(0.012) | TCGA-AG-3878-01 | Colorectum | rectum adenocarcinoma | Male | <65 | I/II | Unknown | Unknown | SD |
| SLC25A28 | SNV | Missense_Mutation | c.619C>T | p.Arg207Trp | p.R207W | Q96A46 | protein_coding | deleterious(0) | probably_damaging(0.948) | TCGA-EI-6882-01 | Colorectum | rectum adenocarcinoma | Male | <65 | I/II | Unknown | Unknown | SD | |
| SLC25A28 | deletion | Frame_Shift_Del | c.766delN | p.Gln256ArgfsTer19 | p.Q256Rfs*19 | Q96A46 | protein_coding | TCGA-AD-6889-01 | Colorectum | colon adenocarcinoma | Male | >=65 | I/II | Chemotherapy | xeloda | PD |
| Page: 1 2 3 4 |
Top |
Related drugs of malignant transformation related genes |
| Identification of chemicals and drugs interact with genes involved in malignant transfromation |
| (DGIdb 4.0) |
| Entrez ID | Symbol | Category | Interaction Types | Drug Claim Name | Drug Name | PMIDs |
| Page: 1 |

Copyright 2023-Present -The University of Texas Health Science Center at Houston |