
|
|||||
|
 | |
| |
| |
| |
| |
| |
|
Gene: SLC25A26 |
Gene summary for SLC25A26 |
| Gene information | Species | Human | Gene symbol | SLC25A26 | Gene ID | 115286 |
| Gene name | solute carrier family 25 member 26 | |
| Gene Alias | COXPD28 | |
| Cytomap | 3p14.1 | |
| Gene Type | protein-coding | GO ID | GO:0006810 | UniProtAcc | Q70HW3 |
Top |
Malignant transformation analysis |
| Identification of the aberrant gene expression in precancerous and cancerous lesions by comparing the gene expression of stem-like cells in diseased tissues with normal stem cells |
| Entrez ID | Symbol | Replicates | Species | Organ | Tissue | Adj P-value | Log2FC | Malignancy |
| 115286 | SLC25A26 | LZE4T | Human | Esophagus | ESCC | 5.46e-10 | 1.07e-01 | 0.0811 |
| 115286 | SLC25A26 | LZE7T | Human | Esophagus | ESCC | 7.15e-03 | 7.73e-02 | 0.0667 |
| 115286 | SLC25A26 | LZE8T | Human | Esophagus | ESCC | 3.34e-02 | 1.77e-03 | 0.067 |
| 115286 | SLC25A26 | LZE24T | Human | Esophagus | ESCC | 1.31e-12 | 2.61e-01 | 0.0596 |
| 115286 | SLC25A26 | P2T-E | Human | Esophagus | ESCC | 9.86e-14 | 2.18e-01 | 0.1177 |
| 115286 | SLC25A26 | P4T-E | Human | Esophagus | ESCC | 1.25e-19 | 3.11e-01 | 0.1323 |
| 115286 | SLC25A26 | P5T-E | Human | Esophagus | ESCC | 4.62e-09 | 1.01e-01 | 0.1327 |
| 115286 | SLC25A26 | P8T-E | Human | Esophagus | ESCC | 4.18e-18 | 1.77e-01 | 0.0889 |
| 115286 | SLC25A26 | P9T-E | Human | Esophagus | ESCC | 1.81e-11 | 1.66e-01 | 0.1131 |
| 115286 | SLC25A26 | P10T-E | Human | Esophagus | ESCC | 1.19e-20 | 1.73e-01 | 0.116 |
| 115286 | SLC25A26 | P11T-E | Human | Esophagus | ESCC | 5.63e-08 | 3.24e-01 | 0.1426 |
| 115286 | SLC25A26 | P12T-E | Human | Esophagus | ESCC | 1.75e-17 | 2.30e-01 | 0.1122 |
| 115286 | SLC25A26 | P15T-E | Human | Esophagus | ESCC | 2.83e-16 | 2.47e-01 | 0.1149 |
| 115286 | SLC25A26 | P16T-E | Human | Esophagus | ESCC | 8.20e-11 | 6.82e-02 | 0.1153 |
| 115286 | SLC25A26 | P17T-E | Human | Esophagus | ESCC | 6.86e-05 | 1.30e-01 | 0.1278 |
| 115286 | SLC25A26 | P19T-E | Human | Esophagus | ESCC | 7.41e-04 | 3.09e-01 | 0.1662 |
| 115286 | SLC25A26 | P20T-E | Human | Esophagus | ESCC | 6.85e-17 | 2.42e-01 | 0.1124 |
| 115286 | SLC25A26 | P21T-E | Human | Esophagus | ESCC | 6.75e-27 | 4.68e-01 | 0.1617 |
| 115286 | SLC25A26 | P22T-E | Human | Esophagus | ESCC | 5.54e-13 | 2.00e-01 | 0.1236 |
| 115286 | SLC25A26 | P23T-E | Human | Esophagus | ESCC | 4.83e-20 | 5.03e-01 | 0.108 |
| Page: 1 2 3 4 5 |
| Tissue | Expression Dynamics | Abbreviation |
| Esophagus | 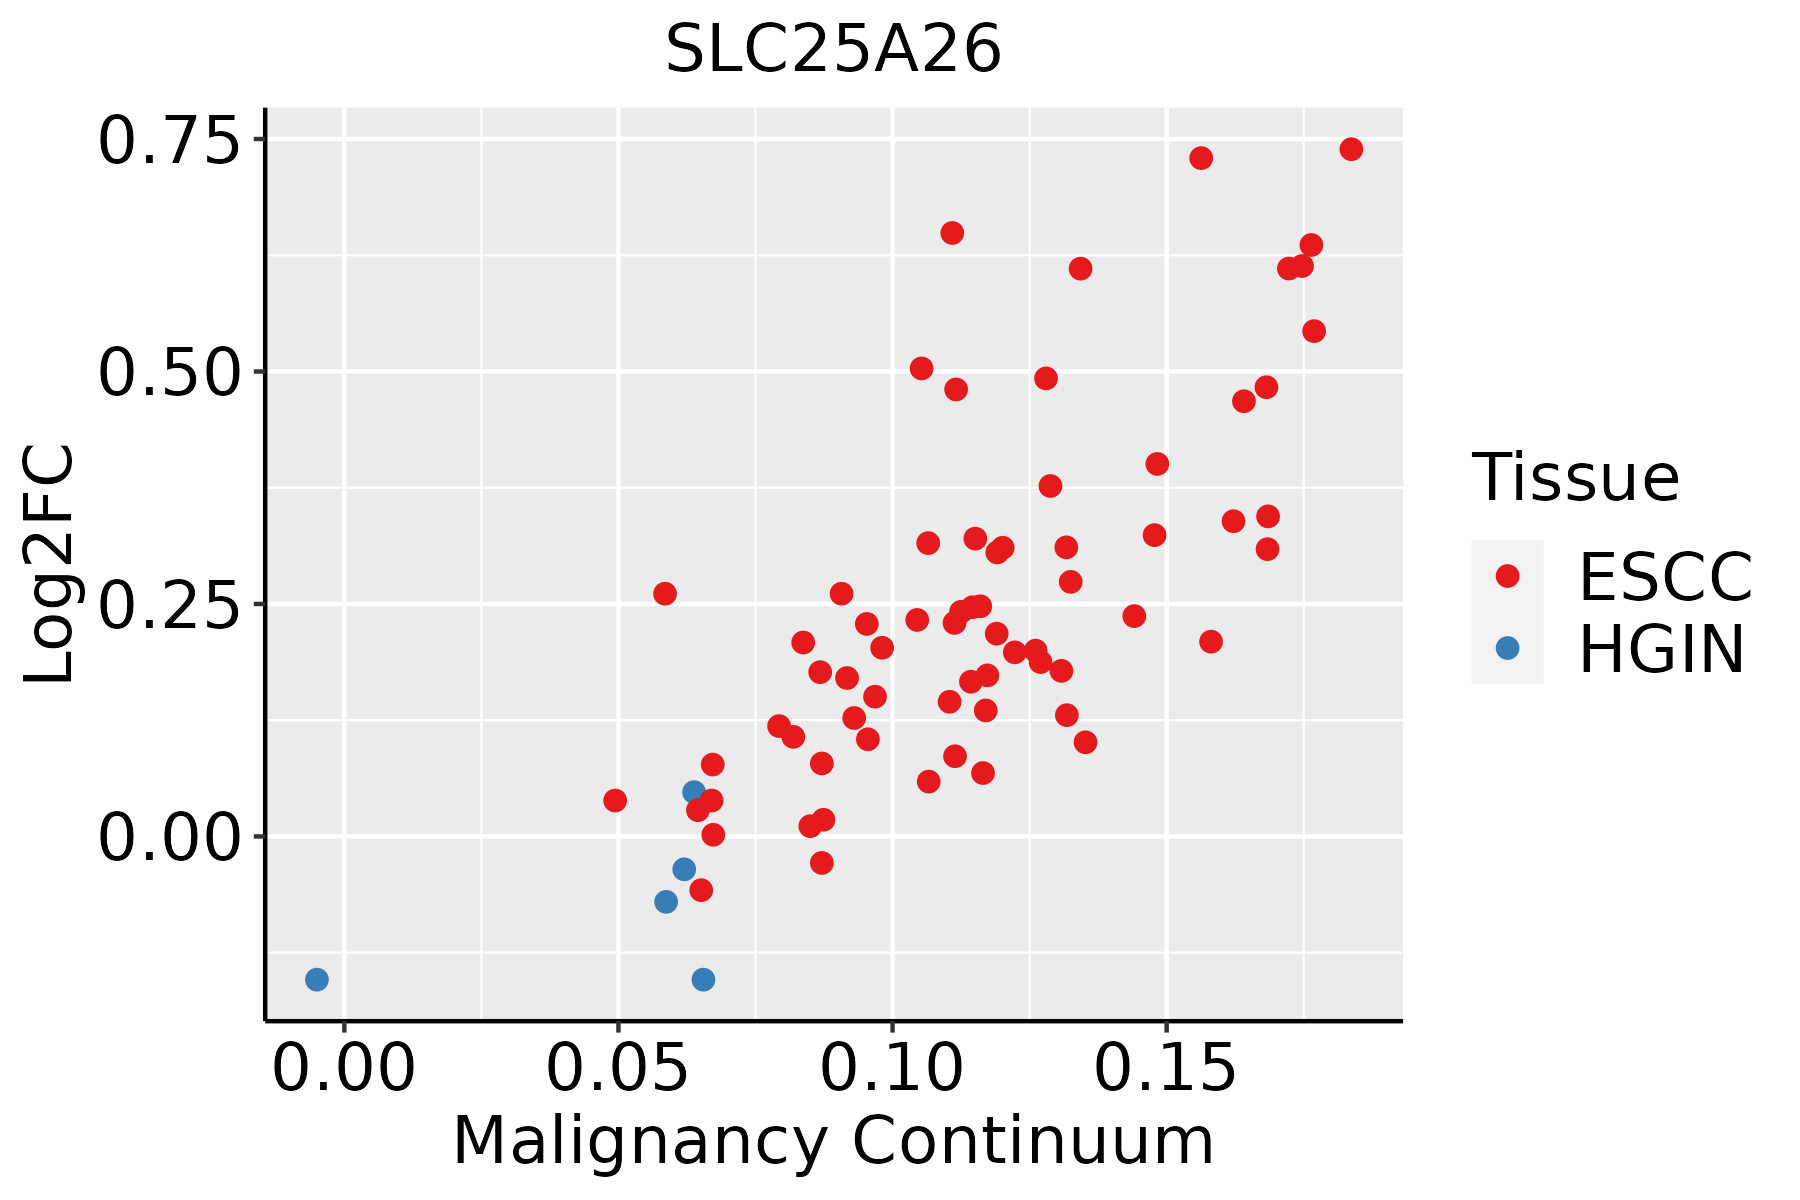 | ESCC: Esophageal squamous cell carcinoma |
| HGIN: High-grade intraepithelial neoplasias | ||
| LGIN: Low-grade intraepithelial neoplasias | ||
| Liver | 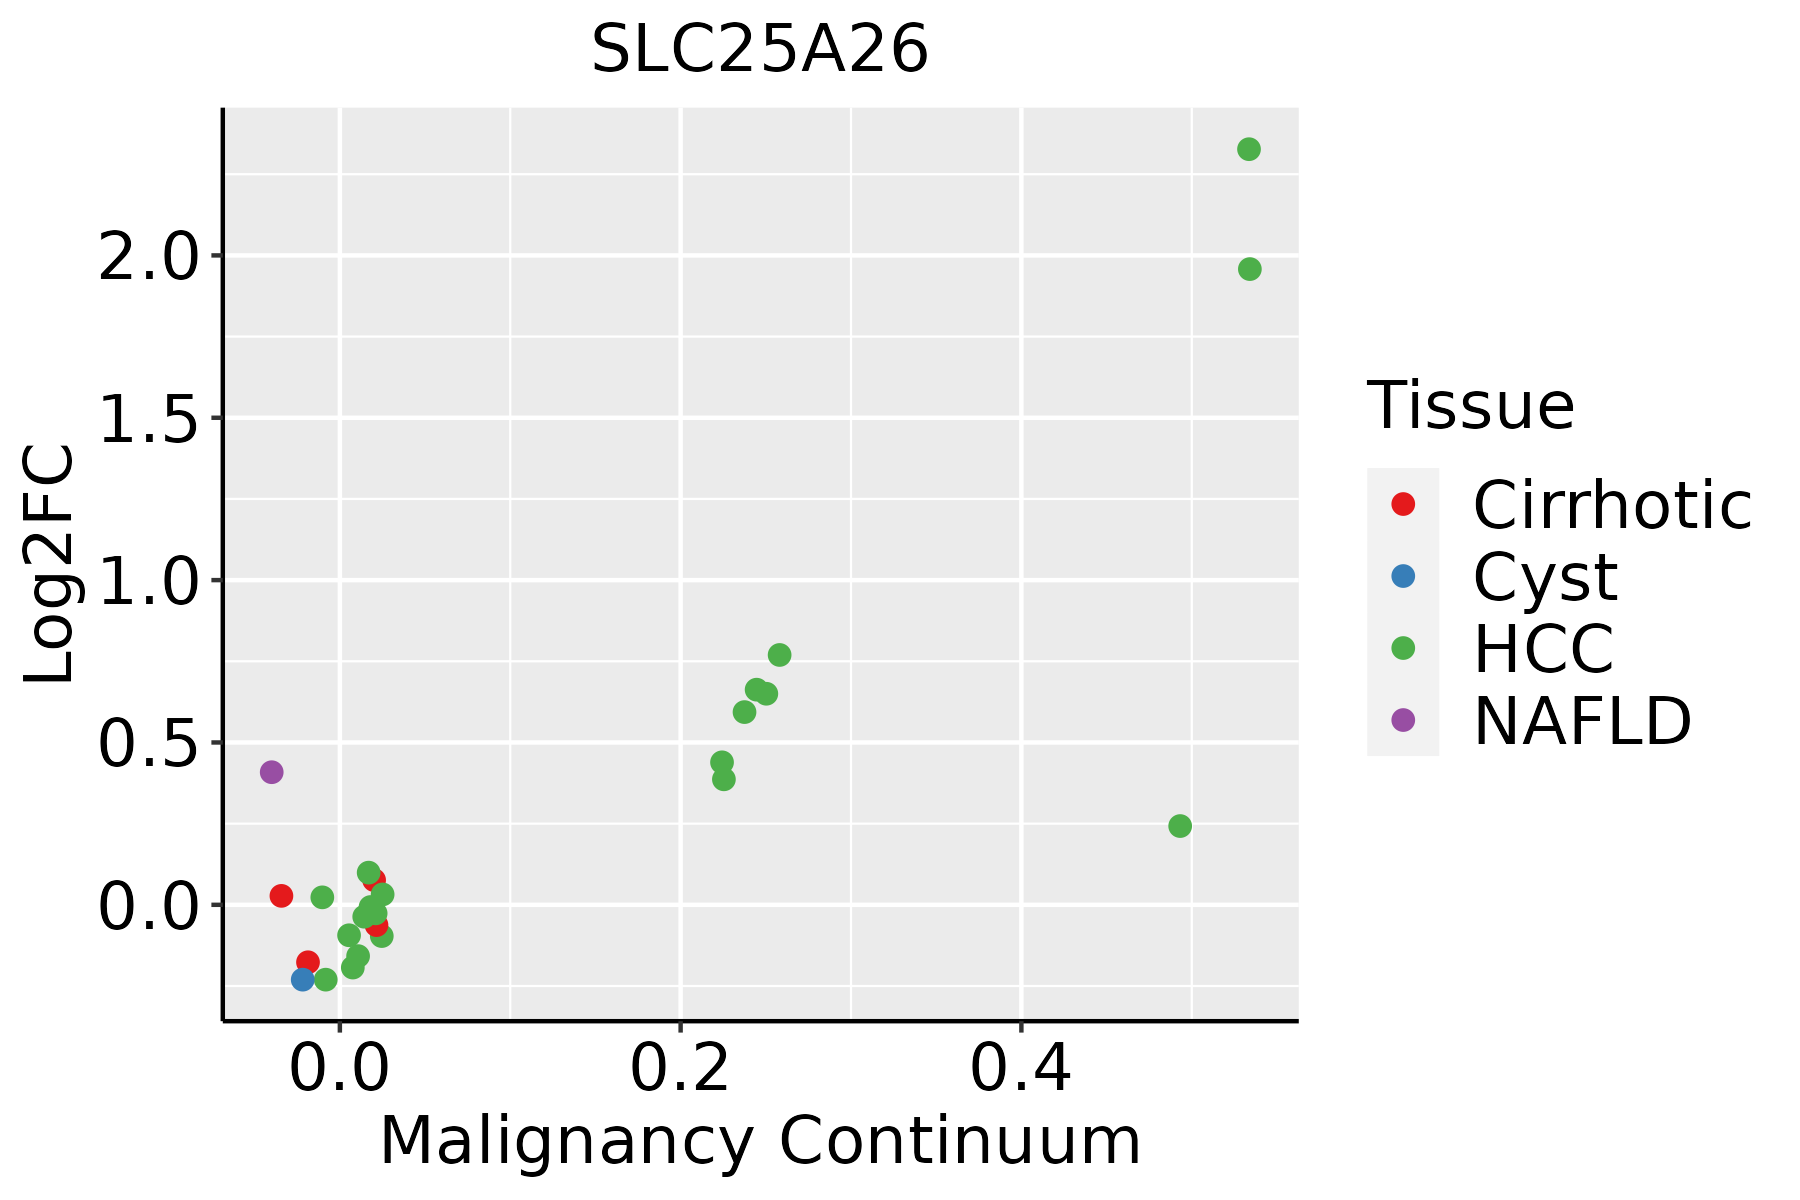 | HCC: Hepatocellular carcinoma |
| NAFLD: Non-alcoholic fatty liver disease | ||
| Oral Cavity | 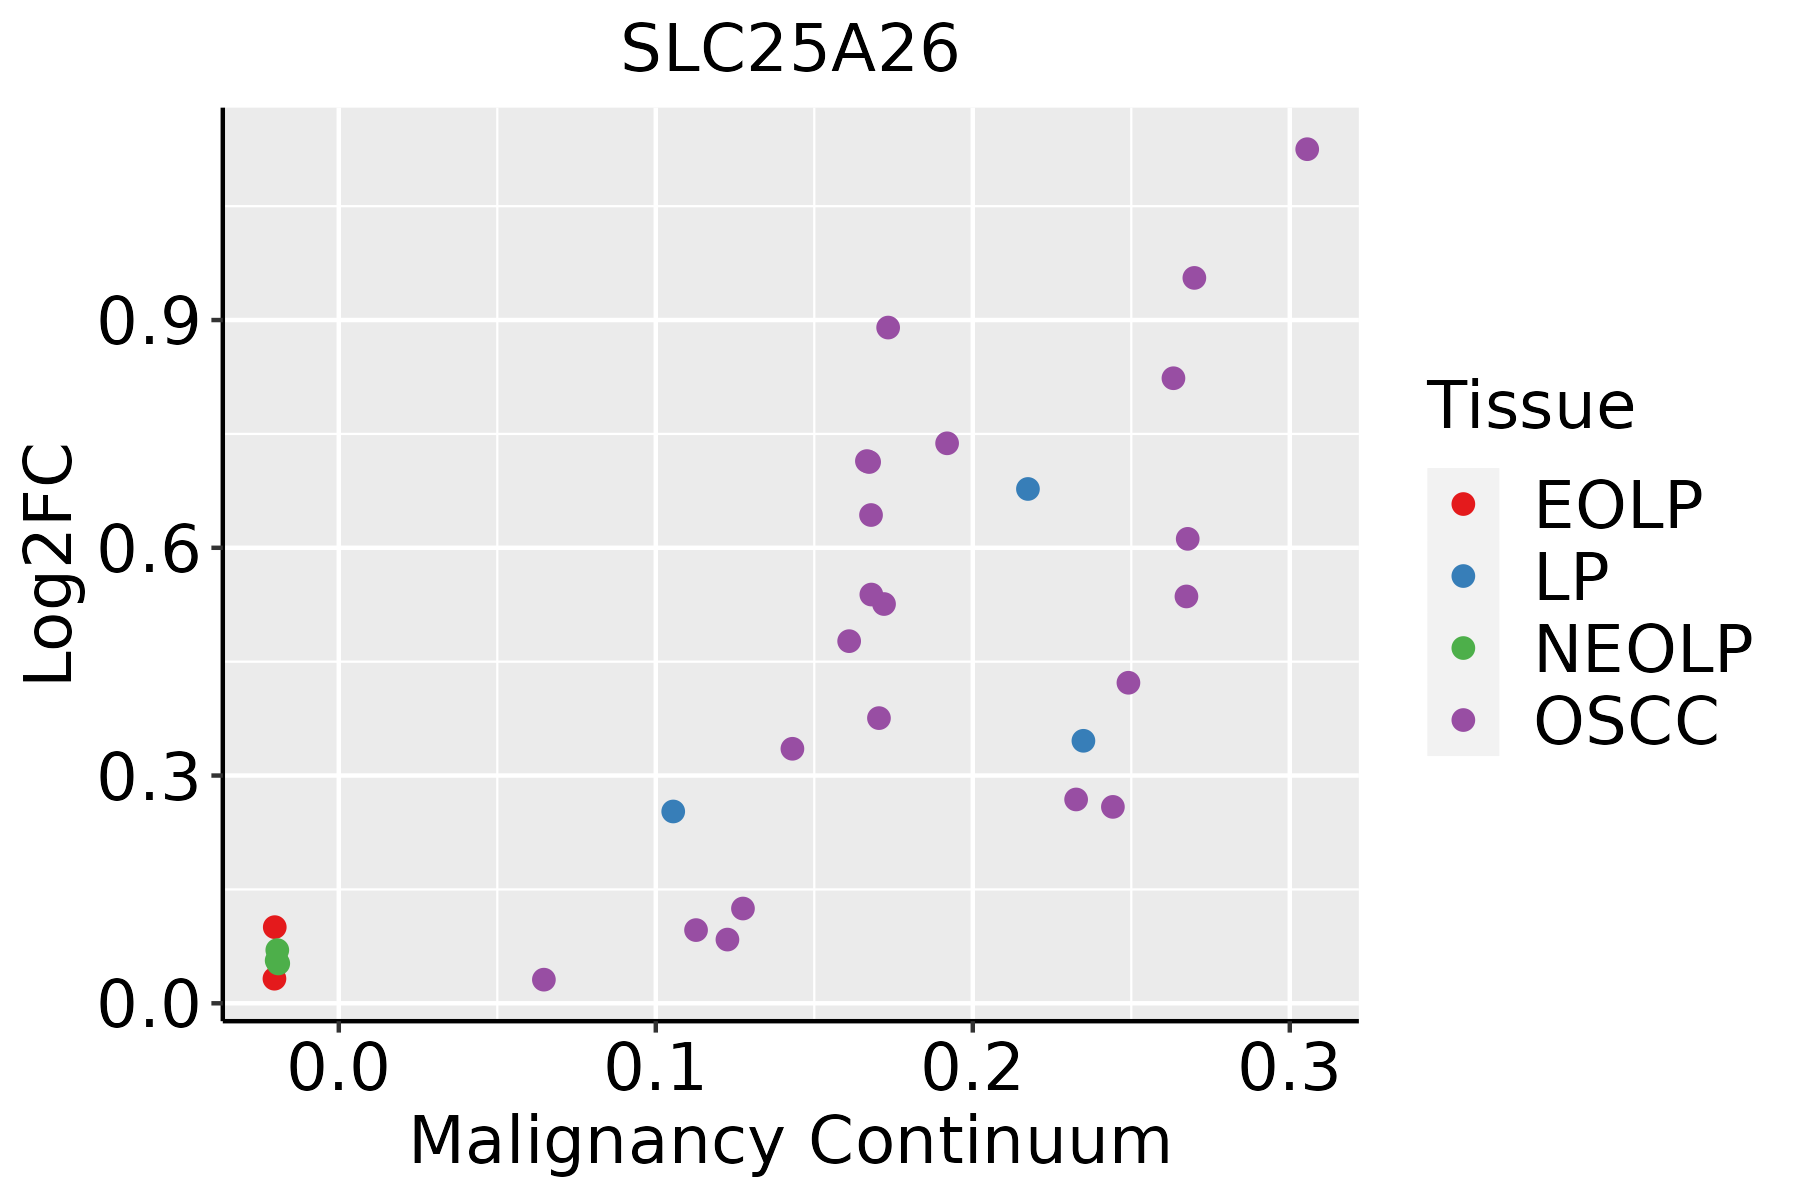 | EOLP: Erosive Oral lichen planus |
| LP: leukoplakia | ||
| NEOLP: Non-erosive oral lichen planus | ||
| OSCC: Oral squamous cell carcinoma | ||
| Skin | 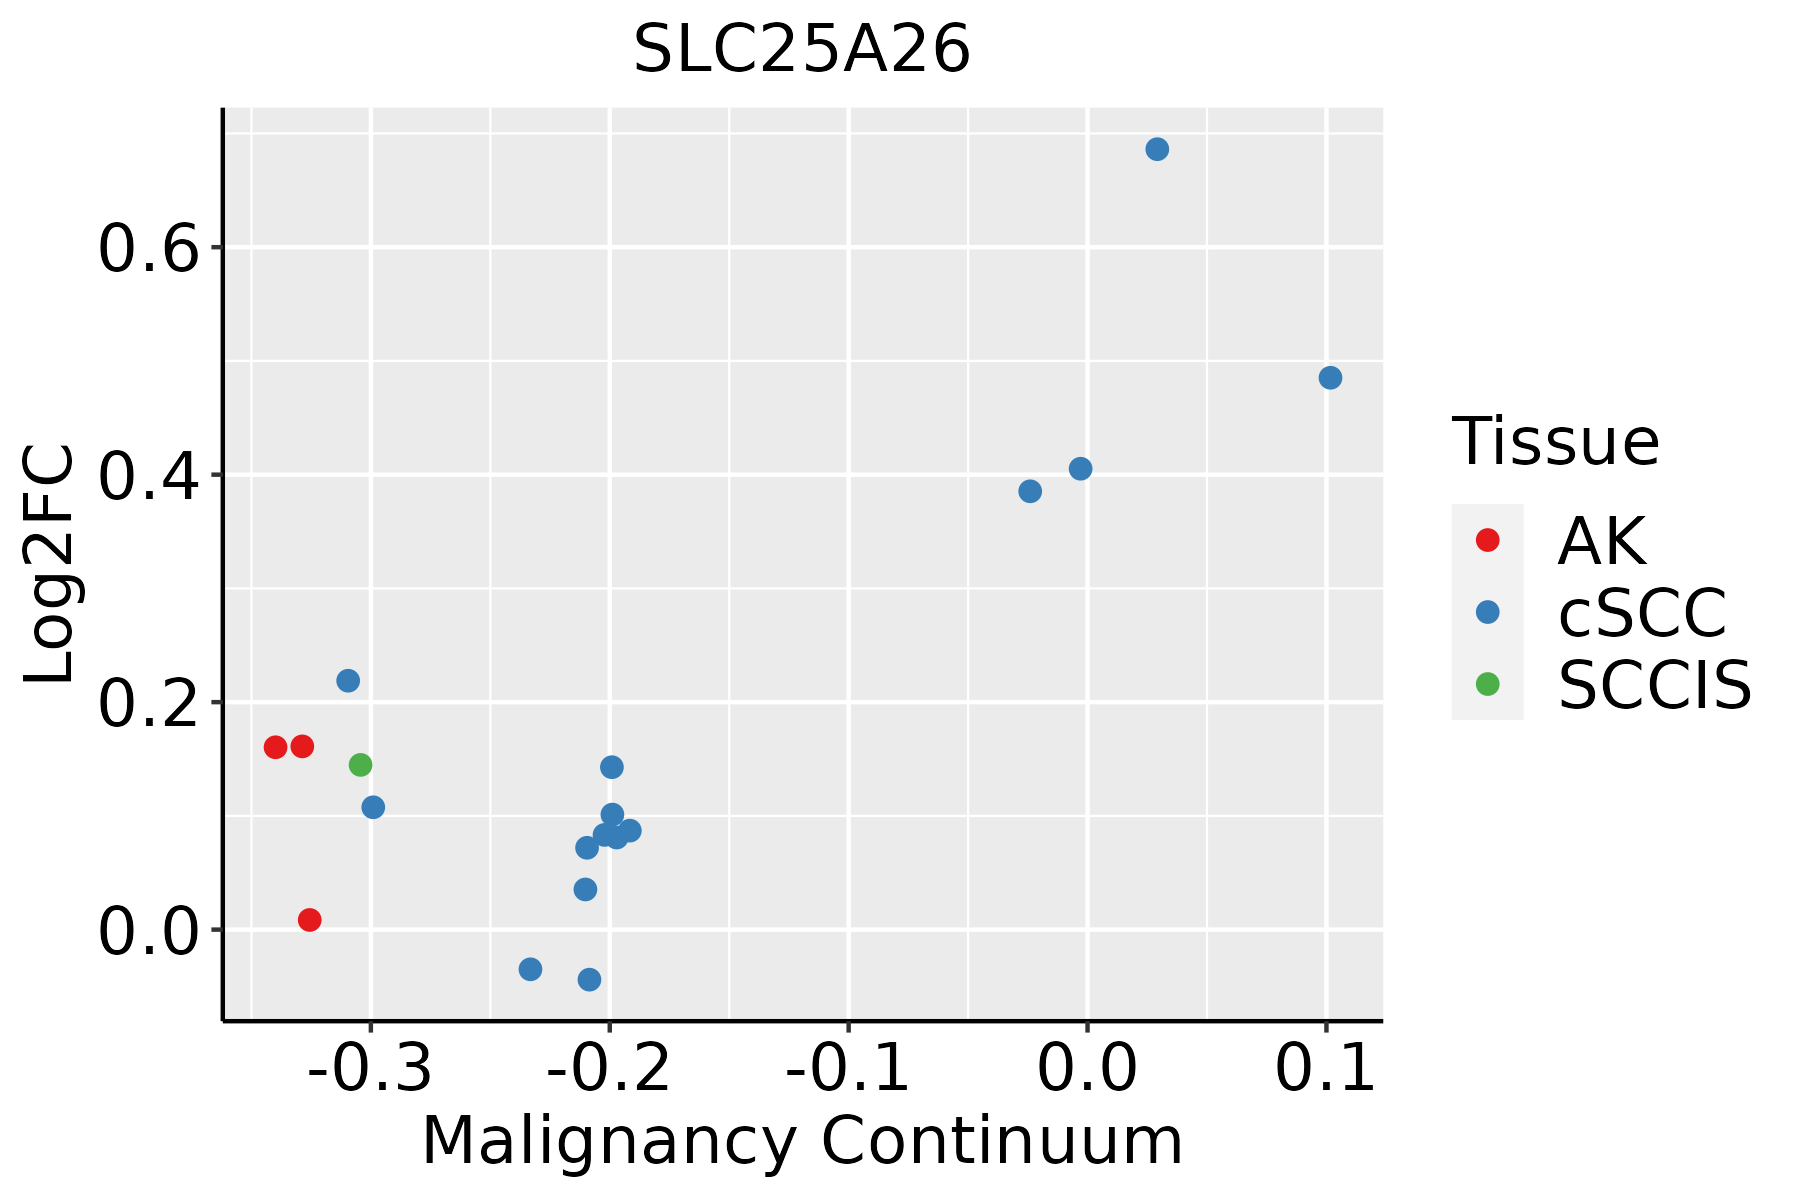 | AK: Actinic keratosis |
| cSCC: Cutaneous squamous cell carcinoma | ||
| SCCIS:squamous cell carcinoma in situ |
| ∗log2FC in expression of this searched gene in stem-like cells from each diseased tissue sample relative to stem-like cells in normal samples in each tissue plotted against the malignancy continuum. Samples are colored based on if they are from different disease stage. |
Top |
Malignant transformation related pathway analysis |
| Find out the enriched GO biological processes and KEGG pathways involved in transition from healthy to precancer to cancer |
| Tissue | Disease Stage | Enriched GO biological Processes |
| Colorectum | AD |  |
| Colorectum | SER |  |
| Colorectum | MSS |  |
| Colorectum | MSI-H |  |
| Colorectum | FAP |  |
| ∗Top 15 enriched GO BP terms are showed in the bar plot of each disease state in each tissue. Each row represents a significant GO biological process which is colored according to the -log10(p.adjust). |
| Page: 1 2 3 4 5 6 7 8 9 |
| GO ID | Tissue | Disease Stage | Description | Gene Ratio | Bg Ratio | pvalue | p.adjust | Count |
| Page: 1 |
| Pathway ID | Tissue | Disease Stage | Description | Gene Ratio | Bg Ratio | pvalue | p.adjust | qvalue | Count |
| Page: 1 |
Top |
Cell-cell communication analysis |
| Identification of potential cell-cell interactions between two cell types and their ligand-receptor pairs for different disease states |
| Ligand | Receptor | LRpair | Pathway | Tissue | Disease Stage |
| Page: 1 |
Top |
Single-cell gene regulatory network inference analysis |
| Find out the significant the regulons (TFs) and the target genes of each regulon across cell types for different disease states |
| TF | Cell Type | Tissue | Disease Stage | Target Gene | RSS | Regulon Activity |
| ∗The dot plots of a searched regulon are shown for all cell subpopulations in each disease state of each tissue based on the regulon specific score inferred using pySCENIC and by calculating the average expression. |
| Page: 1 |
Top |
Somatic mutation of malignant transformation related genes |
| Annotation of somatic variants for genes involved in malignant transformation |
| Hugo Symbol | Variant Class | Variant Classification | dbSNP RS | HGVSc | HGVSp | HGVSp Short | SWISSPROT | BIOTYPE | SIFT | PolyPhen | Tumor Sample Barcode | Tissue | Histology | Sex | Age | Stage | Therapy Types | Drugs | Outcome |
| SLC25A26 | deletion | Frame_Shift_Del | novel | c.199delN | p.Phe68LeufsTer7 | p.F68Lfs*7 | protein_coding | TCGA-EA-A410-01 | Cervix | cervical & endocervical cancer | Female | <65 | I/II | Unknown | Unknown | SD | |||
| SLC25A26 | SNV | Missense_Mutation | c.494N>C | p.Leu165Ser | p.L165S | protein_coding | deleterious(0) | possibly_damaging(0.885) | TCGA-CA-6718-01 | Colorectum | colon adenocarcinoma | Male | <65 | I/II | Unknown | Unknown | PD | ||
| SLC25A26 | deletion | Frame_Shift_Del | novel | c.199delN | p.Phe68LeufsTer7 | p.F68Lfs*7 | protein_coding | TCGA-AA-3947-01 | Colorectum | colon adenocarcinoma | Female | <65 | I/II | Unknown | Unknown | SD | |||
| SLC25A26 | deletion | Frame_Shift_Del | c.247_248delNN | p.Ser83PhefsTer27 | p.S83Ffs*27 | protein_coding | TCGA-AG-A01W-01 | Colorectum | rectum adenocarcinoma | Female | >=65 | I/II | Chemotherapy | 5-fluorouracil | CR | ||||
| SLC25A26 | SNV | Missense_Mutation | novel | c.274N>G | p.Met92Val | p.M92V | protein_coding | deleterious(0.04) | possibly_damaging(0.614) | TCGA-A5-A0G2-01 | Endometrium | uterine corpus endometrioid carcinoma | Female | <65 | III/IV | Unknown | Unknown | SD | |
| SLC25A26 | SNV | Missense_Mutation | novel | c.176N>T | p.Gly59Val | p.G59V | protein_coding | deleterious(0) | probably_damaging(0.975) | TCGA-AP-A1DV-01 | Endometrium | uterine corpus endometrioid carcinoma | Female | <65 | I/II | Unknown | Unknown | SD | |
| SLC25A26 | SNV | Missense_Mutation | novel | c.403G>A | p.Glu135Lys | p.E135K | protein_coding | deleterious(0.01) | benign(0.17) | TCGA-AX-A2HC-01 | Endometrium | uterine corpus endometrioid carcinoma | Female | <65 | III/IV | Chemotherapy | paclitaxel | PD | |
| SLC25A26 | SNV | Missense_Mutation | novel | c.269A>T | p.Lys90Ile | p.K90I | protein_coding | tolerated(0.13) | benign(0) | TCGA-B5-A11E-01 | Endometrium | uterine corpus endometrioid carcinoma | Female | <65 | I/II | Unknown | Unknown | SD | |
| SLC25A26 | SNV | Missense_Mutation | novel | c.200N>C | p.Phe67Ser | p.F67S | protein_coding | deleterious(0) | probably_damaging(0.999) | TCGA-DF-A2KV-01 | Endometrium | uterine corpus endometrioid carcinoma | Female | <65 | I/II | Unknown | Unknown | SD | |
| SLC25A26 | SNV | Missense_Mutation | novel | c.716N>T | p.Ala239Val | p.A239V | protein_coding | deleterious(0) | probably_damaging(0.949) | TCGA-EO-A22R-01 | Endometrium | uterine corpus endometrioid carcinoma | Female | <65 | I/II | Unknown | Unknown | SD |
| Page: 1 2 |
Top |
Related drugs of malignant transformation related genes |
| Identification of chemicals and drugs interact with genes involved in malignant transfromation |
| (DGIdb 4.0) |
| Entrez ID | Symbol | Category | Interaction Types | Drug Claim Name | Drug Name | PMIDs |
| Page: 1 |

Copyright 2023-Present -The University of Texas Health Science Center at Houston |