
|
|||||
|
 | |
| |
| |
| |
| |
| |
|
Gene: SLC25A25 |
Gene summary for SLC25A25 |
| Gene information | Species | Human | Gene symbol | SLC25A25 | Gene ID | 114789 |
| Gene name | solute carrier family 25 member 25 | |
| Gene Alias | MCSC | |
| Cytomap | 9q34.11 | |
| Gene Type | protein-coding | GO ID | GO:0001654 | UniProtAcc | Q6KCM7 |
Top |
Malignant transformation analysis |
| Identification of the aberrant gene expression in precancerous and cancerous lesions by comparing the gene expression of stem-like cells in diseased tissues with normal stem cells |
| Entrez ID | Symbol | Replicates | Species | Organ | Tissue | Adj P-value | Log2FC | Malignancy |
| 114789 | SLC25A25 | LZE4T | Human | Esophagus | ESCC | 4.71e-05 | 5.24e-02 | 0.0811 |
| 114789 | SLC25A25 | LZE7T | Human | Esophagus | ESCC | 2.48e-07 | 4.82e-01 | 0.0667 |
| 114789 | SLC25A25 | LZE20T | Human | Esophagus | ESCC | 4.10e-03 | 8.82e-02 | 0.0662 |
| 114789 | SLC25A25 | LZE24T | Human | Esophagus | ESCC | 8.57e-09 | 4.68e-01 | 0.0596 |
| 114789 | SLC25A25 | LZE21T | Human | Esophagus | ESCC | 4.51e-10 | 1.32e+00 | 0.0655 |
| 114789 | SLC25A25 | P1T-E | Human | Esophagus | ESCC | 4.72e-08 | 4.58e-01 | 0.0875 |
| 114789 | SLC25A25 | P2T-E | Human | Esophagus | ESCC | 9.55e-26 | 4.37e-01 | 0.1177 |
| 114789 | SLC25A25 | P4T-E | Human | Esophagus | ESCC | 4.69e-17 | 6.96e-01 | 0.1323 |
| 114789 | SLC25A25 | P5T-E | Human | Esophagus | ESCC | 8.02e-16 | 1.19e-01 | 0.1327 |
| 114789 | SLC25A25 | P8T-E | Human | Esophagus | ESCC | 1.58e-25 | 9.00e-01 | 0.0889 |
| 114789 | SLC25A25 | P9T-E | Human | Esophagus | ESCC | 6.11e-19 | 5.29e-01 | 0.1131 |
| 114789 | SLC25A25 | P10T-E | Human | Esophagus | ESCC | 2.53e-17 | -9.37e-02 | 0.116 |
| 114789 | SLC25A25 | P11T-E | Human | Esophagus | ESCC | 4.66e-06 | 5.54e-01 | 0.1426 |
| 114789 | SLC25A25 | P12T-E | Human | Esophagus | ESCC | 5.66e-06 | 3.15e-01 | 0.1122 |
| 114789 | SLC25A25 | P15T-E | Human | Esophagus | ESCC | 8.92e-14 | 2.82e-01 | 0.1149 |
| 114789 | SLC25A25 | P16T-E | Human | Esophagus | ESCC | 3.25e-16 | 9.23e-02 | 0.1153 |
| 114789 | SLC25A25 | P21T-E | Human | Esophagus | ESCC | 2.24e-12 | 1.61e-01 | 0.1617 |
| 114789 | SLC25A25 | P22T-E | Human | Esophagus | ESCC | 2.98e-14 | 1.15e-01 | 0.1236 |
| 114789 | SLC25A25 | P23T-E | Human | Esophagus | ESCC | 1.08e-15 | 7.68e-01 | 0.108 |
| 114789 | SLC25A25 | P24T-E | Human | Esophagus | ESCC | 3.63e-18 | 1.94e-02 | 0.1287 |
| Page: 1 2 3 4 |
| Tissue | Expression Dynamics | Abbreviation |
| Esophagus | 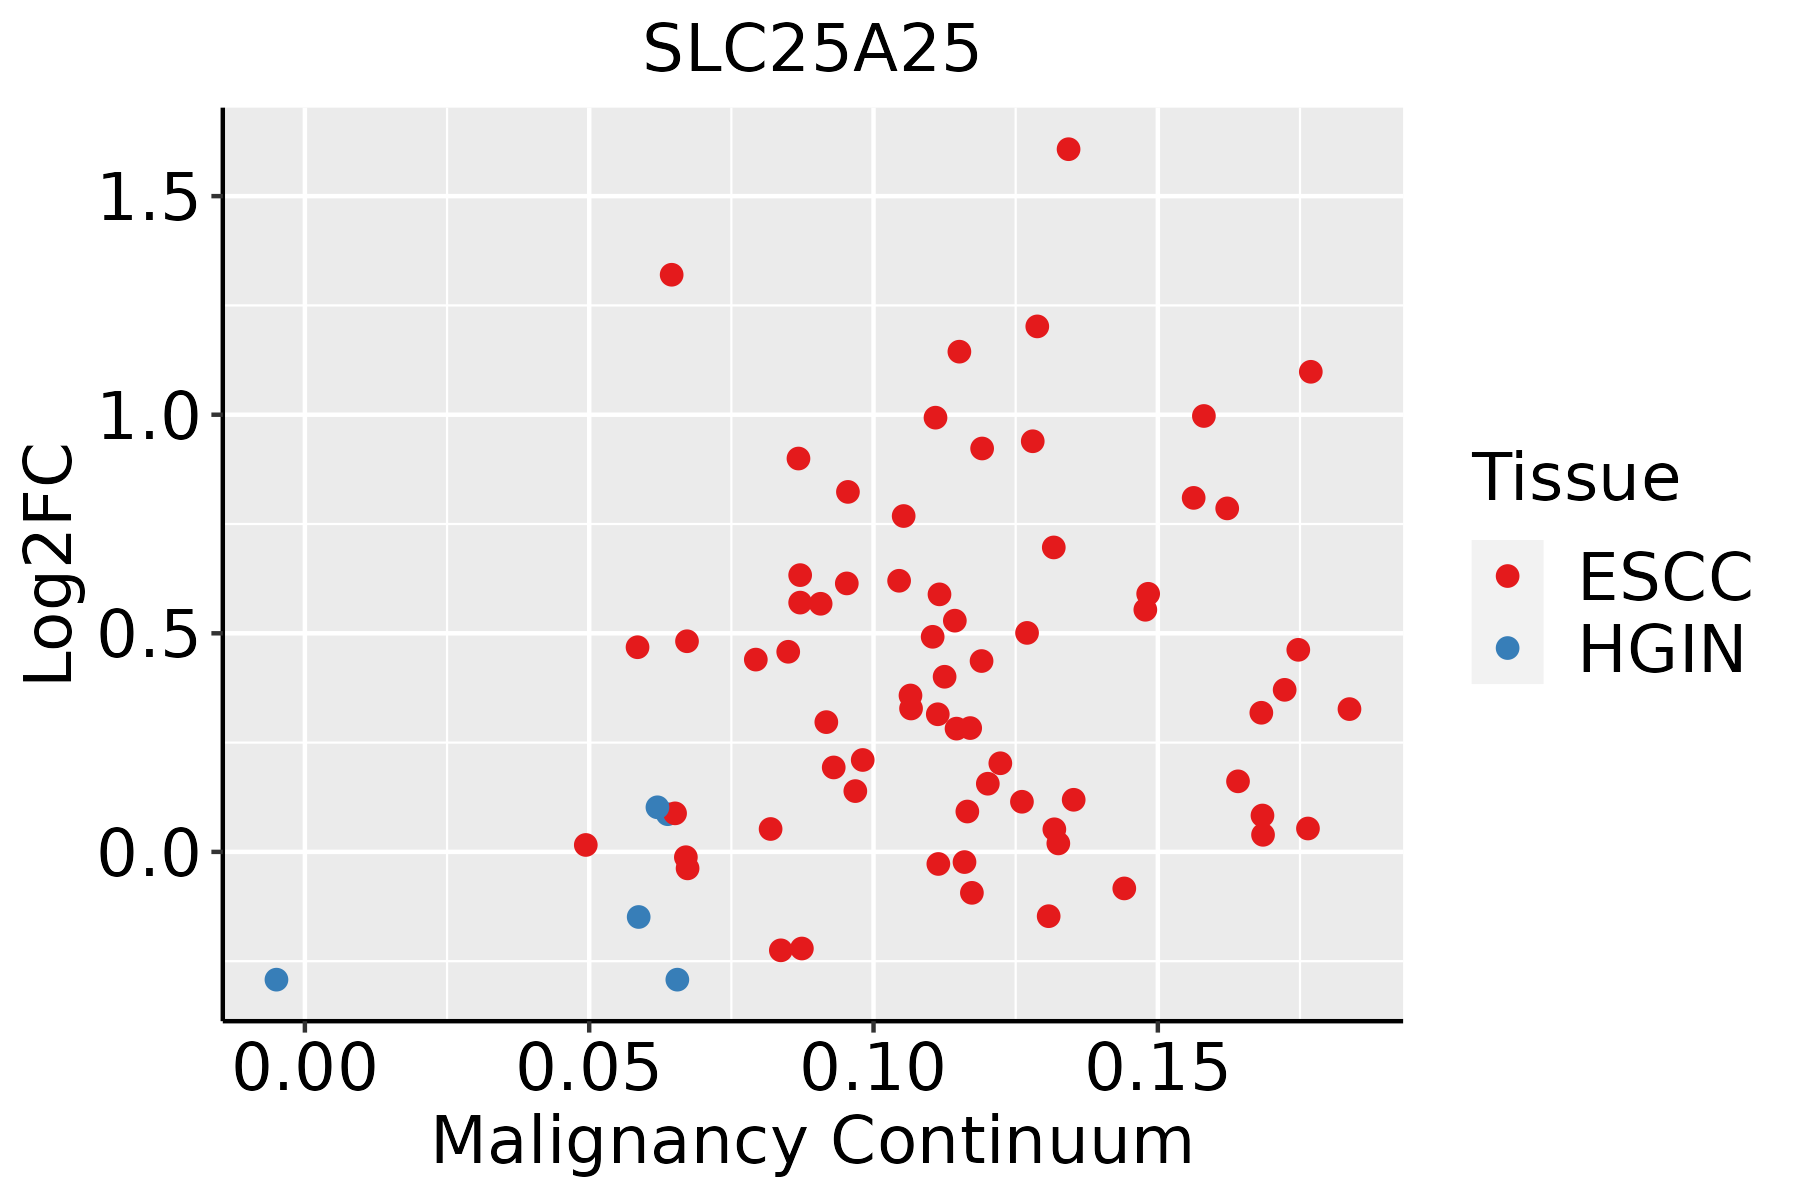 | ESCC: Esophageal squamous cell carcinoma |
| HGIN: High-grade intraepithelial neoplasias | ||
| LGIN: Low-grade intraepithelial neoplasias | ||
| Oral Cavity |  | EOLP: Erosive Oral lichen planus |
| LP: leukoplakia | ||
| NEOLP: Non-erosive oral lichen planus | ||
| OSCC: Oral squamous cell carcinoma | ||
| Thyroid | 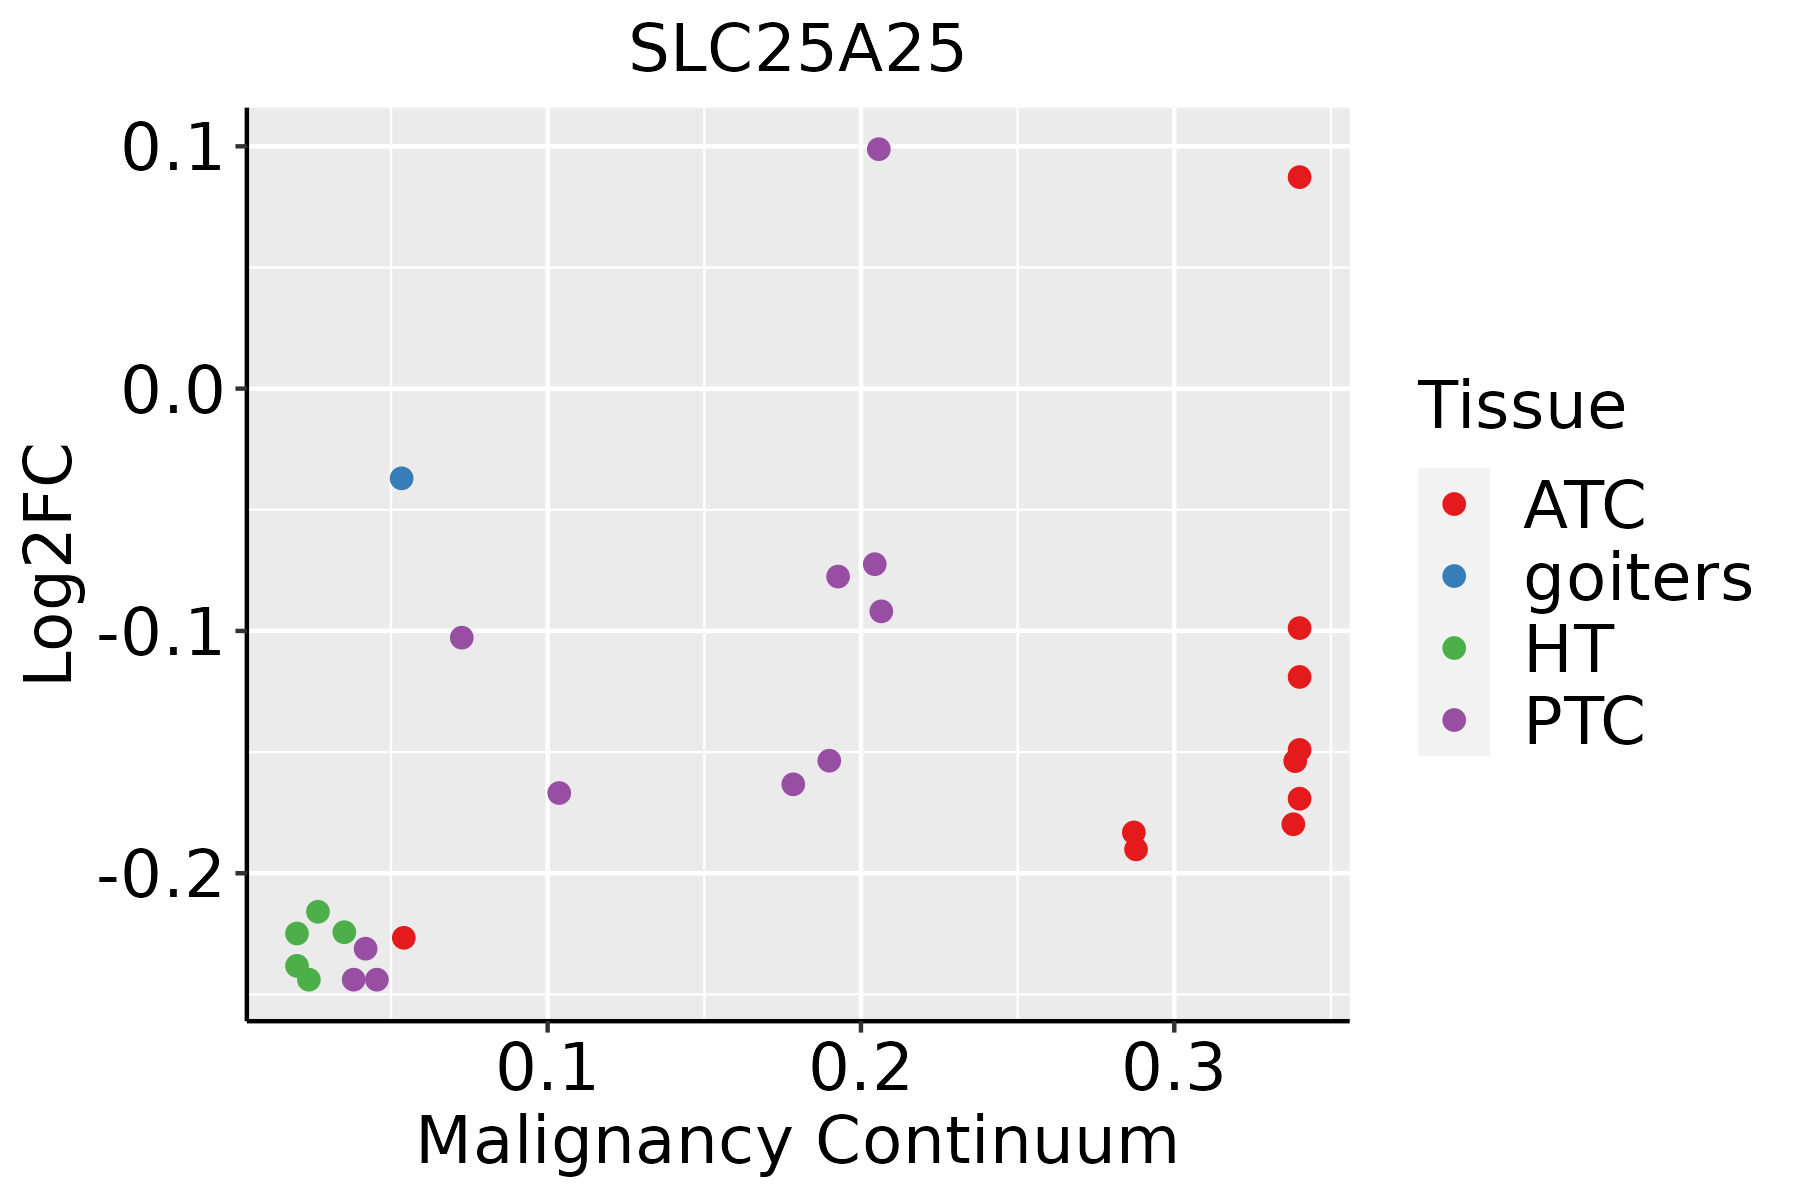 | ATC: Anaplastic thyroid cancer |
| HT: Hashimoto's thyroiditis | ||
| PTC: Papillary thyroid cancer |
| ∗log2FC in expression of this searched gene in stem-like cells from each diseased tissue sample relative to stem-like cells in normal samples in each tissue plotted against the malignancy continuum. Samples are colored based on if they are from different disease stage. |
Top |
Malignant transformation related pathway analysis |
| Find out the enriched GO biological processes and KEGG pathways involved in transition from healthy to precancer to cancer |
| Tissue | Disease Stage | Enriched GO biological Processes |
| Colorectum | AD |  |
| Colorectum | SER |  |
| Colorectum | MSS |  |
| Colorectum | MSI-H |  |
| Colorectum | FAP |  |
| ∗Top 15 enriched GO BP terms are showed in the bar plot of each disease state in each tissue. Each row represents a significant GO biological process which is colored according to the -log10(p.adjust). |
| Page: 1 2 3 4 5 6 7 8 9 |
| GO ID | Tissue | Disease Stage | Description | Gene Ratio | Bg Ratio | pvalue | p.adjust | Count |
| GO:0006091110 | Esophagus | ESCC | generation of precursor metabolites and energy | 331/8552 | 490/18723 | 3.86e-23 | 8.45e-21 | 331 |
| GO:0045333110 | Esophagus | ESCC | cellular respiration | 173/8552 | 230/18723 | 4.53e-20 | 5.99e-18 | 173 |
| GO:0015980110 | Esophagus | ESCC | energy derivation by oxidation of organic compounds | 220/8552 | 318/18723 | 1.20e-17 | 1.09e-15 | 220 |
| GO:001593117 | Esophagus | ESCC | nucleobase-containing compound transport | 162/8552 | 222/18723 | 9.87e-17 | 7.93e-15 | 162 |
| GO:0046034111 | Esophagus | ESCC | ATP metabolic process | 189/8552 | 277/18723 | 1.99e-14 | 1.04e-12 | 189 |
| GO:0031667111 | Esophagus | ESCC | response to nutrient levels | 289/8552 | 474/18723 | 9.25e-12 | 3.47e-10 | 289 |
| GO:00352647 | Esophagus | ESCC | multicellular organism growth | 80/8552 | 132/18723 | 3.84e-04 | 2.22e-03 | 80 |
| GO:000609118 | Oral cavity | OSCC | generation of precursor metabolites and energy | 286/7305 | 490/18723 | 1.45e-18 | 1.71e-16 | 286 |
| GO:001593114 | Oral cavity | OSCC | nucleobase-containing compound transport | 150/7305 | 222/18723 | 4.86e-18 | 5.04e-16 | 150 |
| GO:004533318 | Oral cavity | OSCC | cellular respiration | 153/7305 | 230/18723 | 2.07e-17 | 1.87e-15 | 153 |
| GO:001598018 | Oral cavity | OSCC | energy derivation by oxidation of organic compounds | 190/7305 | 318/18723 | 4.10e-14 | 2.26e-12 | 190 |
| GO:004603420 | Oral cavity | OSCC | ATP metabolic process | 166/7305 | 277/18723 | 1.16e-12 | 5.12e-11 | 166 |
| GO:003166720 | Oral cavity | OSCC | response to nutrient levels | 245/7305 | 474/18723 | 1.02e-08 | 2.10e-07 | 245 |
| GO:19012642 | Oral cavity | OSCC | carbohydrate derivative transport | 44/7305 | 80/18723 | 2.67e-03 | 1.16e-02 | 44 |
| GO:00148233 | Oral cavity | OSCC | response to activity | 41/7305 | 76/18723 | 5.78e-03 | 2.22e-02 | 41 |
| GO:00352646 | Oral cavity | OSCC | multicellular organism growth | 65/7305 | 132/18723 | 1.06e-02 | 3.60e-02 | 65 |
| GO:004533319 | Oral cavity | LP | cellular respiration | 124/4623 | 230/18723 | 1.35e-21 | 3.38e-19 | 124 |
| GO:000609119 | Oral cavity | LP | generation of precursor metabolites and energy | 214/4623 | 490/18723 | 1.12e-20 | 2.60e-18 | 214 |
| GO:001598019 | Oral cavity | LP | energy derivation by oxidation of organic compounds | 145/4623 | 318/18723 | 2.44e-16 | 3.64e-14 | 145 |
| GO:0046034110 | Oral cavity | LP | ATP metabolic process | 128/4623 | 277/18723 | 3.95e-15 | 5.38e-13 | 128 |
| Page: 1 2 3 4 |
| Pathway ID | Tissue | Disease Stage | Description | Gene Ratio | Bg Ratio | pvalue | p.adjust | qvalue | Count |
| Page: 1 |
Top |
Cell-cell communication analysis |
| Identification of potential cell-cell interactions between two cell types and their ligand-receptor pairs for different disease states |
| Ligand | Receptor | LRpair | Pathway | Tissue | Disease Stage |
| Page: 1 |
Top |
Single-cell gene regulatory network inference analysis |
| Find out the significant the regulons (TFs) and the target genes of each regulon across cell types for different disease states |
| TF | Cell Type | Tissue | Disease Stage | Target Gene | RSS | Regulon Activity |
| ∗The dot plots of a searched regulon are shown for all cell subpopulations in each disease state of each tissue based on the regulon specific score inferred using pySCENIC and by calculating the average expression. |
| Page: 1 |
Top |
Somatic mutation of malignant transformation related genes |
| Annotation of somatic variants for genes involved in malignant transformation |
| Hugo Symbol | Variant Class | Variant Classification | dbSNP RS | HGVSc | HGVSp | HGVSp Short | SWISSPROT | BIOTYPE | SIFT | PolyPhen | Tumor Sample Barcode | Tissue | Histology | Sex | Age | Stage | Therapy Types | Drugs | Outcome |
| SLC25A25 | SNV | Missense_Mutation | c.385N>A | p.Asp129Asn | p.D129N | Q6KCM7 | protein_coding | deleterious(0) | possibly_damaging(0.84) | TCGA-A2-A0CX-01 | Breast | breast invasive carcinoma | Female | <65 | I/II | Chemotherapy | adriamycin | SD | |
| SLC25A25 | SNV | Missense_Mutation | c.1088N>T | p.Ser363Leu | p.S363L | Q6KCM7 | protein_coding | deleterious(0.01) | benign(0.029) | TCGA-A8-A09I-01 | Breast | breast invasive carcinoma | Female | >=65 | I/II | Hormone Therapy | anastrozole | SD | |
| SLC25A25 | SNV | Missense_Mutation | rs753341608 | c.1358C>T | p.Ala453Val | p.A453V | Q6KCM7 | protein_coding | deleterious(0.03) | probably_damaging(0.923) | TCGA-A8-A09Z-01 | Breast | breast invasive carcinoma | Female | >=65 | I/II | Unknown | Unknown | SD |
| SLC25A25 | SNV | Missense_Mutation | rs772416779 | c.1421N>A | p.Arg474Gln | p.R474Q | Q6KCM7 | protein_coding | tolerated(0.7) | benign(0.007) | TCGA-AA-3492-01 | Colorectum | colon adenocarcinoma | Female | >=65 | I/II | Unknown | Unknown | SD |
| SLC25A25 | SNV | Missense_Mutation | c.1470N>T | p.Met490Ile | p.M490I | Q6KCM7 | protein_coding | tolerated(0.29) | benign(0.061) | TCGA-AA-3695-01 | Colorectum | colon adenocarcinoma | Female | <65 | III/IV | Unknown | Unknown | SD | |
| SLC25A25 | SNV | Missense_Mutation | c.61G>A | p.Ala21Thr | p.A21T | Q6KCM7 | protein_coding | tolerated_low_confidence(0.46) | benign(0) | TCGA-WS-AB45-01 | Colorectum | colon adenocarcinoma | Female | <65 | I/II | Unknown | Unknown | SD | |
| SLC25A25 | SNV | Missense_Mutation | rs765220171 | c.733N>A | p.Val245Ile | p.V245I | Q6KCM7 | protein_coding | deleterious(0.05) | possibly_damaging(0.471) | TCGA-A5-A0G2-01 | Endometrium | uterine corpus endometrioid carcinoma | Female | <65 | III/IV | Unknown | Unknown | SD |
| SLC25A25 | SNV | Missense_Mutation | novel | c.274N>A | p.Ala92Thr | p.A92T | Q6KCM7 | protein_coding | tolerated(0.37) | benign(0.021) | TCGA-A5-A1OF-01 | Endometrium | uterine corpus endometrioid carcinoma | Female | <65 | I/II | Unknown | Unknown | SD |
| SLC25A25 | SNV | Missense_Mutation | novel | c.1323N>A | p.Ser441Arg | p.S441R | Q6KCM7 | protein_coding | deleterious(0.01) | probably_damaging(0.997) | TCGA-A5-A1OF-01 | Endometrium | uterine corpus endometrioid carcinoma | Female | <65 | I/II | Unknown | Unknown | SD |
| SLC25A25 | SNV | Missense_Mutation | novel | c.1016N>G | p.Ile339Ser | p.I339S | Q6KCM7 | protein_coding | tolerated(0.05) | possibly_damaging(0.454) | TCGA-AJ-A3BH-01 | Endometrium | uterine corpus endometrioid carcinoma | Female | Unknown | I/II | Unknown | Unknown | SD |
| Page: 1 2 3 4 |
Top |
Related drugs of malignant transformation related genes |
| Identification of chemicals and drugs interact with genes involved in malignant transfromation |
| (DGIdb 4.0) |
| Entrez ID | Symbol | Category | Interaction Types | Drug Claim Name | Drug Name | PMIDs |
| Page: 1 |

Copyright 2023-Present -The University of Texas Health Science Center at Houston |