
|
|||||
|
 | |
| |
| |
| |
| |
| |
|
Gene: SLC25A22 |
Gene summary for SLC25A22 |
| Gene information | Species | Human | Gene symbol | SLC25A22 | Gene ID | 79751 |
| Gene name | solute carrier family 25 member 22 | |
| Gene Alias | DEE3 | |
| Cytomap | 11p15.5 | |
| Gene Type | protein-coding | GO ID | GO:0003333 | UniProtAcc | Q9H936 |
Top |
Malignant transformation analysis |
| Identification of the aberrant gene expression in precancerous and cancerous lesions by comparing the gene expression of stem-like cells in diseased tissues with normal stem cells |
| Entrez ID | Symbol | Replicates | Species | Organ | Tissue | Adj P-value | Log2FC | Malignancy |
| 79751 | SLC25A22 | LZE24T | Human | Esophagus | ESCC | 5.65e-09 | 1.46e-01 | 0.0596 |
| 79751 | SLC25A22 | P2T-E | Human | Esophagus | ESCC | 2.43e-19 | 3.60e-01 | 0.1177 |
| 79751 | SLC25A22 | P4T-E | Human | Esophagus | ESCC | 3.59e-09 | 2.22e-01 | 0.1323 |
| 79751 | SLC25A22 | P5T-E | Human | Esophagus | ESCC | 1.49e-04 | 5.81e-02 | 0.1327 |
| 79751 | SLC25A22 | P8T-E | Human | Esophagus | ESCC | 5.13e-06 | 4.43e-02 | 0.0889 |
| 79751 | SLC25A22 | P9T-E | Human | Esophagus | ESCC | 2.03e-11 | 1.89e-01 | 0.1131 |
| 79751 | SLC25A22 | P10T-E | Human | Esophagus | ESCC | 1.08e-06 | 1.29e-01 | 0.116 |
| 79751 | SLC25A22 | P11T-E | Human | Esophagus | ESCC | 1.18e-10 | 5.35e-01 | 0.1426 |
| 79751 | SLC25A22 | P12T-E | Human | Esophagus | ESCC | 6.28e-08 | 8.25e-02 | 0.1122 |
| 79751 | SLC25A22 | P15T-E | Human | Esophagus | ESCC | 1.92e-06 | 1.81e-01 | 0.1149 |
| 79751 | SLC25A22 | P16T-E | Human | Esophagus | ESCC | 1.97e-11 | 1.62e-01 | 0.1153 |
| 79751 | SLC25A22 | P17T-E | Human | Esophagus | ESCC | 5.62e-05 | 2.76e-01 | 0.1278 |
| 79751 | SLC25A22 | P19T-E | Human | Esophagus | ESCC | 1.40e-05 | 3.37e-01 | 0.1662 |
| 79751 | SLC25A22 | P20T-E | Human | Esophagus | ESCC | 1.65e-10 | 2.46e-01 | 0.1124 |
| 79751 | SLC25A22 | P21T-E | Human | Esophagus | ESCC | 8.04e-25 | 4.58e-01 | 0.1617 |
| 79751 | SLC25A22 | P22T-E | Human | Esophagus | ESCC | 1.62e-12 | 1.63e-01 | 0.1236 |
| 79751 | SLC25A22 | P23T-E | Human | Esophagus | ESCC | 4.30e-06 | 2.38e-01 | 0.108 |
| 79751 | SLC25A22 | P24T-E | Human | Esophagus | ESCC | 8.39e-19 | 3.42e-01 | 0.1287 |
| 79751 | SLC25A22 | P26T-E | Human | Esophagus | ESCC | 6.68e-18 | 2.90e-01 | 0.1276 |
| 79751 | SLC25A22 | P27T-E | Human | Esophagus | ESCC | 2.68e-05 | 1.36e-01 | 0.1055 |
| Page: 1 2 3 4 |
| Tissue | Expression Dynamics | Abbreviation |
| Esophagus | 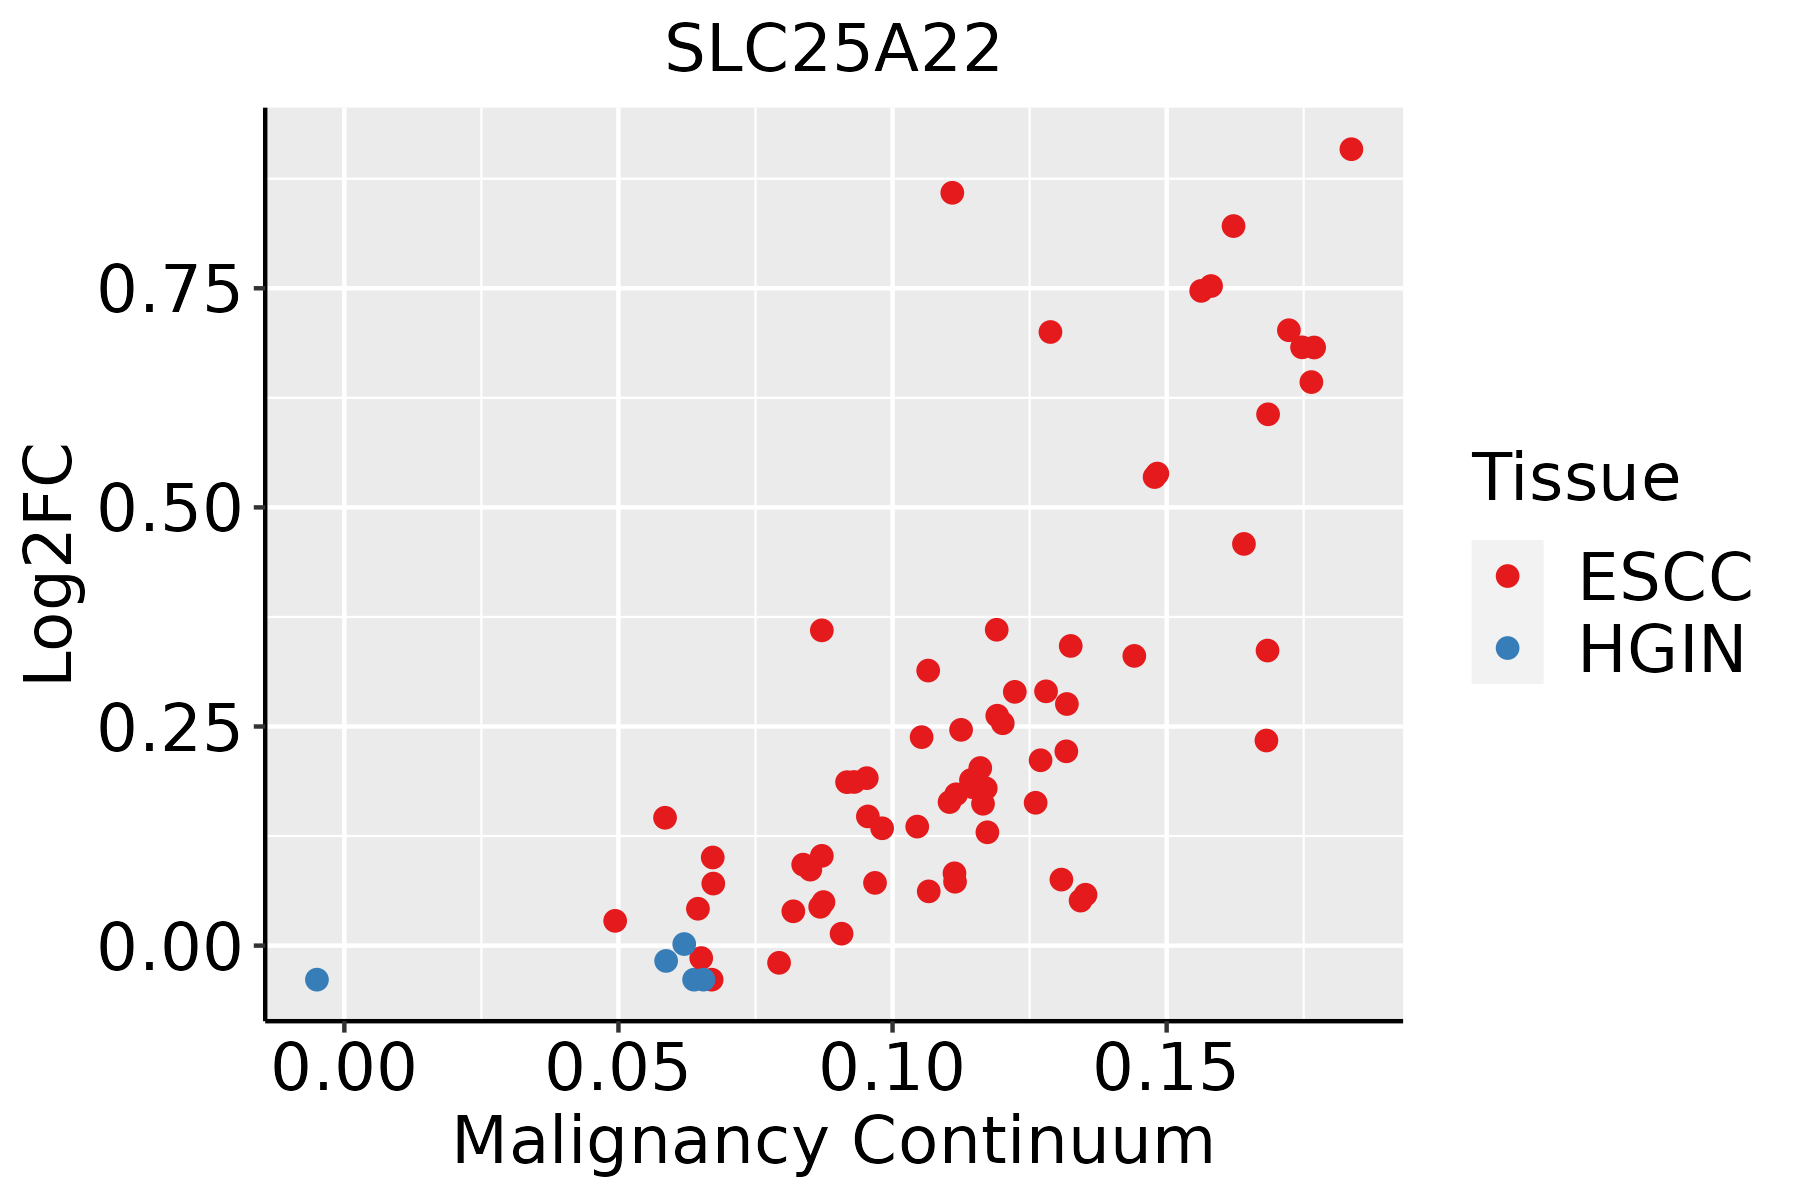 | ESCC: Esophageal squamous cell carcinoma |
| HGIN: High-grade intraepithelial neoplasias | ||
| LGIN: Low-grade intraepithelial neoplasias | ||
| Liver | 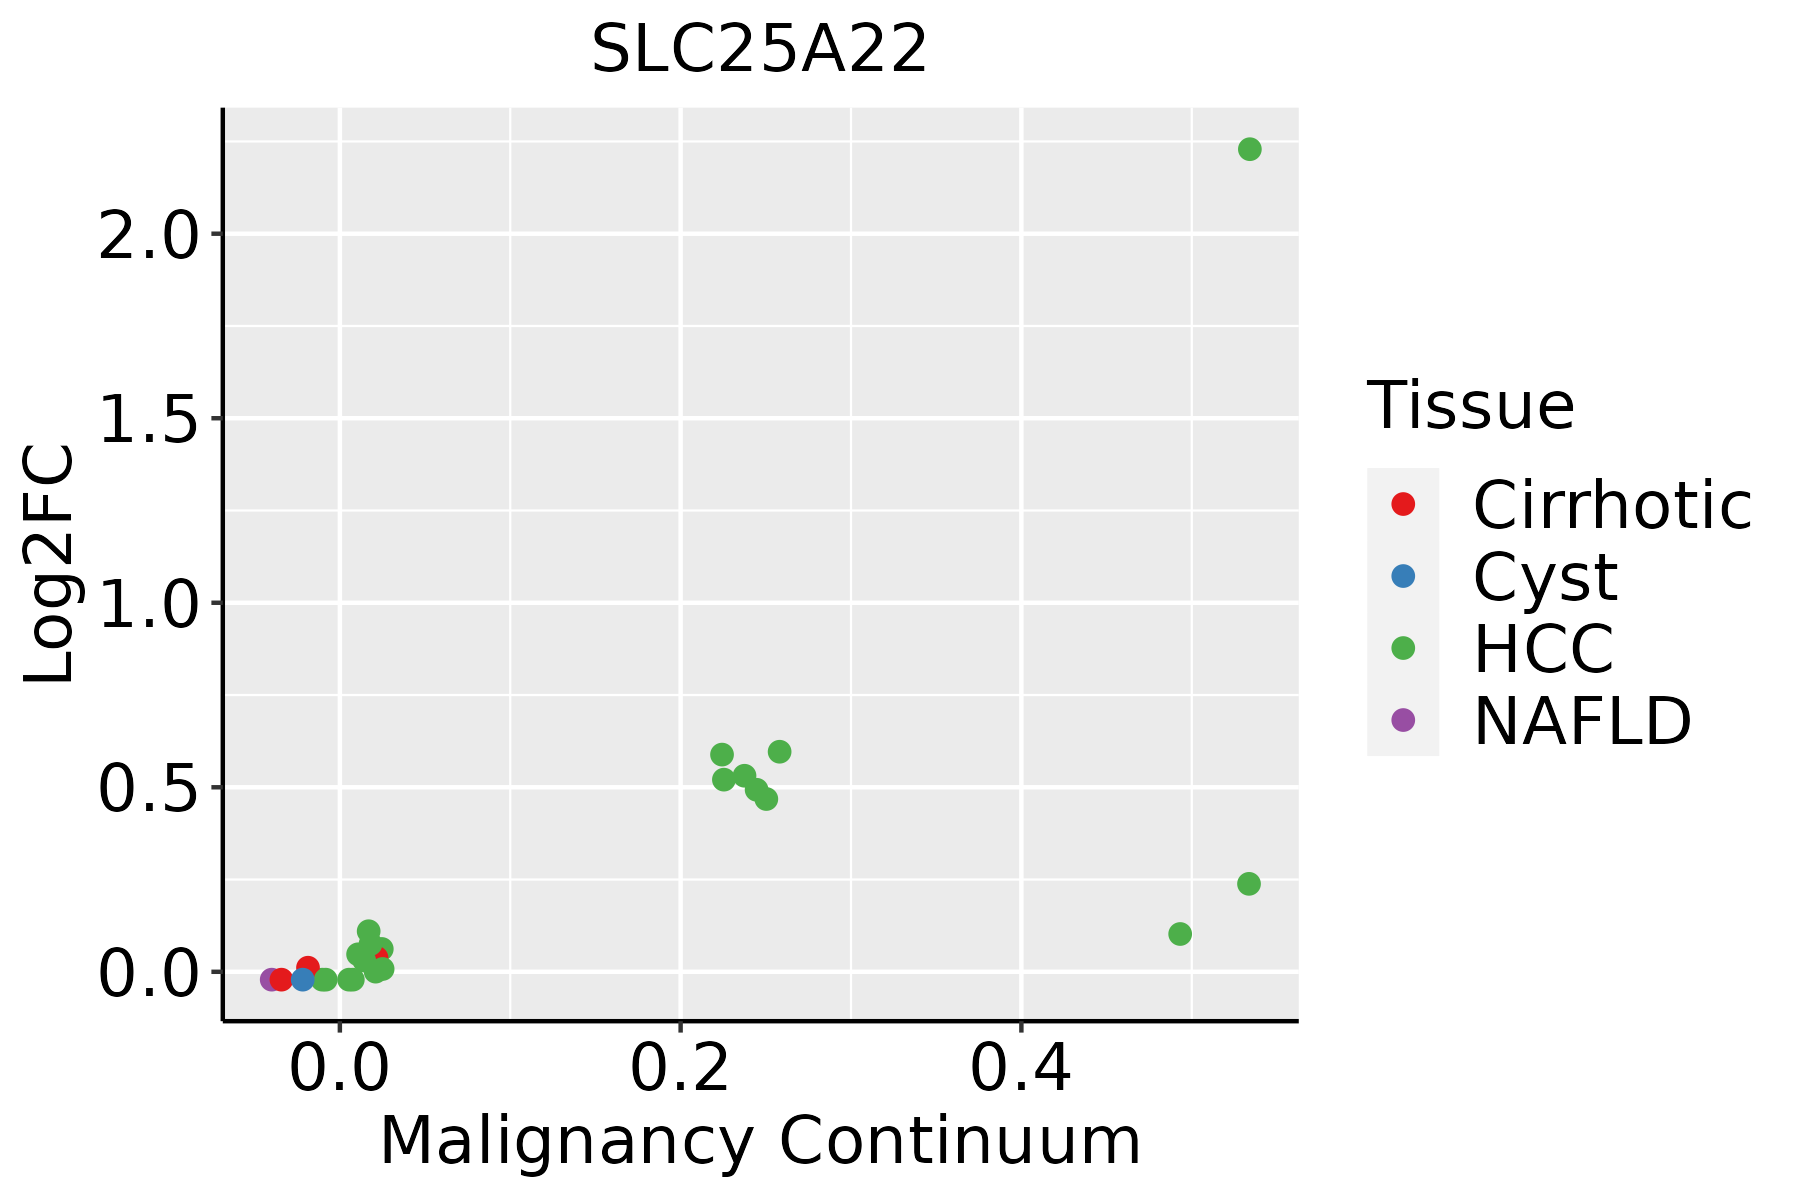 | HCC: Hepatocellular carcinoma |
| NAFLD: Non-alcoholic fatty liver disease | ||
| Oral Cavity | 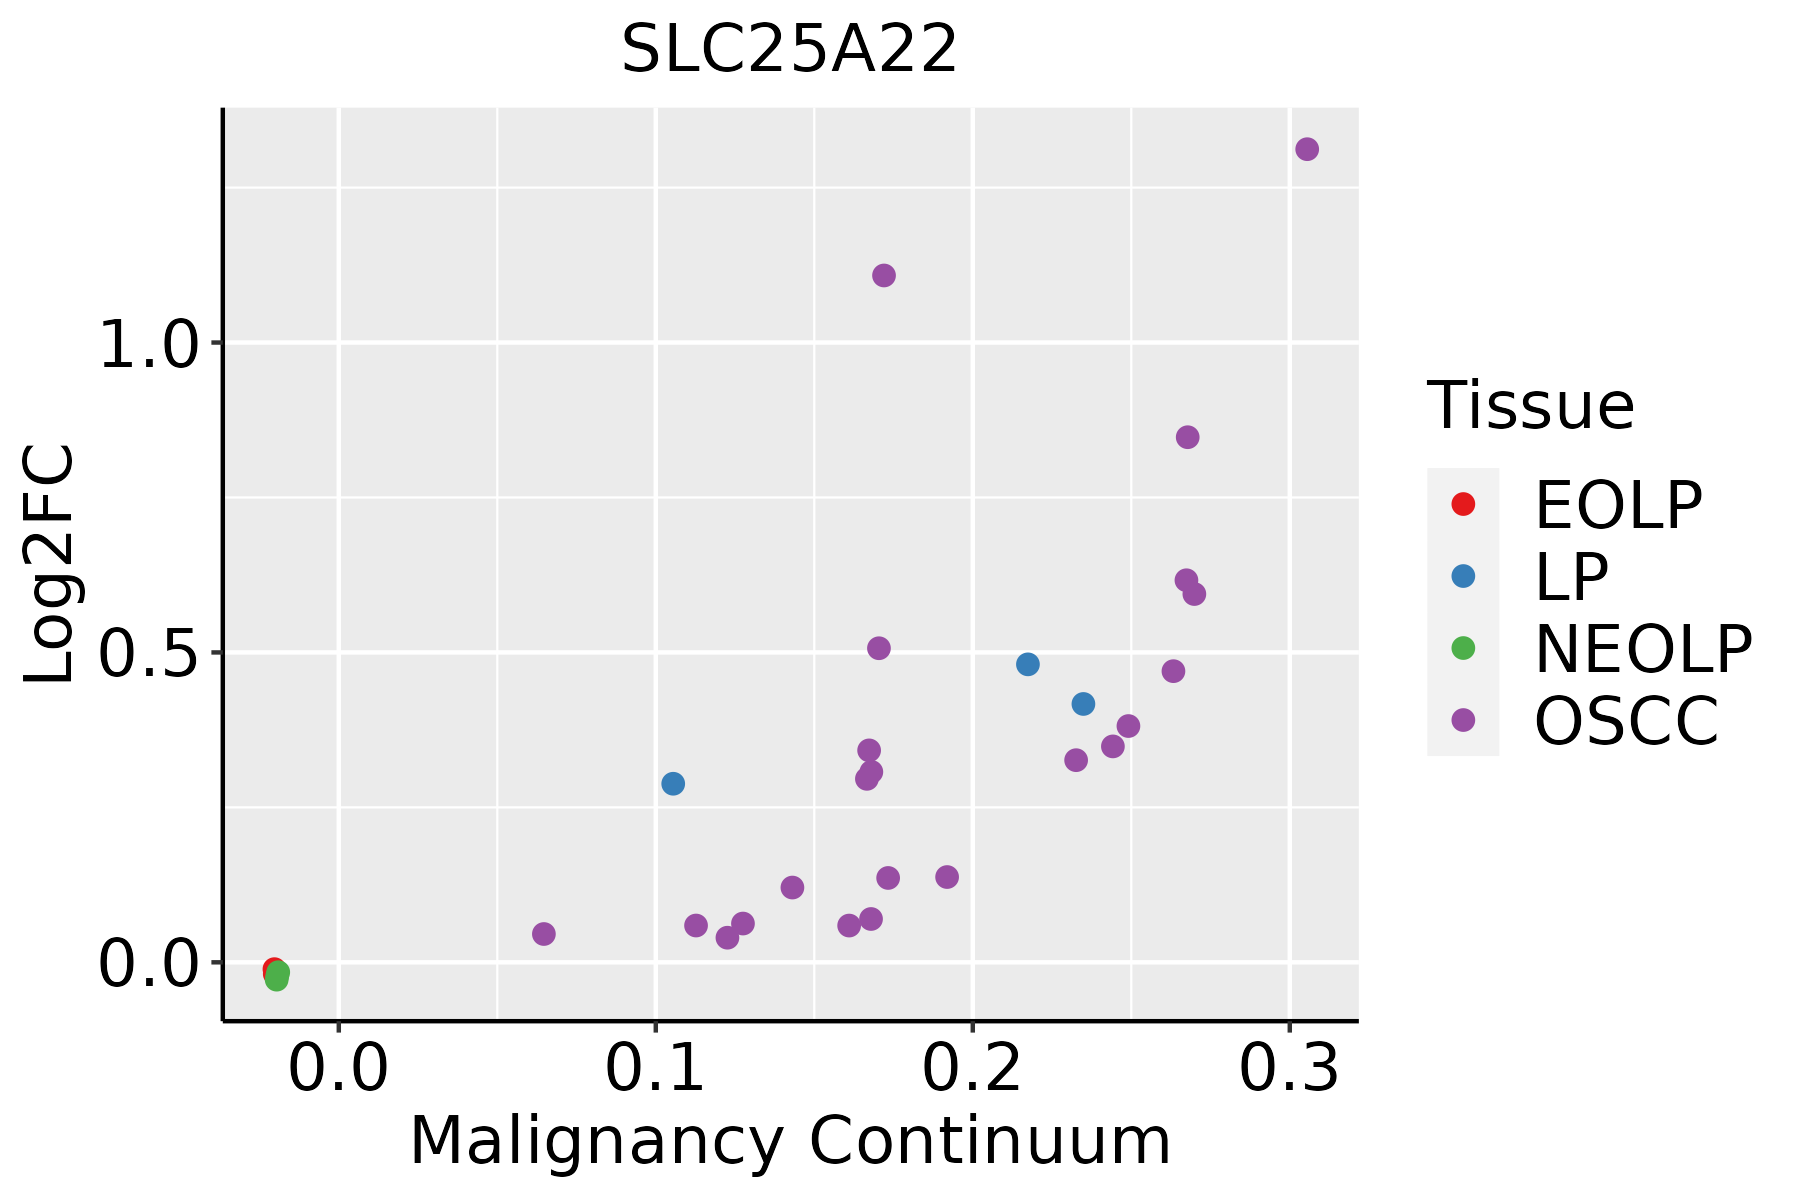 | EOLP: Erosive Oral lichen planus |
| LP: leukoplakia | ||
| NEOLP: Non-erosive oral lichen planus | ||
| OSCC: Oral squamous cell carcinoma |
| ∗log2FC in expression of this searched gene in stem-like cells from each diseased tissue sample relative to stem-like cells in normal samples in each tissue plotted against the malignancy continuum. Samples are colored based on if they are from different disease stage. |
Top |
Malignant transformation related pathway analysis |
| Find out the enriched GO biological processes and KEGG pathways involved in transition from healthy to precancer to cancer |
| Tissue | Disease Stage | Enriched GO biological Processes |
| Colorectum | AD |  |
| Colorectum | SER |  |
| Colorectum | MSS |  |
| Colorectum | MSI-H |  |
| Colorectum | FAP |  |
| ∗Top 15 enriched GO BP terms are showed in the bar plot of each disease state in each tissue. Each row represents a significant GO biological process which is colored according to the -log10(p.adjust). |
| Page: 1 2 3 4 5 6 7 8 9 |
| GO ID | Tissue | Disease Stage | Description | Gene Ratio | Bg Ratio | pvalue | p.adjust | Count |
| GO:0006091110 | Esophagus | ESCC | generation of precursor metabolites and energy | 331/8552 | 490/18723 | 3.86e-23 | 8.45e-21 | 331 |
| GO:0045333110 | Esophagus | ESCC | cellular respiration | 173/8552 | 230/18723 | 4.53e-20 | 5.99e-18 | 173 |
| GO:0006839110 | Esophagus | ESCC | mitochondrial transport | 187/8552 | 254/18723 | 8.35e-20 | 9.81e-18 | 187 |
| GO:0015980110 | Esophagus | ESCC | energy derivation by oxidation of organic compounds | 220/8552 | 318/18723 | 1.20e-17 | 1.09e-15 | 220 |
| GO:0022900110 | Esophagus | ESCC | electron transport chain | 133/8552 | 175/18723 | 2.18e-16 | 1.67e-14 | 133 |
| GO:0022904110 | Esophagus | ESCC | respiratory electron transport chain | 89/8552 | 114/18723 | 1.36e-12 | 5.80e-11 | 89 |
| GO:1990542110 | Esophagus | ESCC | mitochondrial transmembrane transport | 72/8552 | 102/18723 | 2.94e-07 | 4.23e-06 | 72 |
| GO:190260018 | Esophagus | ESCC | proton transmembrane transport | 88/8552 | 157/18723 | 5.62e-03 | 2.10e-02 | 88 |
| GO:000609122 | Liver | HCC | generation of precursor metabolites and energy | 340/7958 | 490/18723 | 4.04e-34 | 2.85e-31 | 340 |
| GO:004533312 | Liver | HCC | cellular respiration | 171/7958 | 230/18723 | 6.35e-23 | 1.26e-20 | 171 |
| GO:001598022 | Liver | HCC | energy derivation by oxidation of organic compounds | 221/7958 | 318/18723 | 1.02e-22 | 1.86e-20 | 221 |
| GO:000683912 | Liver | HCC | mitochondrial transport | 184/7958 | 254/18723 | 2.30e-22 | 3.83e-20 | 184 |
| GO:002290022 | Liver | HCC | electron transport chain | 134/7958 | 175/18723 | 3.32e-20 | 4.68e-18 | 134 |
| GO:002290412 | Liver | HCC | respiratory electron transport chain | 89/7958 | 114/18723 | 8.68e-15 | 5.73e-13 | 89 |
| GO:199054212 | Liver | HCC | mitochondrial transmembrane transport | 78/7958 | 102/18723 | 2.73e-12 | 1.26e-10 | 78 |
| GO:19026007 | Liver | HCC | proton transmembrane transport | 87/7958 | 157/18723 | 7.27e-04 | 4.42e-03 | 87 |
| GO:002290018 | Oral cavity | OSCC | electron transport chain | 126/7305 | 175/18723 | 6.65e-19 | 8.42e-17 | 126 |
| GO:000609118 | Oral cavity | OSCC | generation of precursor metabolites and energy | 286/7305 | 490/18723 | 1.45e-18 | 1.71e-16 | 286 |
| GO:004533318 | Oral cavity | OSCC | cellular respiration | 153/7305 | 230/18723 | 2.07e-17 | 1.87e-15 | 153 |
| GO:000683918 | Oral cavity | OSCC | mitochondrial transport | 162/7305 | 254/18723 | 8.96e-16 | 6.52e-14 | 162 |
| Page: 1 2 |
| Pathway ID | Tissue | Disease Stage | Description | Gene Ratio | Bg Ratio | pvalue | p.adjust | qvalue | Count |
| Page: 1 |
Top |
Cell-cell communication analysis |
| Identification of potential cell-cell interactions between two cell types and their ligand-receptor pairs for different disease states |
| Ligand | Receptor | LRpair | Pathway | Tissue | Disease Stage |
| Page: 1 |
Top |
Single-cell gene regulatory network inference analysis |
| Find out the significant the regulons (TFs) and the target genes of each regulon across cell types for different disease states |
| TF | Cell Type | Tissue | Disease Stage | Target Gene | RSS | Regulon Activity |
| ∗The dot plots of a searched regulon are shown for all cell subpopulations in each disease state of each tissue based on the regulon specific score inferred using pySCENIC and by calculating the average expression. |
| Page: 1 |
Top |
Somatic mutation of malignant transformation related genes |
| Annotation of somatic variants for genes involved in malignant transformation |
| Hugo Symbol | Variant Class | Variant Classification | dbSNP RS | HGVSc | HGVSp | HGVSp Short | SWISSPROT | BIOTYPE | SIFT | PolyPhen | Tumor Sample Barcode | Tissue | Histology | Sex | Age | Stage | Therapy Types | Drugs | Outcome |
| SLC25A22 | SNV | Missense_Mutation | c.663G>C | p.Glu221Asp | p.E221D | Q9H936 | protein_coding | tolerated(0.38) | benign(0.013) | TCGA-BH-A18P-01 | Breast | breast invasive carcinoma | Female | <65 | I/II | Unknown | Unknown | PD | |
| SLC25A22 | SNV | Missense_Mutation | rs775147140 | c.715N>A | p.Ala239Thr | p.A239T | Q9H936 | protein_coding | deleterious(0.04) | possibly_damaging(0.871) | TCGA-VS-A9U6-01 | Cervix | cervical & endocervical cancer | Female | <65 | I/II | Chemotherapy | cisplatin | PD |
| SLC25A22 | insertion | Frame_Shift_Ins | novel | c.636_637insAGCAGGTCGCGGGT | p.Gln213SerfsTer42 | p.Q213Sfs*42 | Q9H936 | protein_coding | TCGA-DS-A1OB-01 | Cervix | cervical & endocervical cancer | Female | <65 | I/II | Chemotherapy | carboplatin | PD | ||
| SLC25A22 | SNV | Missense_Mutation | c.37N>G | p.Ile13Val | p.I13V | Q9H936 | protein_coding | tolerated(0.09) | benign(0.361) | TCGA-AA-3663-01 | Colorectum | colon adenocarcinoma | Male | <65 | I/II | Unknown | Unknown | SD | |
| SLC25A22 | SNV | Missense_Mutation | c.136N>A | p.Tyr46Asn | p.Y46N | Q9H936 | protein_coding | deleterious(0) | probably_damaging(0.998) | TCGA-AZ-5403-01 | Colorectum | colon adenocarcinoma | Male | <65 | I/II | Unknown | Unknown | PD | |
| SLC25A22 | SNV | Missense_Mutation | rs754048758 | c.173N>A | p.Arg58His | p.R58H | Q9H936 | protein_coding | tolerated(0.06) | possibly_damaging(0.458) | TCGA-EI-6882-01 | Colorectum | rectum adenocarcinoma | Male | <65 | I/II | Unknown | Unknown | SD |
| SLC25A22 | deletion | Frame_Shift_Del | c.234delN | p.Glu79ArgfsTer23 | p.E79Rfs*23 | Q9H936 | protein_coding | TCGA-CK-5916-01 | Colorectum | colon adenocarcinoma | Female | >=65 | I/II | Unknown | Unknown | PD | |||
| SLC25A22 | SNV | Missense_Mutation | rs544386351 | c.415N>A | p.Ala139Thr | p.A139T | Q9H936 | protein_coding | tolerated(0.13) | benign(0.037) | TCGA-A5-A0VP-01 | Endometrium | uterine corpus endometrioid carcinoma | Female | >=65 | I/II | Unknown | Unknown | SD |
| SLC25A22 | SNV | Missense_Mutation | novel | c.502N>T | p.Pro168Ser | p.P168S | Q9H936 | protein_coding | tolerated(0.4) | benign(0.142) | TCGA-A5-A1OF-01 | Endometrium | uterine corpus endometrioid carcinoma | Female | <65 | I/II | Unknown | Unknown | SD |
| SLC25A22 | SNV | Missense_Mutation | c.728N>C | p.Val243Ala | p.V243A | Q9H936 | protein_coding | deleterious(0.01) | probably_damaging(0.99) | TCGA-BS-A0UF-01 | Endometrium | uterine corpus endometrioid carcinoma | Female | >=65 | I/II | Unknown | Unknown | SD |
| Page: 1 2 3 4 |
Top |
Related drugs of malignant transformation related genes |
| Identification of chemicals and drugs interact with genes involved in malignant transfromation |
| (DGIdb 4.0) |
| Entrez ID | Symbol | Category | Interaction Types | Drug Claim Name | Drug Name | PMIDs |
| Page: 1 |

Copyright 2023-Present -The University of Texas Health Science Center at Houston |