
|
|||||
|
 | |
| |
| |
| |
| |
| |
|
Gene: SLC25A20 |
Gene summary for SLC25A20 |
| Gene information | Species | Human | Gene symbol | SLC25A20 | Gene ID | 788 |
| Gene name | solute carrier family 25 member 20 | |
| Gene Alias | CAC | |
| Cytomap | 3p21.31 | |
| Gene Type | protein-coding | GO ID | GO:0001701 | UniProtAcc | O43772 |
Top |
Malignant transformation analysis |
| Identification of the aberrant gene expression in precancerous and cancerous lesions by comparing the gene expression of stem-like cells in diseased tissues with normal stem cells |
| Entrez ID | Symbol | Replicates | Species | Organ | Tissue | Adj P-value | Log2FC | Malignancy |
| 788 | SLC25A20 | NAFLD1 | Human | Liver | NAFLD | 8.28e-04 | 3.60e-01 | -0.04 |
| 788 | SLC25A20 | HCC1_Meng | Human | Liver | HCC | 3.59e-32 | 1.69e-02 | 0.0246 |
| 788 | SLC25A20 | HCC2 | Human | Liver | HCC | 1.63e-07 | 2.60e+00 | 0.5341 |
| 788 | SLC25A20 | S014 | Human | Liver | HCC | 5.50e-04 | 2.31e-01 | 0.2254 |
| 788 | SLC25A20 | S015 | Human | Liver | HCC | 6.80e-05 | 3.24e-01 | 0.2375 |
| 788 | SLC25A20 | S016 | Human | Liver | HCC | 4.41e-10 | 4.03e-01 | 0.2243 |
| 788 | SLC25A20 | S027 | Human | Liver | HCC | 5.92e-06 | 6.57e-01 | 0.2446 |
| 788 | SLC25A20 | S028 | Human | Liver | HCC | 1.95e-16 | 7.47e-01 | 0.2503 |
| 788 | SLC25A20 | S029 | Human | Liver | HCC | 1.71e-22 | 1.08e+00 | 0.2581 |
| Page: 1 |
| Tissue | Expression Dynamics | Abbreviation |
| Liver | 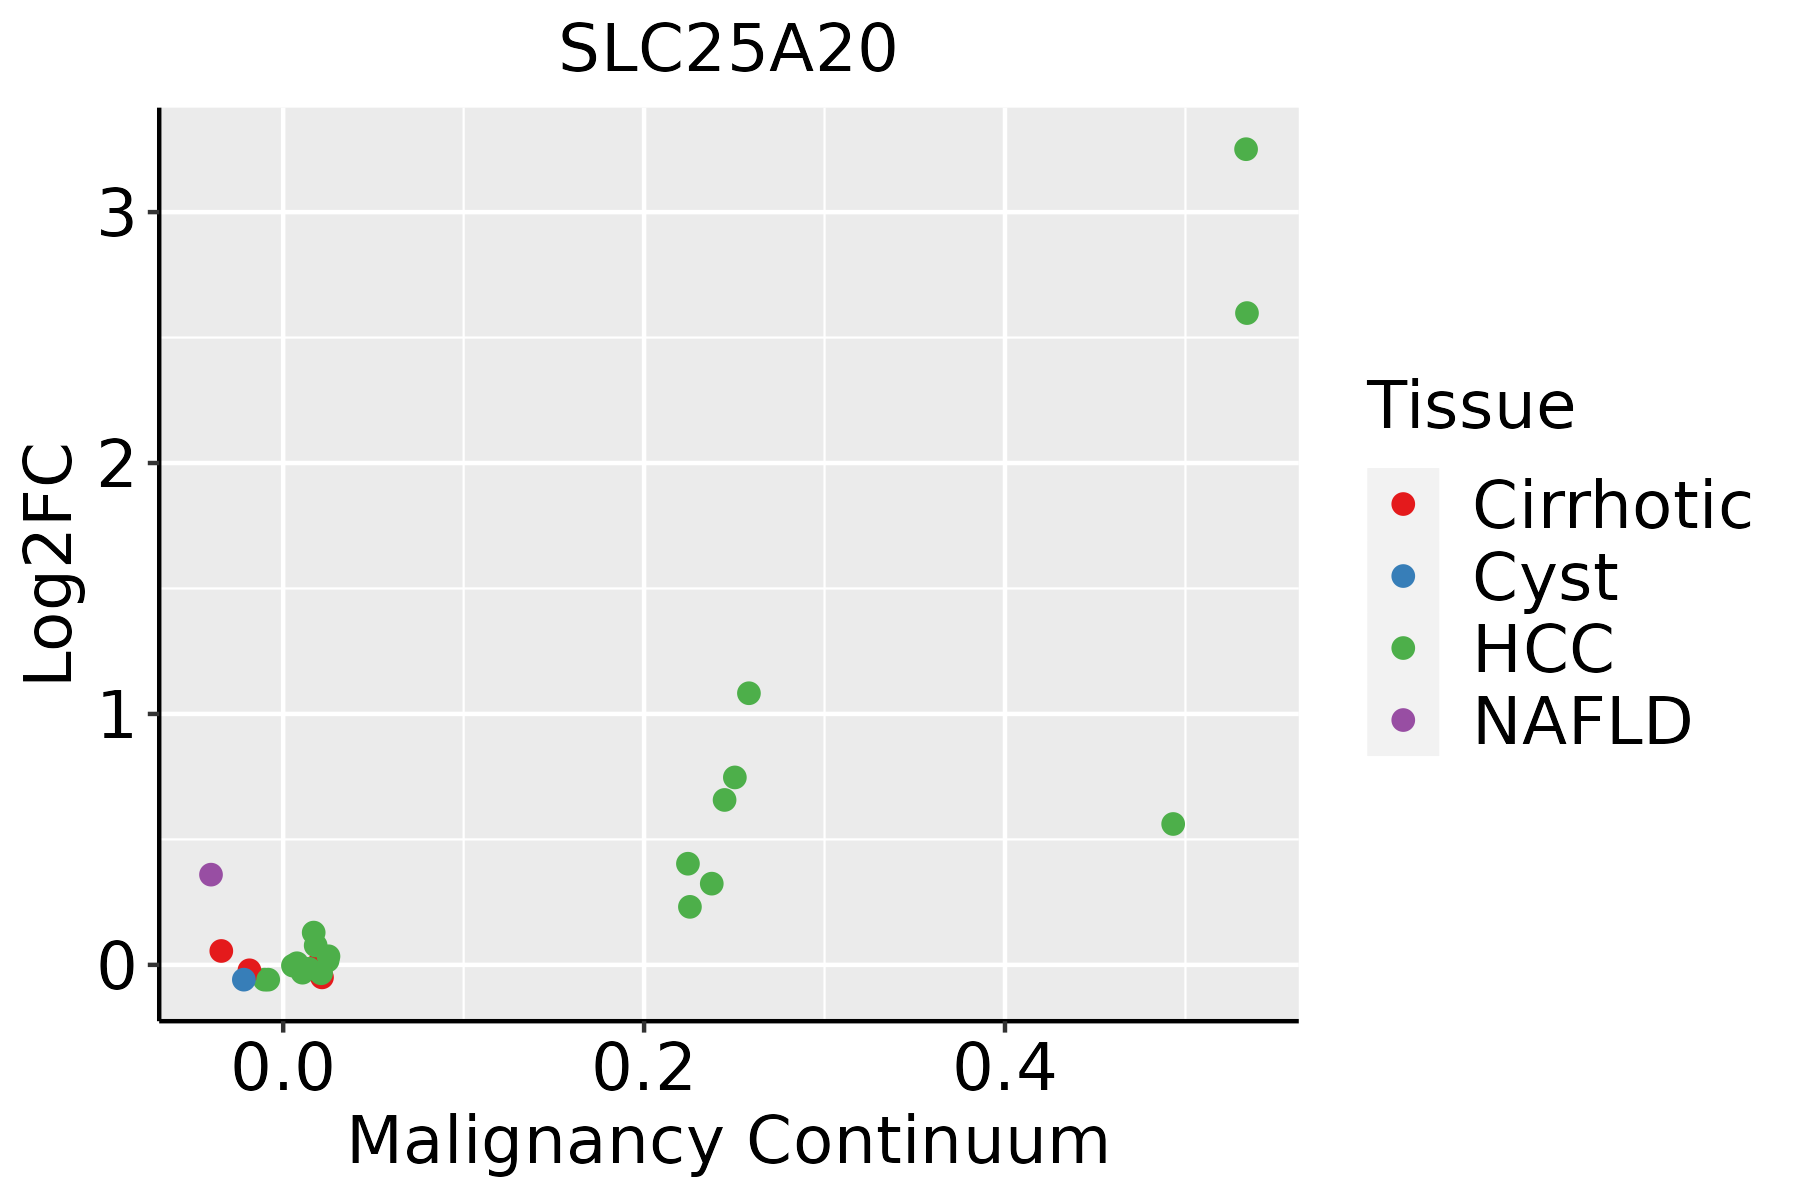 | HCC: Hepatocellular carcinoma |
| NAFLD: Non-alcoholic fatty liver disease |
| ∗log2FC in expression of this searched gene in stem-like cells from each diseased tissue sample relative to stem-like cells in normal samples in each tissue plotted against the malignancy continuum. Samples are colored based on if they are from different disease stage. |
Top |
Malignant transformation related pathway analysis |
| Find out the enriched GO biological processes and KEGG pathways involved in transition from healthy to precancer to cancer |
| Tissue | Disease Stage | Enriched GO biological Processes |
| Colorectum | AD |  |
| Colorectum | SER |  |
| Colorectum | MSS |  |
| Colorectum | MSI-H |  |
| Colorectum | FAP |  |
| ∗Top 15 enriched GO BP terms are showed in the bar plot of each disease state in each tissue. Each row represents a significant GO biological process which is colored according to the -log10(p.adjust). |
| Page: 1 2 3 4 5 6 7 8 9 |
| GO ID | Tissue | Disease Stage | Description | Gene Ratio | Bg Ratio | pvalue | p.adjust | Count |
| GO:00108765 | Liver | NAFLD | lipid localization | 79/1882 | 448/18723 | 4.75e-07 | 2.92e-05 | 79 |
| GO:00068694 | Liver | NAFLD | lipid transport | 71/1882 | 398/18723 | 1.16e-06 | 5.59e-05 | 71 |
| GO:1902001 | Liver | NAFLD | fatty acid transmembrane transport | 6/1882 | 18/18723 | 6.55e-03 | 4.69e-02 | 6 |
| GO:000683912 | Liver | HCC | mitochondrial transport | 184/7958 | 254/18723 | 2.30e-22 | 3.83e-20 | 184 |
| GO:199054212 | Liver | HCC | mitochondrial transmembrane transport | 78/7958 | 102/18723 | 2.73e-12 | 1.26e-10 | 78 |
| GO:000170111 | Liver | HCC | in utero embryonic development | 204/7958 | 367/18723 | 2.44e-07 | 4.30e-06 | 204 |
| GO:001087621 | Liver | HCC | lipid localization | 228/7958 | 448/18723 | 1.80e-04 | 1.41e-03 | 228 |
| GO:000686921 | Liver | HCC | lipid transport | 198/7958 | 398/18723 | 1.92e-03 | 9.78e-03 | 198 |
| GO:19020011 | Liver | HCC | fatty acid transmembrane transport | 14/7958 | 18/18723 | 2.57e-03 | 1.23e-02 | 14 |
| Page: 1 |
| Pathway ID | Tissue | Disease Stage | Description | Gene Ratio | Bg Ratio | pvalue | p.adjust | qvalue | Count |
| hsa0471422 | Liver | HCC | Thermogenesis | 170/4020 | 232/8465 | 5.36e-16 | 2.25e-14 | 1.25e-14 | 170 |
| hsa0471432 | Liver | HCC | Thermogenesis | 170/4020 | 232/8465 | 5.36e-16 | 2.25e-14 | 1.25e-14 | 170 |
| Page: 1 |
Top |
Cell-cell communication analysis |
| Identification of potential cell-cell interactions between two cell types and their ligand-receptor pairs for different disease states |
| Ligand | Receptor | LRpair | Pathway | Tissue | Disease Stage |
| Page: 1 |
Top |
Single-cell gene regulatory network inference analysis |
| Find out the significant the regulons (TFs) and the target genes of each regulon across cell types for different disease states |
| TF | Cell Type | Tissue | Disease Stage | Target Gene | RSS | Regulon Activity |
| ∗The dot plots of a searched regulon are shown for all cell subpopulations in each disease state of each tissue based on the regulon specific score inferred using pySCENIC and by calculating the average expression. |
| Page: 1 |
Top |
Somatic mutation of malignant transformation related genes |
| Annotation of somatic variants for genes involved in malignant transformation |
| Hugo Symbol | Variant Class | Variant Classification | dbSNP RS | HGVSc | HGVSp | HGVSp Short | SWISSPROT | BIOTYPE | SIFT | PolyPhen | Tumor Sample Barcode | Tissue | Histology | Sex | Age | Stage | Therapy Types | Drugs | Outcome |
| SLC25A20 | SNV | Missense_Mutation | c.781G>A | p.Gly261Arg | p.G261R | O43772 | protein_coding | deleterious(0) | probably_damaging(1) | TCGA-A8-A09G-01 | Breast | breast invasive carcinoma | Female | >=65 | III/IV | Unknown | Unknown | SD | |
| SLC25A20 | SNV | Missense_Mutation | c.157N>C | p.Ser53Pro | p.S53P | O43772 | protein_coding | tolerated(0.07) | possibly_damaging(0.555) | TCGA-D8-A1XK-01 | Breast | breast invasive carcinoma | Female | <65 | I/II | Chemotherapy | doxorubicine+cyclophosphamide | SD | |
| SLC25A20 | insertion | Nonsense_Mutation | novel | c.108_109insATCCTGGCTAACACGGTGAAACCCCATCTCTACTAAAAATACAAA | p.Val36_Arg37insIleLeuAlaAsnThrValLysProHisLeuTyrTerLysTyrLys | p.V36_R37insILANTVKPHLY*KYK | O43772 | protein_coding | TCGA-A8-A0A1-01 | Breast | breast invasive carcinoma | Female | >=65 | I/II | Hormone Therapy | tamoxiphen | SD | ||
| SLC25A20 | SNV | Missense_Mutation | c.421C>G | p.Gln141Glu | p.Q141E | O43772 | protein_coding | deleterious(0) | possibly_damaging(0.718) | TCGA-VS-A953-01 | Cervix | cervical & endocervical cancer | Female | <65 | I/II | Unknown | Unknown | PD | |
| SLC25A20 | SNV | Missense_Mutation | novel | c.359N>G | p.Ser120Cys | p.S120C | O43772 | protein_coding | deleterious(0) | probably_damaging(0.987) | TCGA-VS-A959-01 | Cervix | cervical & endocervical cancer | Female | >=65 | I/II | Unknown | Unknown | SD |
| SLC25A20 | SNV | Missense_Mutation | novel | c.91N>G | p.Leu31Val | p.L31V | O43772 | protein_coding | deleterious(0.01) | possibly_damaging(0.861) | TCGA-VS-A9U7-01 | Cervix | cervical & endocervical cancer | Female | <65 | I/II | Chemotherapy | cisplatin | CR |
| SLC25A20 | SNV | Missense_Mutation | novel | c.170N>G | p.Asp57Gly | p.D57G | O43772 | protein_coding | deleterious(0.02) | probably_damaging(0.997) | TCGA-AA-3494-01 | Colorectum | colon adenocarcinoma | Male | <65 | III/IV | Chemotherapy | folinic | PR |
| SLC25A20 | SNV | Missense_Mutation | novel | c.707N>A | p.Arg236Gln | p.R236Q | O43772 | protein_coding | deleterious(0) | probably_damaging(0.996) | TCGA-CA-6717-01 | Colorectum | colon adenocarcinoma | Male | <65 | I/II | Chemotherapy | oxaliplatin | CR |
| SLC25A20 | SNV | Missense_Mutation | novel | c.183N>T | p.Lys61Asn | p.K61N | O43772 | protein_coding | deleterious(0.01) | probably_damaging(0.931) | TCGA-AG-A002-01 | Colorectum | rectum adenocarcinoma | Male | <65 | I/II | Unknown | Unknown | SD |
| SLC25A20 | SNV | Missense_Mutation | novel | c.236N>C | p.Ile79Thr | p.I79T | O43772 | protein_coding | deleterious(0) | possibly_damaging(0.742) | TCGA-A5-A0G1-01 | Endometrium | uterine corpus endometrioid carcinoma | Female | >=65 | I/II | Unknown | Unknown | SD |
| Page: 1 2 3 |
Top |
Related drugs of malignant transformation related genes |
| Identification of chemicals and drugs interact with genes involved in malignant transfromation |
| (DGIdb 4.0) |
| Entrez ID | Symbol | Category | Interaction Types | Drug Claim Name | Drug Name | PMIDs |
| 788 | SLC25A20 | DRUGGABLE GENOME, TRANSPORTER | PROPIONYL-L-CARNITINE |
| Page: 1 |

Copyright 2023-Present -The University of Texas Health Science Center at Houston |