
|
|||||
|
 | |
| |
| |
| |
| |
| |
|
Gene: SLC25A17 |
Gene summary for SLC25A17 |
| Gene information | Species | Human | Gene symbol | SLC25A17 | Gene ID | 10478 |
| Gene name | solute carrier family 25 member 17 | |
| Gene Alias | PMP34 | |
| Cytomap | 22q13.2 | |
| Gene Type | protein-coding | GO ID | GO:0001561 | UniProtAcc | B4DU97 |
Top |
Malignant transformation analysis |
| Identification of the aberrant gene expression in precancerous and cancerous lesions by comparing the gene expression of stem-like cells in diseased tissues with normal stem cells |
| Entrez ID | Symbol | Replicates | Species | Organ | Tissue | Adj P-value | Log2FC | Malignancy |
| 10478 | SLC25A17 | LZE4T | Human | Esophagus | ESCC | 7.51e-08 | 2.27e-01 | 0.0811 |
| 10478 | SLC25A17 | LZE7T | Human | Esophagus | ESCC | 4.38e-10 | 3.84e-01 | 0.0667 |
| 10478 | SLC25A17 | LZE22T | Human | Esophagus | ESCC | 6.60e-05 | 3.00e-01 | 0.068 |
| 10478 | SLC25A17 | LZE24T | Human | Esophagus | ESCC | 7.99e-12 | 2.29e-01 | 0.0596 |
| 10478 | SLC25A17 | LZE6T | Human | Esophagus | ESCC | 2.02e-02 | 1.42e-01 | 0.0845 |
| 10478 | SLC25A17 | P1T-E | Human | Esophagus | ESCC | 6.48e-04 | 2.33e-01 | 0.0875 |
| 10478 | SLC25A17 | P2T-E | Human | Esophagus | ESCC | 3.48e-16 | 3.66e-01 | 0.1177 |
| 10478 | SLC25A17 | P4T-E | Human | Esophagus | ESCC | 6.89e-20 | 4.46e-01 | 0.1323 |
| 10478 | SLC25A17 | P5T-E | Human | Esophagus | ESCC | 3.27e-12 | 3.08e-01 | 0.1327 |
| 10478 | SLC25A17 | P8T-E | Human | Esophagus | ESCC | 1.12e-11 | 2.19e-01 | 0.0889 |
| 10478 | SLC25A17 | P9T-E | Human | Esophagus | ESCC | 1.69e-12 | 2.46e-01 | 0.1131 |
| 10478 | SLC25A17 | P10T-E | Human | Esophagus | ESCC | 2.51e-13 | 3.41e-01 | 0.116 |
| 10478 | SLC25A17 | P11T-E | Human | Esophagus | ESCC | 2.81e-14 | 5.00e-01 | 0.1426 |
| 10478 | SLC25A17 | P12T-E | Human | Esophagus | ESCC | 3.20e-23 | 4.61e-01 | 0.1122 |
| 10478 | SLC25A17 | P15T-E | Human | Esophagus | ESCC | 5.13e-19 | 3.19e-01 | 0.1149 |
| 10478 | SLC25A17 | P16T-E | Human | Esophagus | ESCC | 4.88e-34 | 6.11e-01 | 0.1153 |
| 10478 | SLC25A17 | P17T-E | Human | Esophagus | ESCC | 3.03e-08 | 3.53e-01 | 0.1278 |
| 10478 | SLC25A17 | P19T-E | Human | Esophagus | ESCC | 6.12e-07 | 2.83e-01 | 0.1662 |
| 10478 | SLC25A17 | P20T-E | Human | Esophagus | ESCC | 4.82e-17 | 3.12e-01 | 0.1124 |
| 10478 | SLC25A17 | P21T-E | Human | Esophagus | ESCC | 2.24e-23 | 5.58e-01 | 0.1617 |
| Page: 1 2 3 4 5 |
| Tissue | Expression Dynamics | Abbreviation |
| Esophagus | 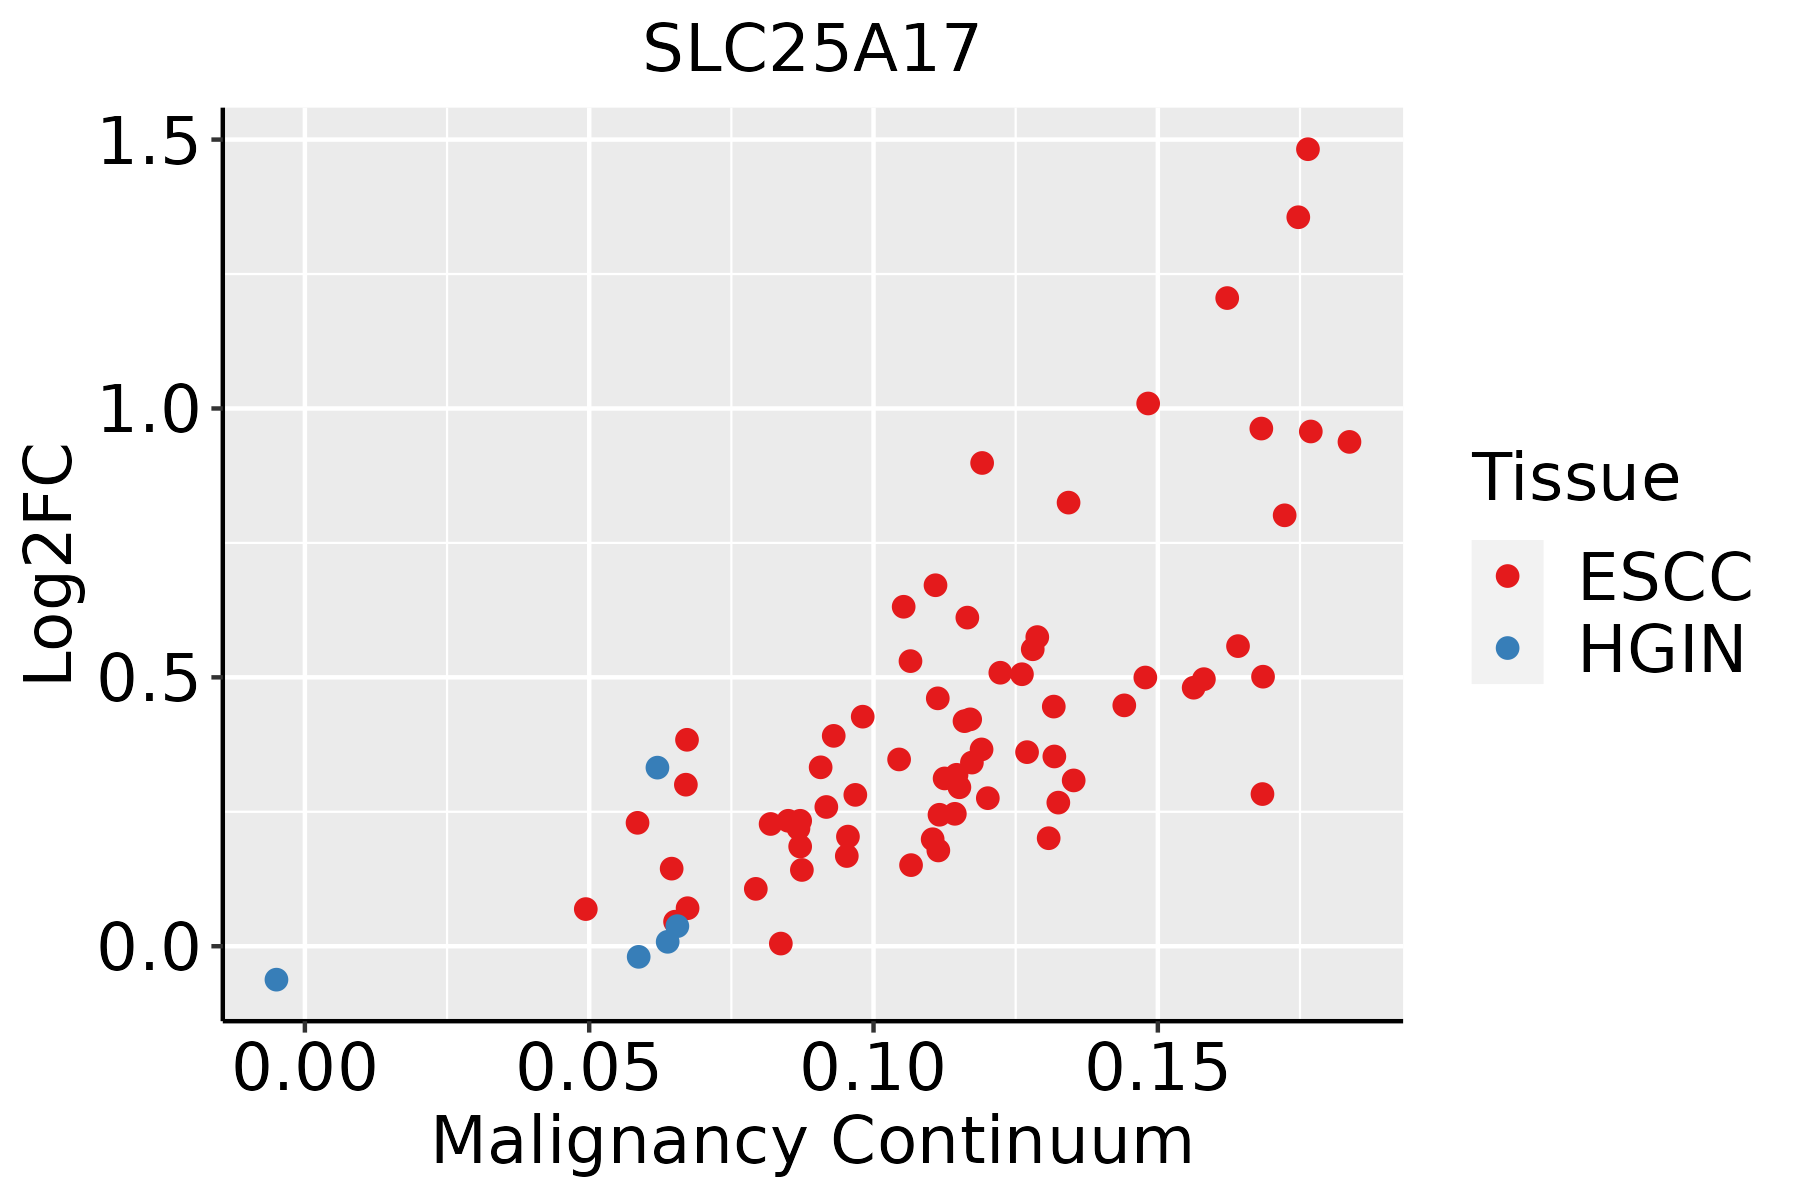 | ESCC: Esophageal squamous cell carcinoma |
| HGIN: High-grade intraepithelial neoplasias | ||
| LGIN: Low-grade intraepithelial neoplasias | ||
| Oral Cavity | 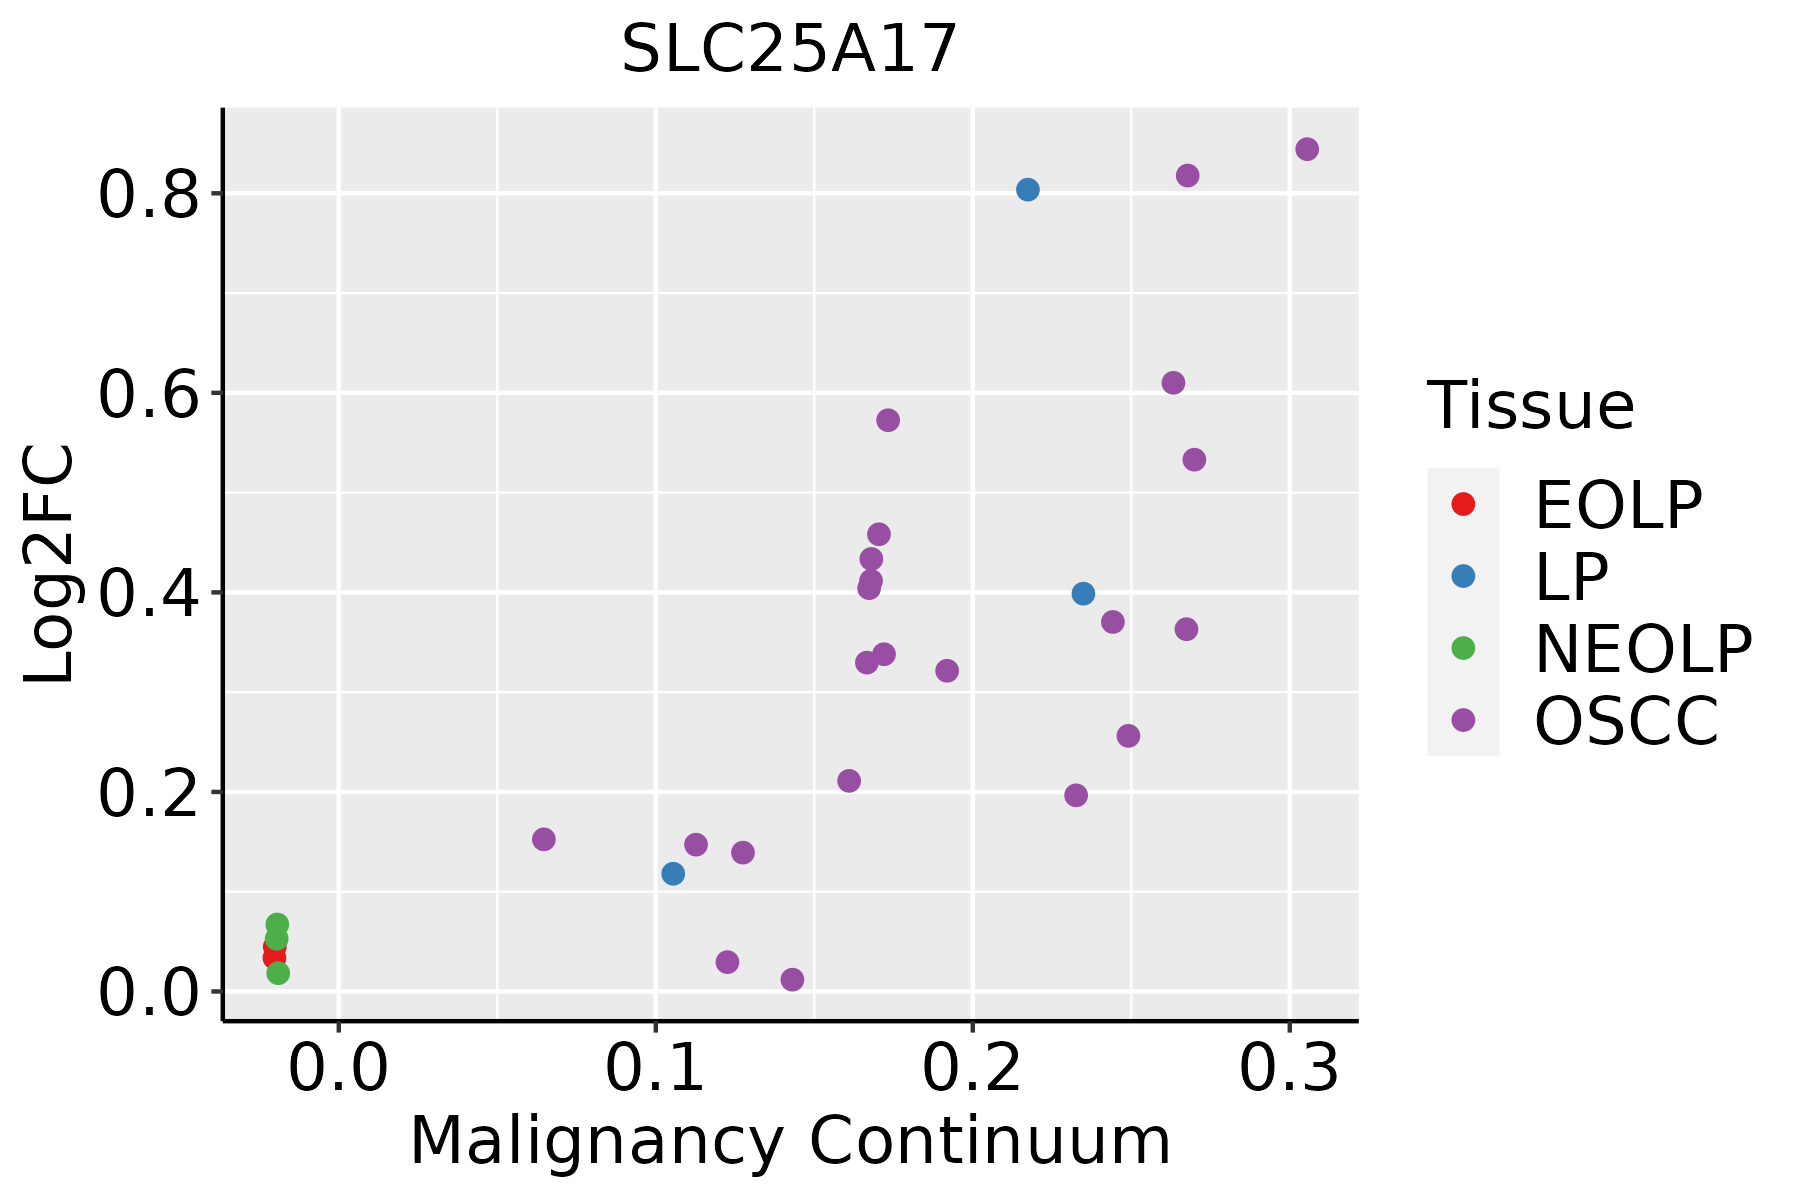 | EOLP: Erosive Oral lichen planus |
| LP: leukoplakia | ||
| NEOLP: Non-erosive oral lichen planus | ||
| OSCC: Oral squamous cell carcinoma | ||
| Skin |  | AK: Actinic keratosis |
| cSCC: Cutaneous squamous cell carcinoma | ||
| SCCIS:squamous cell carcinoma in situ |
| ∗log2FC in expression of this searched gene in stem-like cells from each diseased tissue sample relative to stem-like cells in normal samples in each tissue plotted against the malignancy continuum. Samples are colored based on if they are from different disease stage. |
Top |
Malignant transformation related pathway analysis |
| Find out the enriched GO biological processes and KEGG pathways involved in transition from healthy to precancer to cancer |
| Tissue | Disease Stage | Enriched GO biological Processes |
| Colorectum | AD |  |
| Colorectum | SER |  |
| Colorectum | MSS |  |
| Colorectum | MSI-H |  |
| Colorectum | FAP |  |
| ∗Top 15 enriched GO BP terms are showed in the bar plot of each disease state in each tissue. Each row represents a significant GO biological process which is colored according to the -log10(p.adjust). |
| Page: 1 2 3 4 5 6 7 8 9 |
| GO ID | Tissue | Disease Stage | Description | Gene Ratio | Bg Ratio | pvalue | p.adjust | Count |
| GO:001593117 | Esophagus | ESCC | nucleobase-containing compound transport | 162/8552 | 222/18723 | 9.87e-17 | 7.93e-15 | 162 |
| GO:00193958 | Esophagus | ESCC | fatty acid oxidation | 69/8552 | 103/18723 | 9.95e-06 | 9.44e-05 | 69 |
| GO:00344407 | Esophagus | ESCC | lipid oxidation | 71/8552 | 108/18723 | 2.00e-05 | 1.74e-04 | 71 |
| GO:00090628 | Esophagus | ESCC | fatty acid catabolic process | 66/8552 | 100/18723 | 3.21e-05 | 2.66e-04 | 66 |
| GO:00066318 | Esophagus | ESCC | fatty acid metabolic process | 217/8552 | 390/18723 | 4.21e-05 | 3.39e-04 | 217 |
| GO:00066358 | Esophagus | ESCC | fatty acid beta-oxidation | 50/8552 | 74/18723 | 1.16e-04 | 8.04e-04 | 50 |
| GO:00723297 | Esophagus | ESCC | monocarboxylic acid catabolic process | 74/8552 | 122/18723 | 6.03e-04 | 3.27e-03 | 74 |
| GO:00442427 | Esophagus | ESCC | cellular lipid catabolic process | 121/8552 | 214/18723 | 8.63e-04 | 4.43e-03 | 121 |
| GO:00442827 | Esophagus | ESCC | small molecule catabolic process | 201/8552 | 376/18723 | 1.35e-03 | 6.41e-03 | 201 |
| GO:00302586 | Esophagus | ESCC | lipid modification | 116/8552 | 212/18723 | 4.90e-03 | 1.89e-02 | 116 |
| GO:00160427 | Esophagus | ESCC | lipid catabolic process | 168/8552 | 320/18723 | 7.97e-03 | 2.84e-02 | 168 |
| GO:001593114 | Oral cavity | OSCC | nucleobase-containing compound transport | 150/7305 | 222/18723 | 4.86e-18 | 5.04e-16 | 150 |
| GO:00090627 | Oral cavity | OSCC | fatty acid catabolic process | 59/7305 | 100/18723 | 3.99e-05 | 3.48e-04 | 59 |
| GO:00066317 | Oral cavity | OSCC | fatty acid metabolic process | 186/7305 | 390/18723 | 2.65e-04 | 1.69e-03 | 186 |
| GO:00723296 | Oral cavity | OSCC | monocarboxylic acid catabolic process | 66/7305 | 122/18723 | 5.02e-04 | 2.95e-03 | 66 |
| GO:00193957 | Oral cavity | OSCC | fatty acid oxidation | 57/7305 | 103/18723 | 5.58e-04 | 3.23e-03 | 57 |
| GO:00344406 | Oral cavity | OSCC | lipid oxidation | 59/7305 | 108/18723 | 7.01e-04 | 3.89e-03 | 59 |
| GO:00066357 | Oral cavity | OSCC | fatty acid beta-oxidation | 42/7305 | 74/18723 | 1.47e-03 | 7.09e-03 | 42 |
| GO:00442826 | Oral cavity | OSCC | small molecule catabolic process | 174/7305 | 376/18723 | 2.25e-03 | 1.00e-02 | 174 |
| GO:00442426 | Oral cavity | OSCC | cellular lipid catabolic process | 104/7305 | 214/18723 | 2.61e-03 | 1.15e-02 | 104 |
| Page: 1 2 |
| Pathway ID | Tissue | Disease Stage | Description | Gene Ratio | Bg Ratio | pvalue | p.adjust | qvalue | Count |
| hsa041467 | Esophagus | ESCC | Peroxisome | 55/4205 | 82/8465 | 1.04e-03 | 3.27e-03 | 1.68e-03 | 55 |
| hsa0414612 | Esophagus | ESCC | Peroxisome | 55/4205 | 82/8465 | 1.04e-03 | 3.27e-03 | 1.68e-03 | 55 |
| hsa041466 | Oral cavity | OSCC | Peroxisome | 47/3704 | 82/8465 | 9.01e-03 | 2.01e-02 | 1.03e-02 | 47 |
| hsa0414611 | Oral cavity | OSCC | Peroxisome | 47/3704 | 82/8465 | 9.01e-03 | 2.01e-02 | 1.03e-02 | 47 |
| hsa0414621 | Oral cavity | LP | Peroxisome | 33/2418 | 82/8465 | 1.48e-02 | 4.69e-02 | 3.03e-02 | 33 |
| hsa0414631 | Oral cavity | LP | Peroxisome | 33/2418 | 82/8465 | 1.48e-02 | 4.69e-02 | 3.03e-02 | 33 |
| Page: 1 |
Top |
Cell-cell communication analysis |
| Identification of potential cell-cell interactions between two cell types and their ligand-receptor pairs for different disease states |
| Ligand | Receptor | LRpair | Pathway | Tissue | Disease Stage |
| Page: 1 |
Top |
Single-cell gene regulatory network inference analysis |
| Find out the significant the regulons (TFs) and the target genes of each regulon across cell types for different disease states |
| TF | Cell Type | Tissue | Disease Stage | Target Gene | RSS | Regulon Activity |
| ∗The dot plots of a searched regulon are shown for all cell subpopulations in each disease state of each tissue based on the regulon specific score inferred using pySCENIC and by calculating the average expression. |
| Page: 1 |
Top |
Somatic mutation of malignant transformation related genes |
| Annotation of somatic variants for genes involved in malignant transformation |
| Hugo Symbol | Variant Class | Variant Classification | dbSNP RS | HGVSc | HGVSp | HGVSp Short | SWISSPROT | BIOTYPE | SIFT | PolyPhen | Tumor Sample Barcode | Tissue | Histology | Sex | Age | Stage | Therapy Types | Drugs | Outcome |
| SLC25A17 | SNV | Missense_Mutation | c.585N>T | p.Lys195Asn | p.K195N | O43808 | protein_coding | tolerated(0.33) | benign(0.139) | TCGA-AA-3510-01 | Colorectum | colon adenocarcinoma | Male | >=65 | I/II | Unknown | Unknown | SD | |
| SLC25A17 | SNV | Missense_Mutation | c.662A>G | p.Tyr221Cys | p.Y221C | O43808 | protein_coding | deleterious(0) | probably_damaging(0.999) | TCGA-AA-3715-01 | Colorectum | colon adenocarcinoma | Male | >=65 | I/II | Unknown | Unknown | PD | |
| SLC25A17 | SNV | Missense_Mutation | rs371543259 | c.641N>T | p.Ala214Val | p.A214V | O43808 | protein_coding | tolerated(0.08) | possibly_damaging(0.746) | TCGA-AA-A00N-01 | Colorectum | colon adenocarcinoma | Male | >=65 | I/II | Unknown | Unknown | PD |
| SLC25A17 | SNV | Missense_Mutation | rs765118849 | c.197G>A | p.Arg66Gln | p.R66Q | O43808 | protein_coding | deleterious(0.03) | possibly_damaging(0.603) | TCGA-AG-A002-01 | Colorectum | rectum adenocarcinoma | Male | <65 | I/II | Unknown | Unknown | SD |
| SLC25A17 | SNV | Missense_Mutation | c.713N>C | p.Asn238Thr | p.N238T | O43808 | protein_coding | tolerated(0.28) | benign(0.012) | TCGA-F5-6702-01 | Colorectum | rectum adenocarcinoma | Male | >=65 | I/II | Chemotherapy | oxaliplatin | PD | |
| SLC25A17 | deletion | Frame_Shift_Del | c.84delN | p.Leu30TrpfsTer42 | p.L30Wfs*42 | O43808 | protein_coding | TCGA-5M-AAT6-01 | Colorectum | colon adenocarcinoma | Female | <65 | III/IV | Unknown | Unknown | PD | |||
| SLC25A17 | deletion | Frame_Shift_Del | c.84delN | p.Leu30TrpfsTer42 | p.L30Wfs*42 | O43808 | protein_coding | TCGA-AA-3950-01 | Colorectum | colon adenocarcinoma | Female | >=65 | I/II | Unknown | Unknown | SD | |||
| SLC25A17 | deletion | Frame_Shift_Del | c.84delN | p.Leu30TrpfsTer42 | p.L30Wfs*42 | O43808 | protein_coding | TCGA-D5-6530-01 | Colorectum | colon adenocarcinoma | Male | <65 | I/II | Unknown | Unknown | SD | |||
| SLC25A17 | SNV | Missense_Mutation | novel | c.181N>T | p.Leu61Phe | p.L61F | O43808 | protein_coding | tolerated(0.32) | benign(0.022) | TCGA-A5-A0G1-01 | Endometrium | uterine corpus endometrioid carcinoma | Female | >=65 | I/II | Unknown | Unknown | SD |
| SLC25A17 | SNV | Missense_Mutation | rs372825776 | c.473G>A | p.Arg158His | p.R158H | O43808 | protein_coding | deleterious(0.02) | probably_damaging(0.93) | TCGA-A5-A0G2-01 | Endometrium | uterine corpus endometrioid carcinoma | Female | <65 | III/IV | Unknown | Unknown | SD |
| Page: 1 2 3 4 |
Top |
Related drugs of malignant transformation related genes |
| Identification of chemicals and drugs interact with genes involved in malignant transfromation |
| (DGIdb 4.0) |
| Entrez ID | Symbol | Category | Interaction Types | Drug Claim Name | Drug Name | PMIDs |
| Page: 1 |

Copyright 2023-Present -The University of Texas Health Science Center at Houston |