
|
|||||
|
 | |
| |
| |
| |
| |
| |
|
Gene: SLC25A12 |
Gene summary for SLC25A12 |
| Gene information | Species | Human | Gene symbol | SLC25A12 | Gene ID | 8604 |
| Gene name | solute carrier family 25 member 12 | |
| Gene Alias | AGC1 | |
| Cytomap | 2q31.1 | |
| Gene Type | protein-coding | GO ID | GO:0003008 | UniProtAcc | O75746 |
Top |
Malignant transformation analysis |
| Identification of the aberrant gene expression in precancerous and cancerous lesions by comparing the gene expression of stem-like cells in diseased tissues with normal stem cells |
| Entrez ID | Symbol | Replicates | Species | Organ | Tissue | Adj P-value | Log2FC | Malignancy |
| 8604 | SLC25A12 | CCI_2 | Human | Cervix | CC | 1.16e-04 | 5.37e-01 | 0.5249 |
| 8604 | SLC25A12 | CCI_3 | Human | Cervix | CC | 1.49e-10 | 7.11e-01 | 0.516 |
| 8604 | SLC25A12 | LZE4T | Human | Esophagus | ESCC | 1.84e-07 | 2.64e-01 | 0.0811 |
| 8604 | SLC25A12 | LZE8T | Human | Esophagus | ESCC | 5.42e-04 | 1.24e-01 | 0.067 |
| 8604 | SLC25A12 | P2T-E | Human | Esophagus | ESCC | 3.61e-25 | 3.42e-01 | 0.1177 |
| 8604 | SLC25A12 | P4T-E | Human | Esophagus | ESCC | 1.36e-15 | 3.72e-01 | 0.1323 |
| 8604 | SLC25A12 | P5T-E | Human | Esophagus | ESCC | 1.92e-22 | 3.76e-01 | 0.1327 |
| 8604 | SLC25A12 | P8T-E | Human | Esophagus | ESCC | 4.05e-18 | 1.85e-01 | 0.0889 |
| 8604 | SLC25A12 | P9T-E | Human | Esophagus | ESCC | 1.45e-21 | 5.71e-01 | 0.1131 |
| 8604 | SLC25A12 | P10T-E | Human | Esophagus | ESCC | 1.38e-18 | 2.87e-01 | 0.116 |
| 8604 | SLC25A12 | P11T-E | Human | Esophagus | ESCC | 8.01e-07 | 3.42e-01 | 0.1426 |
| 8604 | SLC25A12 | P12T-E | Human | Esophagus | ESCC | 1.67e-27 | 4.82e-01 | 0.1122 |
| 8604 | SLC25A12 | P15T-E | Human | Esophagus | ESCC | 4.12e-19 | 4.67e-01 | 0.1149 |
| 8604 | SLC25A12 | P16T-E | Human | Esophagus | ESCC | 6.68e-13 | 2.85e-01 | 0.1153 |
| 8604 | SLC25A12 | P17T-E | Human | Esophagus | ESCC | 7.21e-03 | 1.24e-01 | 0.1278 |
| 8604 | SLC25A12 | P19T-E | Human | Esophagus | ESCC | 5.90e-03 | 2.47e-01 | 0.1662 |
| 8604 | SLC25A12 | P20T-E | Human | Esophagus | ESCC | 7.03e-19 | 4.44e-01 | 0.1124 |
| 8604 | SLC25A12 | P21T-E | Human | Esophagus | ESCC | 6.76e-18 | 3.29e-01 | 0.1617 |
| 8604 | SLC25A12 | P22T-E | Human | Esophagus | ESCC | 1.38e-09 | 1.23e-01 | 0.1236 |
| 8604 | SLC25A12 | P23T-E | Human | Esophagus | ESCC | 4.37e-11 | 2.25e-01 | 0.108 |
| Page: 1 2 3 |
| Tissue | Expression Dynamics | Abbreviation |
| Cervix |  | CC: Cervix cancer |
| HSIL_HPV: HPV-infected high-grade squamous intraepithelial lesions | ||
| N_HPV: HPV-infected normal cervix | ||
| Esophagus | 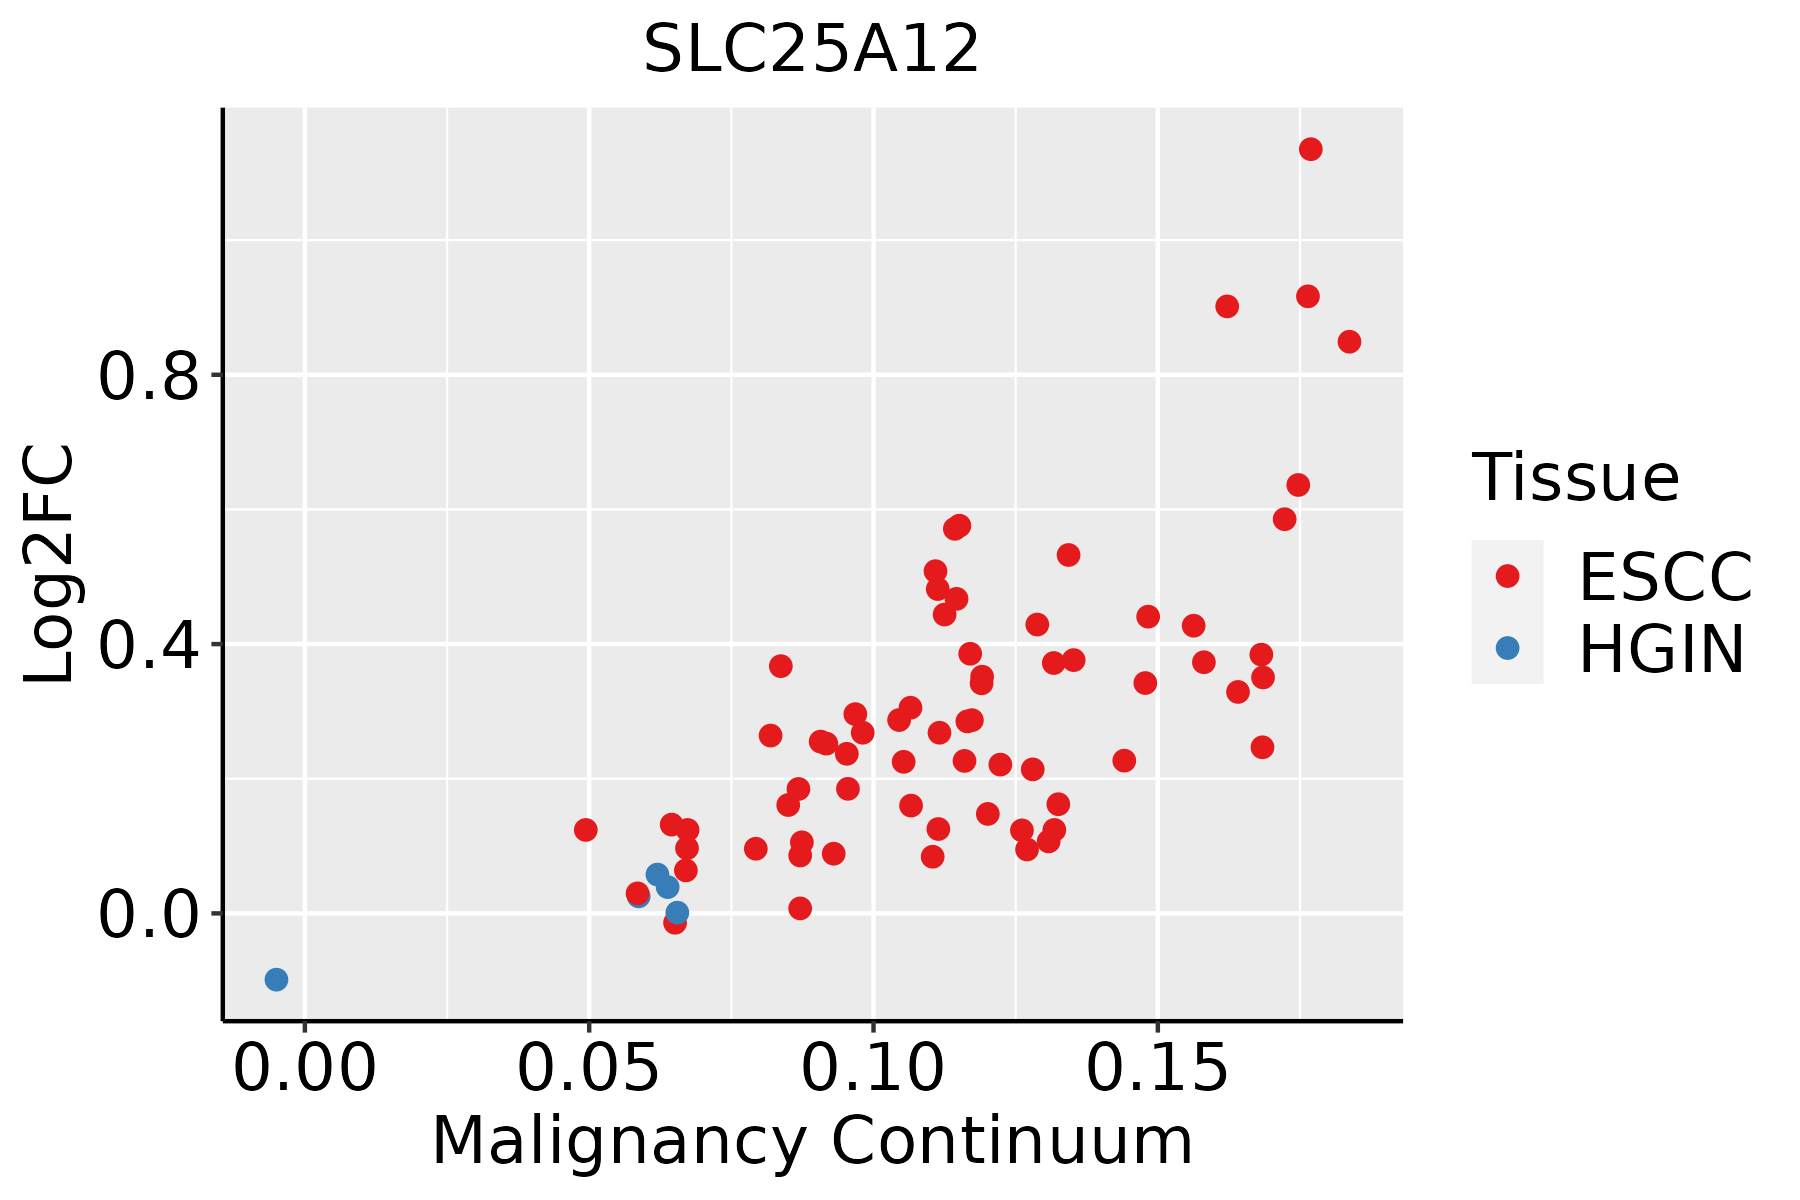 | ESCC: Esophageal squamous cell carcinoma |
| HGIN: High-grade intraepithelial neoplasias | ||
| LGIN: Low-grade intraepithelial neoplasias |
| ∗log2FC in expression of this searched gene in stem-like cells from each diseased tissue sample relative to stem-like cells in normal samples in each tissue plotted against the malignancy continuum. Samples are colored based on if they are from different disease stage. |
Top |
Malignant transformation related pathway analysis |
| Find out the enriched GO biological processes and KEGG pathways involved in transition from healthy to precancer to cancer |
| Tissue | Disease Stage | Enriched GO biological Processes |
| Colorectum | AD |  |
| Colorectum | SER |  |
| Colorectum | MSS |  |
| Colorectum | MSI-H |  |
| Colorectum | FAP |  |
| ∗Top 15 enriched GO BP terms are showed in the bar plot of each disease state in each tissue. Each row represents a significant GO biological process which is colored according to the -log10(p.adjust). |
| Page: 1 2 3 4 5 6 7 8 9 |
| GO ID | Tissue | Disease Stage | Description | Gene Ratio | Bg Ratio | pvalue | p.adjust | Count |
| GO:004603410 | Cervix | CC | ATP metabolic process | 90/2311 | 277/18723 | 7.90e-19 | 2.36e-15 | 90 |
| GO:00229049 | Cervix | CC | respiratory electron transport chain | 42/2311 | 114/18723 | 1.67e-11 | 4.77e-09 | 42 |
| GO:00453339 | Cervix | CC | cellular respiration | 66/2311 | 230/18723 | 2.07e-11 | 5.39e-09 | 66 |
| GO:00229009 | Cervix | CC | electron transport chain | 53/2311 | 175/18723 | 2.23e-10 | 3.43e-08 | 53 |
| GO:00060919 | Cervix | CC | generation of precursor metabolites and energy | 105/2311 | 490/18723 | 7.40e-09 | 6.61e-07 | 105 |
| GO:00159809 | Cervix | CC | energy derivation by oxidation of organic compounds | 74/2311 | 318/18723 | 3.83e-08 | 2.53e-06 | 74 |
| GO:00091449 | Cervix | CC | purine nucleoside triphosphate metabolic process | 29/2311 | 88/18723 | 3.62e-07 | 1.45e-05 | 29 |
| GO:00068399 | Cervix | CC | mitochondrial transport | 60/2311 | 254/18723 | 4.21e-07 | 1.67e-05 | 60 |
| GO:00092058 | Cervix | CC | purine ribonucleoside triphosphate metabolic process | 27/2311 | 82/18723 | 9.24e-07 | 3.25e-05 | 27 |
| GO:00091458 | Cervix | CC | purine nucleoside triphosphate biosynthetic process | 24/2311 | 69/18723 | 1.21e-06 | 4.15e-05 | 24 |
| GO:00091998 | Cervix | CC | ribonucleoside triphosphate metabolic process | 28/2311 | 89/18723 | 1.65e-06 | 5.44e-05 | 28 |
| GO:00067548 | Cervix | CC | ATP biosynthetic process | 21/2311 | 57/18723 | 1.91e-06 | 5.97e-05 | 21 |
| GO:000989510 | Cervix | CC | negative regulation of catabolic process | 69/2311 | 320/18723 | 2.15e-06 | 6.55e-05 | 69 |
| GO:00092068 | Cervix | CC | purine ribonucleoside triphosphate biosynthetic process | 23/2311 | 68/18723 | 3.47e-06 | 9.26e-05 | 23 |
| GO:00092018 | Cervix | CC | ribonucleoside triphosphate biosynthetic process | 24/2311 | 74/18723 | 4.95e-06 | 1.24e-04 | 24 |
| GO:00091419 | Cervix | CC | nucleoside triphosphate metabolic process | 31/2311 | 112/18723 | 9.38e-06 | 2.11e-04 | 31 |
| GO:00091428 | Cervix | CC | nucleoside triphosphate biosynthetic process | 25/2311 | 85/18723 | 2.17e-05 | 3.89e-04 | 25 |
| GO:19905428 | Cervix | CC | mitochondrial transmembrane transport | 26/2311 | 102/18723 | 2.10e-04 | 2.39e-03 | 26 |
| GO:00196939 | Cervix | CC | ribose phosphate metabolic process | 72/2311 | 396/18723 | 4.49e-04 | 4.48e-03 | 72 |
| GO:00092599 | Cervix | CC | ribonucleotide metabolic process | 70/2311 | 385/18723 | 5.35e-04 | 5.18e-03 | 70 |
| Page: 1 2 3 4 5 |
| Pathway ID | Tissue | Disease Stage | Description | Gene Ratio | Bg Ratio | pvalue | p.adjust | qvalue | Count |
| Page: 1 |
Top |
Cell-cell communication analysis |
| Identification of potential cell-cell interactions between two cell types and their ligand-receptor pairs for different disease states |
| Ligand | Receptor | LRpair | Pathway | Tissue | Disease Stage |
| Page: 1 |
Top |
Single-cell gene regulatory network inference analysis |
| Find out the significant the regulons (TFs) and the target genes of each regulon across cell types for different disease states |
| TF | Cell Type | Tissue | Disease Stage | Target Gene | RSS | Regulon Activity |
| ∗The dot plots of a searched regulon are shown for all cell subpopulations in each disease state of each tissue based on the regulon specific score inferred using pySCENIC and by calculating the average expression. |
| Page: 1 |
Top |
Somatic mutation of malignant transformation related genes |
| Annotation of somatic variants for genes involved in malignant transformation |
| Hugo Symbol | Variant Class | Variant Classification | dbSNP RS | HGVSc | HGVSp | HGVSp Short | SWISSPROT | BIOTYPE | SIFT | PolyPhen | Tumor Sample Barcode | Tissue | Histology | Sex | Age | Stage | Therapy Types | Drugs | Outcome |
| SLC25A12 | SNV | Missense_Mutation | c.257N>A | p.Ala86Asp | p.A86D | O75746 | protein_coding | tolerated(0.47) | benign(0.005) | TCGA-A2-A25A-01 | Breast | breast invasive carcinoma | Female | <65 | I/II | Unspecific | Cytoxan | SD | |
| SLC25A12 | SNV | Missense_Mutation | c.1369N>A | p.Ala457Thr | p.A457T | O75746 | protein_coding | deleterious(0.01) | probably_damaging(0.989) | TCGA-A8-A09Z-01 | Breast | breast invasive carcinoma | Female | >=65 | I/II | Unknown | Unknown | SD | |
| SLC25A12 | SNV | Missense_Mutation | c.805N>C | p.Asp269His | p.D269H | O75746 | protein_coding | deleterious(0) | possibly_damaging(0.841) | TCGA-AC-A23H-01 | Breast | breast invasive carcinoma | Female | >=65 | I/II | Unknown | Unknown | PD | |
| SLC25A12 | SNV | Missense_Mutation | c.1919N>A | p.Arg640Lys | p.R640K | O75746 | protein_coding | tolerated(0.28) | benign(0.012) | TCGA-BH-A0B6-01 | Breast | breast invasive carcinoma | Female | <65 | I/II | Unknown | Unknown | SD | |
| SLC25A12 | SNV | Missense_Mutation | c.1583N>T | p.Ala528Val | p.A528V | O75746 | protein_coding | deleterious(0) | probably_damaging(0.999) | TCGA-BH-A1FU-01 | Breast | breast invasive carcinoma | Female | <65 | I/II | Unknown | Unknown | PD | |
| SLC25A12 | SNV | Missense_Mutation | c.1885N>T | p.Pro629Ser | p.P629S | O75746 | protein_coding | tolerated(0.16) | benign(0.028) | TCGA-BH-A8FZ-01 | Breast | breast invasive carcinoma | Female | <65 | I/II | Unknown | Unknown | SD | |
| SLC25A12 | SNV | Missense_Mutation | c.1871N>A | p.Arg624His | p.R624H | O75746 | protein_coding | tolerated(0.27) | benign(0.003) | TCGA-D8-A1XQ-01 | Breast | breast invasive carcinoma | Female | >=65 | I/II | Unknown | Unknown | SD | |
| SLC25A12 | SNV | Missense_Mutation | novel | c.1594G>C | p.Ala532Pro | p.A532P | O75746 | protein_coding | deleterious(0) | possibly_damaging(0.651) | TCGA-LL-A441-01 | Breast | breast invasive carcinoma | Female | <65 | I/II | Chemotherapy | taxotere | CR |
| SLC25A12 | SNV | Missense_Mutation | rs769103731 | c.1931C>T | p.Ala644Val | p.A644V | O75746 | protein_coding | tolerated(0.06) | possibly_damaging(0.792) | TCGA-2W-A8YY-01 | Cervix | cervical & endocervical cancer | Female | <65 | I/II | Chemotherapy | cisplatin | CR |
| SLC25A12 | SNV | Missense_Mutation | c.1525C>G | p.Leu509Val | p.L509V | O75746 | protein_coding | tolerated(0.14) | benign(0.292) | TCGA-IR-A3LA-01 | Cervix | cervical & endocervical cancer | Female | <65 | I/II | Chemotherapy | cisplatin | CR |
| Page: 1 2 3 4 5 6 7 8 9 |
Top |
Related drugs of malignant transformation related genes |
| Identification of chemicals and drugs interact with genes involved in malignant transfromation |
| (DGIdb 4.0) |
| Entrez ID | Symbol | Category | Interaction Types | Drug Claim Name | Drug Name | PMIDs |
| Page: 1 |

Copyright 2023-Present -The University of Texas Health Science Center at Houston |