
|
|||||
|
 | |
| |
| |
| |
| |
| |
|
Gene: SLC25A11 |
Gene summary for SLC25A11 |
| Gene information | Species | Human | Gene symbol | SLC25A11 | Gene ID | 8402 |
| Gene name | solute carrier family 25 member 11 | |
| Gene Alias | OGC | |
| Cytomap | 17p13.2 | |
| Gene Type | protein-coding | GO ID | GO:0006810 | UniProtAcc | Q6IBH0 |
Top |
Malignant transformation analysis |
| Identification of the aberrant gene expression in precancerous and cancerous lesions by comparing the gene expression of stem-like cells in diseased tissues with normal stem cells |
| Entrez ID | Symbol | Replicates | Species | Organ | Tissue | Adj P-value | Log2FC | Malignancy |
| 8402 | SLC25A11 | LZE2T | Human | Esophagus | ESCC | 3.68e-02 | 2.38e-01 | 0.082 |
| 8402 | SLC25A11 | LZE4T | Human | Esophagus | ESCC | 2.28e-13 | 5.05e-01 | 0.0811 |
| 8402 | SLC25A11 | LZE7T | Human | Esophagus | ESCC | 2.92e-05 | 5.74e-01 | 0.0667 |
| 8402 | SLC25A11 | LZE8T | Human | Esophagus | ESCC | 2.07e-05 | 1.40e-01 | 0.067 |
| 8402 | SLC25A11 | LZE22D1 | Human | Esophagus | HGIN | 8.35e-04 | 1.67e-01 | 0.0595 |
| 8402 | SLC25A11 | LZE24T | Human | Esophagus | ESCC | 3.66e-27 | 7.26e-01 | 0.0596 |
| 8402 | SLC25A11 | LZE22D3 | Human | Esophagus | HGIN | 1.65e-02 | 4.60e-01 | 0.0653 |
| 8402 | SLC25A11 | LZE21T | Human | Esophagus | ESCC | 3.97e-03 | 4.42e-01 | 0.0655 |
| 8402 | SLC25A11 | LZE6T | Human | Esophagus | ESCC | 1.28e-04 | 3.79e-01 | 0.0845 |
| 8402 | SLC25A11 | P1T-E | Human | Esophagus | ESCC | 2.60e-12 | 6.89e-01 | 0.0875 |
| 8402 | SLC25A11 | P2T-E | Human | Esophagus | ESCC | 3.55e-50 | 9.79e-01 | 0.1177 |
| 8402 | SLC25A11 | P4T-E | Human | Esophagus | ESCC | 1.36e-46 | 1.03e+00 | 0.1323 |
| 8402 | SLC25A11 | P5T-E | Human | Esophagus | ESCC | 1.44e-15 | 4.69e-01 | 0.1327 |
| 8402 | SLC25A11 | P8T-E | Human | Esophagus | ESCC | 2.39e-30 | 7.00e-01 | 0.0889 |
| 8402 | SLC25A11 | P9T-E | Human | Esophagus | ESCC | 3.15e-19 | 5.12e-01 | 0.1131 |
| 8402 | SLC25A11 | P10T-E | Human | Esophagus | ESCC | 2.93e-26 | 5.11e-01 | 0.116 |
| 8402 | SLC25A11 | P11T-E | Human | Esophagus | ESCC | 8.97e-25 | 8.67e-01 | 0.1426 |
| 8402 | SLC25A11 | P12T-E | Human | Esophagus | ESCC | 1.47e-40 | 9.00e-01 | 0.1122 |
| 8402 | SLC25A11 | P15T-E | Human | Esophagus | ESCC | 6.86e-21 | 5.00e-01 | 0.1149 |
| 8402 | SLC25A11 | P16T-E | Human | Esophagus | ESCC | 1.38e-57 | 1.05e+00 | 0.1153 |
| Page: 1 2 3 4 5 6 7 |
| Tissue | Expression Dynamics | Abbreviation |
| Esophagus |  | ESCC: Esophageal squamous cell carcinoma |
| HGIN: High-grade intraepithelial neoplasias | ||
| LGIN: Low-grade intraepithelial neoplasias | ||
| Liver |  | HCC: Hepatocellular carcinoma |
| NAFLD: Non-alcoholic fatty liver disease | ||
| Oral Cavity | 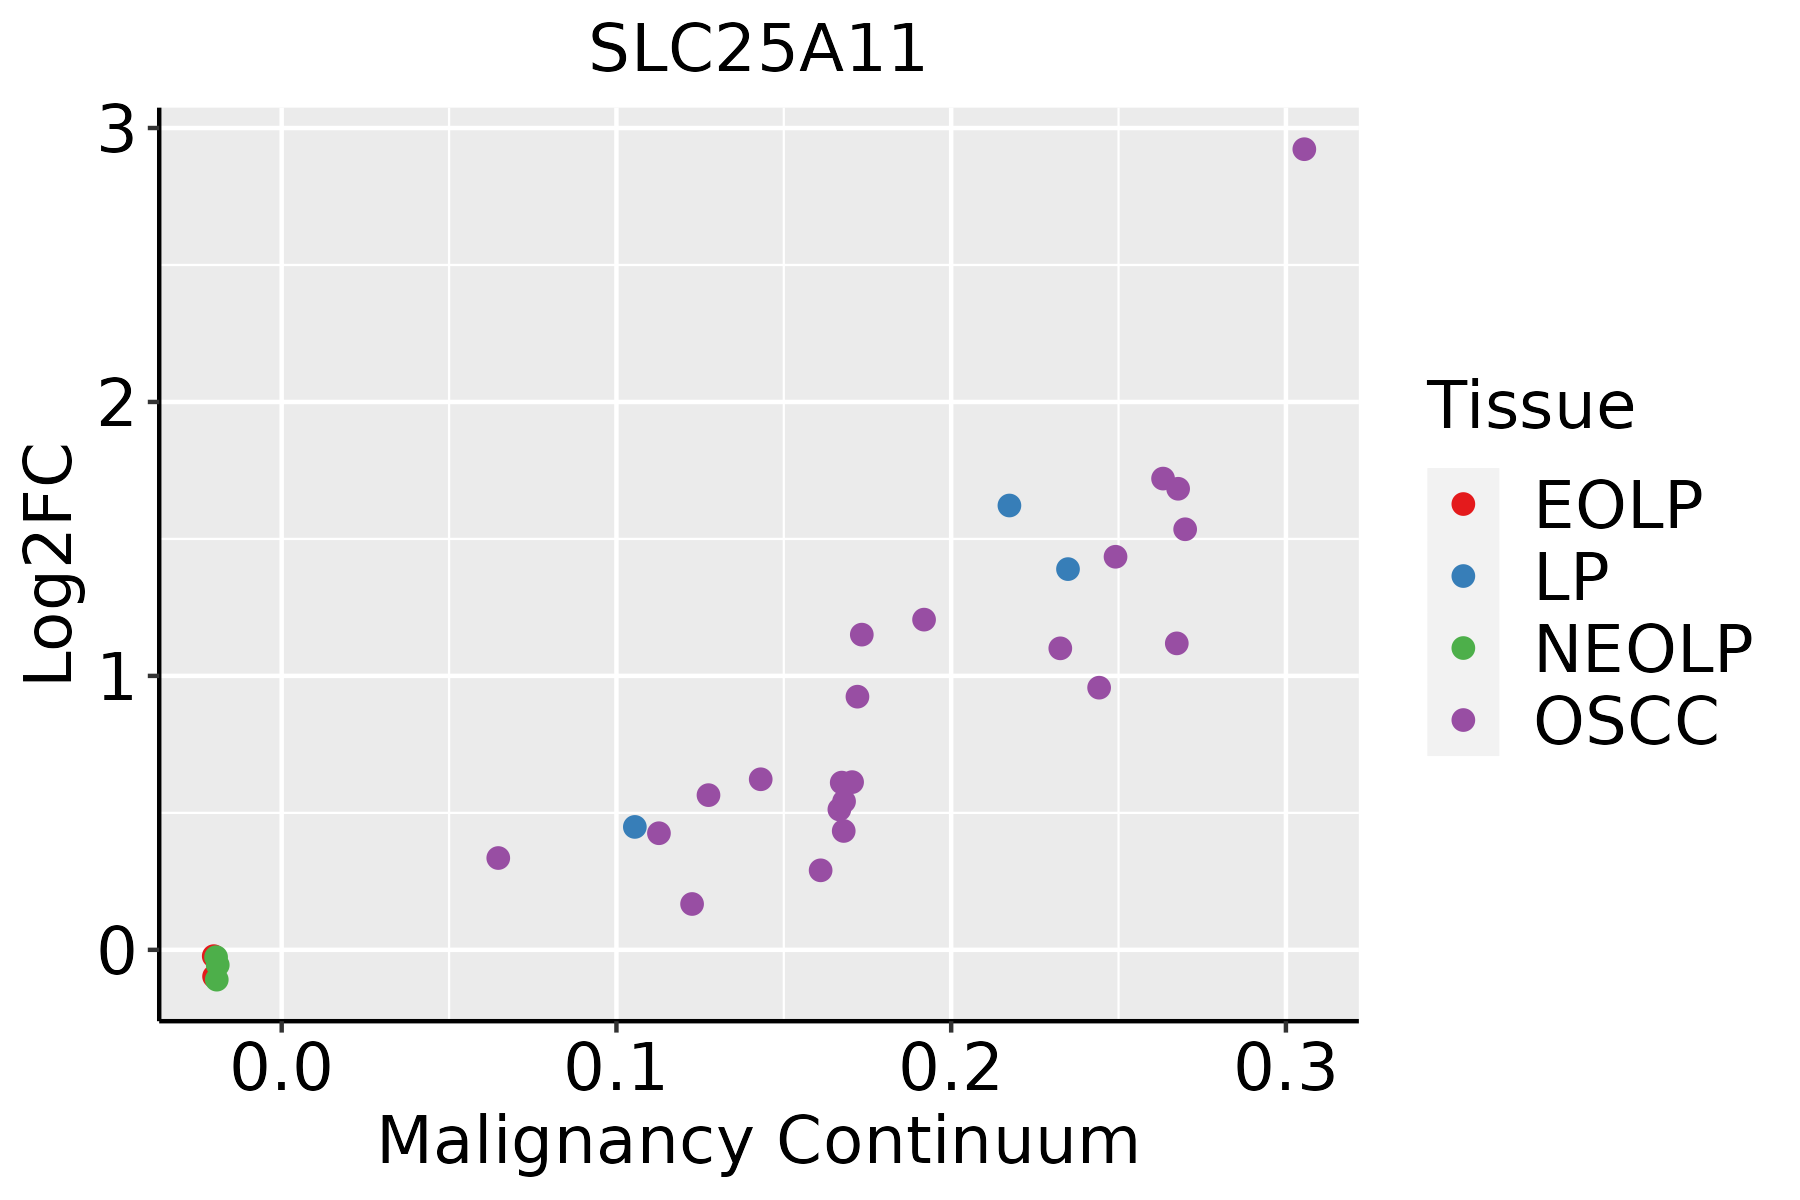 | EOLP: Erosive Oral lichen planus |
| LP: leukoplakia | ||
| NEOLP: Non-erosive oral lichen planus | ||
| OSCC: Oral squamous cell carcinoma | ||
| Skin |  | AK: Actinic keratosis |
| cSCC: Cutaneous squamous cell carcinoma | ||
| SCCIS:squamous cell carcinoma in situ | ||
| Thyroid |  | ATC: Anaplastic thyroid cancer |
| HT: Hashimoto's thyroiditis | ||
| PTC: Papillary thyroid cancer |
| ∗log2FC in expression of this searched gene in stem-like cells from each diseased tissue sample relative to stem-like cells in normal samples in each tissue plotted against the malignancy continuum. Samples are colored based on if they are from different disease stage. |
Top |
Malignant transformation related pathway analysis |
| Find out the enriched GO biological processes and KEGG pathways involved in transition from healthy to precancer to cancer |
| Tissue | Disease Stage | Enriched GO biological Processes |
| Colorectum | AD |  |
| Colorectum | SER |  |
| Colorectum | MSS |  |
| Colorectum | MSI-H |  |
| Colorectum | FAP |  |
| ∗Top 15 enriched GO BP terms are showed in the bar plot of each disease state in each tissue. Each row represents a significant GO biological process which is colored according to the -log10(p.adjust). |
| Page: 1 2 3 4 5 6 7 8 9 |
| GO ID | Tissue | Disease Stage | Description | Gene Ratio | Bg Ratio | pvalue | p.adjust | Count |
| Page: 1 |
| Pathway ID | Tissue | Disease Stage | Description | Gene Ratio | Bg Ratio | pvalue | p.adjust | qvalue | Count |
| Page: 1 |
Top |
Cell-cell communication analysis |
| Identification of potential cell-cell interactions between two cell types and their ligand-receptor pairs for different disease states |
| Ligand | Receptor | LRpair | Pathway | Tissue | Disease Stage |
| Page: 1 |
Top |
Single-cell gene regulatory network inference analysis |
| Find out the significant the regulons (TFs) and the target genes of each regulon across cell types for different disease states |
| TF | Cell Type | Tissue | Disease Stage | Target Gene | RSS | Regulon Activity |
| ∗The dot plots of a searched regulon are shown for all cell subpopulations in each disease state of each tissue based on the regulon specific score inferred using pySCENIC and by calculating the average expression. |
| Page: 1 |
Top |
Somatic mutation of malignant transformation related genes |
| Annotation of somatic variants for genes involved in malignant transformation |
| Hugo Symbol | Variant Class | Variant Classification | dbSNP RS | HGVSc | HGVSp | HGVSp Short | SWISSPROT | BIOTYPE | SIFT | PolyPhen | Tumor Sample Barcode | Tissue | Histology | Sex | Age | Stage | Therapy Types | Drugs | Outcome |
| SLC25A11 | SNV | Missense_Mutation | c.776A>G | p.Tyr259Cys | p.Y259C | Q02978 | protein_coding | deleterious(0) | probably_damaging(0.998) | TCGA-E9-A1ND-01 | Breast | breast invasive carcinoma | Female | >=65 | I/II | Hormone Therapy | aromasin | SD | |
| SLC25A11 | SNV | Missense_Mutation | novel | c.268N>T | p.Arg90Cys | p.R90C | Q02978 | protein_coding | deleterious(0) | probably_damaging(1) | TCGA-EA-A3HU-01 | Cervix | cervical & endocervical cancer | Female | <65 | I/II | Unknown | Unknown | SD |
| SLC25A11 | SNV | Missense_Mutation | rs370162748 | c.926N>A | p.Arg309His | p.R309H | Q02978 | protein_coding | deleterious(0.03) | benign(0.005) | TCGA-A6-6653-01 | Colorectum | colon adenocarcinoma | Male | >=65 | I/II | Unknown | Unknown | SD |
| SLC25A11 | SNV | Missense_Mutation | c.370G>A | p.Val124Met | p.V124M | Q02978 | protein_coding | tolerated(0.26) | benign(0.01) | TCGA-G4-6320-01 | Colorectum | colon adenocarcinoma | Male | >=65 | III/IV | Chemotherapy | oxaliplatin | SD | |
| SLC25A11 | SNV | Missense_Mutation | novel | c.580N>A | p.Val194Ile | p.V194I | Q02978 | protein_coding | deleterious(0.01) | possibly_damaging(0.547) | TCGA-AJ-A3EK-01 | Endometrium | uterine corpus endometrioid carcinoma | Female | <65 | I/II | Chemotherapy | carboplatin | CR |
| SLC25A11 | SNV | Missense_Mutation | c.916N>A | p.Ala306Thr | p.A306T | Q02978 | protein_coding | tolerated(0.39) | benign(0.155) | TCGA-AP-A059-01 | Endometrium | uterine corpus endometrioid carcinoma | Female | >=65 | I/II | Unknown | Unknown | SD | |
| SLC25A11 | SNV | Missense_Mutation | c.503T>G | p.Leu168Arg | p.L168R | Q02978 | protein_coding | deleterious(0) | probably_damaging(0.989) | TCGA-AP-A0LM-01 | Endometrium | uterine corpus endometrioid carcinoma | Female | <65 | III/IV | Chemotherapy | cisplatin | SD | |
| SLC25A11 | SNV | Missense_Mutation | rs775110172 | c.499N>A | p.Ala167Thr | p.A167T | Q02978 | protein_coding | deleterious(0) | probably_damaging(0.987) | TCGA-AX-A0J1-01 | Endometrium | uterine corpus endometrioid carcinoma | Female | >=65 | I/II | Unknown | Unknown | SD |
| SLC25A11 | SNV | Missense_Mutation | c.195N>A | p.Phe65Leu | p.F65L | Q02978 | protein_coding | tolerated(0.52) | benign(0.003) | TCGA-AX-A1CE-01 | Endometrium | uterine corpus endometrioid carcinoma | Female | <65 | I/II | Unspecific | Paclitaxel | SD | |
| SLC25A11 | SNV | Missense_Mutation | novel | c.897C>A | p.Phe299Leu | p.F299L | Q02978 | protein_coding | tolerated(0.2) | benign(0.029) | TCGA-AX-A2HC-01 | Endometrium | uterine corpus endometrioid carcinoma | Female | <65 | III/IV | Chemotherapy | paclitaxel | PD |
| Page: 1 2 3 |
Top |
Related drugs of malignant transformation related genes |
| Identification of chemicals and drugs interact with genes involved in malignant transfromation |
| (DGIdb 4.0) |
| Entrez ID | Symbol | Category | Interaction Types | Drug Claim Name | Drug Name | PMIDs |
| Page: 1 |

Copyright 2023-Present -The University of Texas Health Science Center at Houston |