
|
|||||
|
 | |
| |
| |
| |
| |
| |
|
Gene: SLC25A10 |
Gene summary for SLC25A10 |
| Gene information | Species | Human | Gene symbol | SLC25A10 | Gene ID | 1468 |
| Gene name | solute carrier family 25 member 10 | |
| Gene Alias | DIC | |
| Cytomap | 17q25.3 | |
| Gene Type | protein-coding | GO ID | GO:0005975 | UniProtAcc | A0A0S2Z3G3 |
Top |
Malignant transformation analysis |
| Identification of the aberrant gene expression in precancerous and cancerous lesions by comparing the gene expression of stem-like cells in diseased tissues with normal stem cells |
| Entrez ID | Symbol | Replicates | Species | Organ | Tissue | Adj P-value | Log2FC | Malignancy |
| 1468 | SLC25A10 | HCC1_Meng | Human | Liver | HCC | 4.16e-34 | 7.64e-02 | 0.0246 |
| 1468 | SLC25A10 | HCC2_Meng | Human | Liver | HCC | 3.42e-09 | 7.49e-02 | 0.0107 |
| 1468 | SLC25A10 | HCC1 | Human | Liver | HCC | 1.97e-05 | 3.03e+00 | 0.5336 |
| 1468 | SLC25A10 | HCC2 | Human | Liver | HCC | 1.59e-13 | 3.20e+00 | 0.5341 |
| 1468 | SLC25A10 | S014 | Human | Liver | HCC | 7.03e-14 | 5.89e-01 | 0.2254 |
| 1468 | SLC25A10 | S015 | Human | Liver | HCC | 1.05e-27 | 1.00e+00 | 0.2375 |
| 1468 | SLC25A10 | S016 | Human | Liver | HCC | 7.23e-16 | 6.17e-01 | 0.2243 |
| 1468 | SLC25A10 | S027 | Human | Liver | HCC | 7.56e-04 | 4.95e-01 | 0.2446 |
| 1468 | SLC25A10 | S028 | Human | Liver | HCC | 1.55e-13 | 5.51e-01 | 0.2503 |
| 1468 | SLC25A10 | S029 | Human | Liver | HCC | 3.34e-09 | 3.72e-01 | 0.2581 |
| 1468 | SLC25A10 | C04 | Human | Oral cavity | OSCC | 1.03e-05 | 4.26e-01 | 0.2633 |
| 1468 | SLC25A10 | C21 | Human | Oral cavity | OSCC | 2.15e-06 | 3.48e-01 | 0.2678 |
| 1468 | SLC25A10 | C30 | Human | Oral cavity | OSCC | 7.15e-19 | 9.95e-01 | 0.3055 |
| 1468 | SLC25A10 | C43 | Human | Oral cavity | OSCC | 3.42e-17 | 3.57e-01 | 0.1704 |
| 1468 | SLC25A10 | C46 | Human | Oral cavity | OSCC | 4.49e-08 | 2.95e-01 | 0.1673 |
| 1468 | SLC25A10 | C51 | Human | Oral cavity | OSCC | 2.16e-04 | 4.20e-01 | 0.2674 |
| 1468 | SLC25A10 | C57 | Human | Oral cavity | OSCC | 4.41e-05 | 3.58e-01 | 0.1679 |
| 1468 | SLC25A10 | C06 | Human | Oral cavity | OSCC | 4.61e-02 | 5.16e-01 | 0.2699 |
| 1468 | SLC25A10 | C08 | Human | Oral cavity | OSCC | 3.05e-18 | 4.57e-01 | 0.1919 |
| 1468 | SLC25A10 | C09 | Human | Oral cavity | OSCC | 1.45e-04 | 2.95e-01 | 0.1431 |
| Page: 1 2 |
| Tissue | Expression Dynamics | Abbreviation |
| Liver | 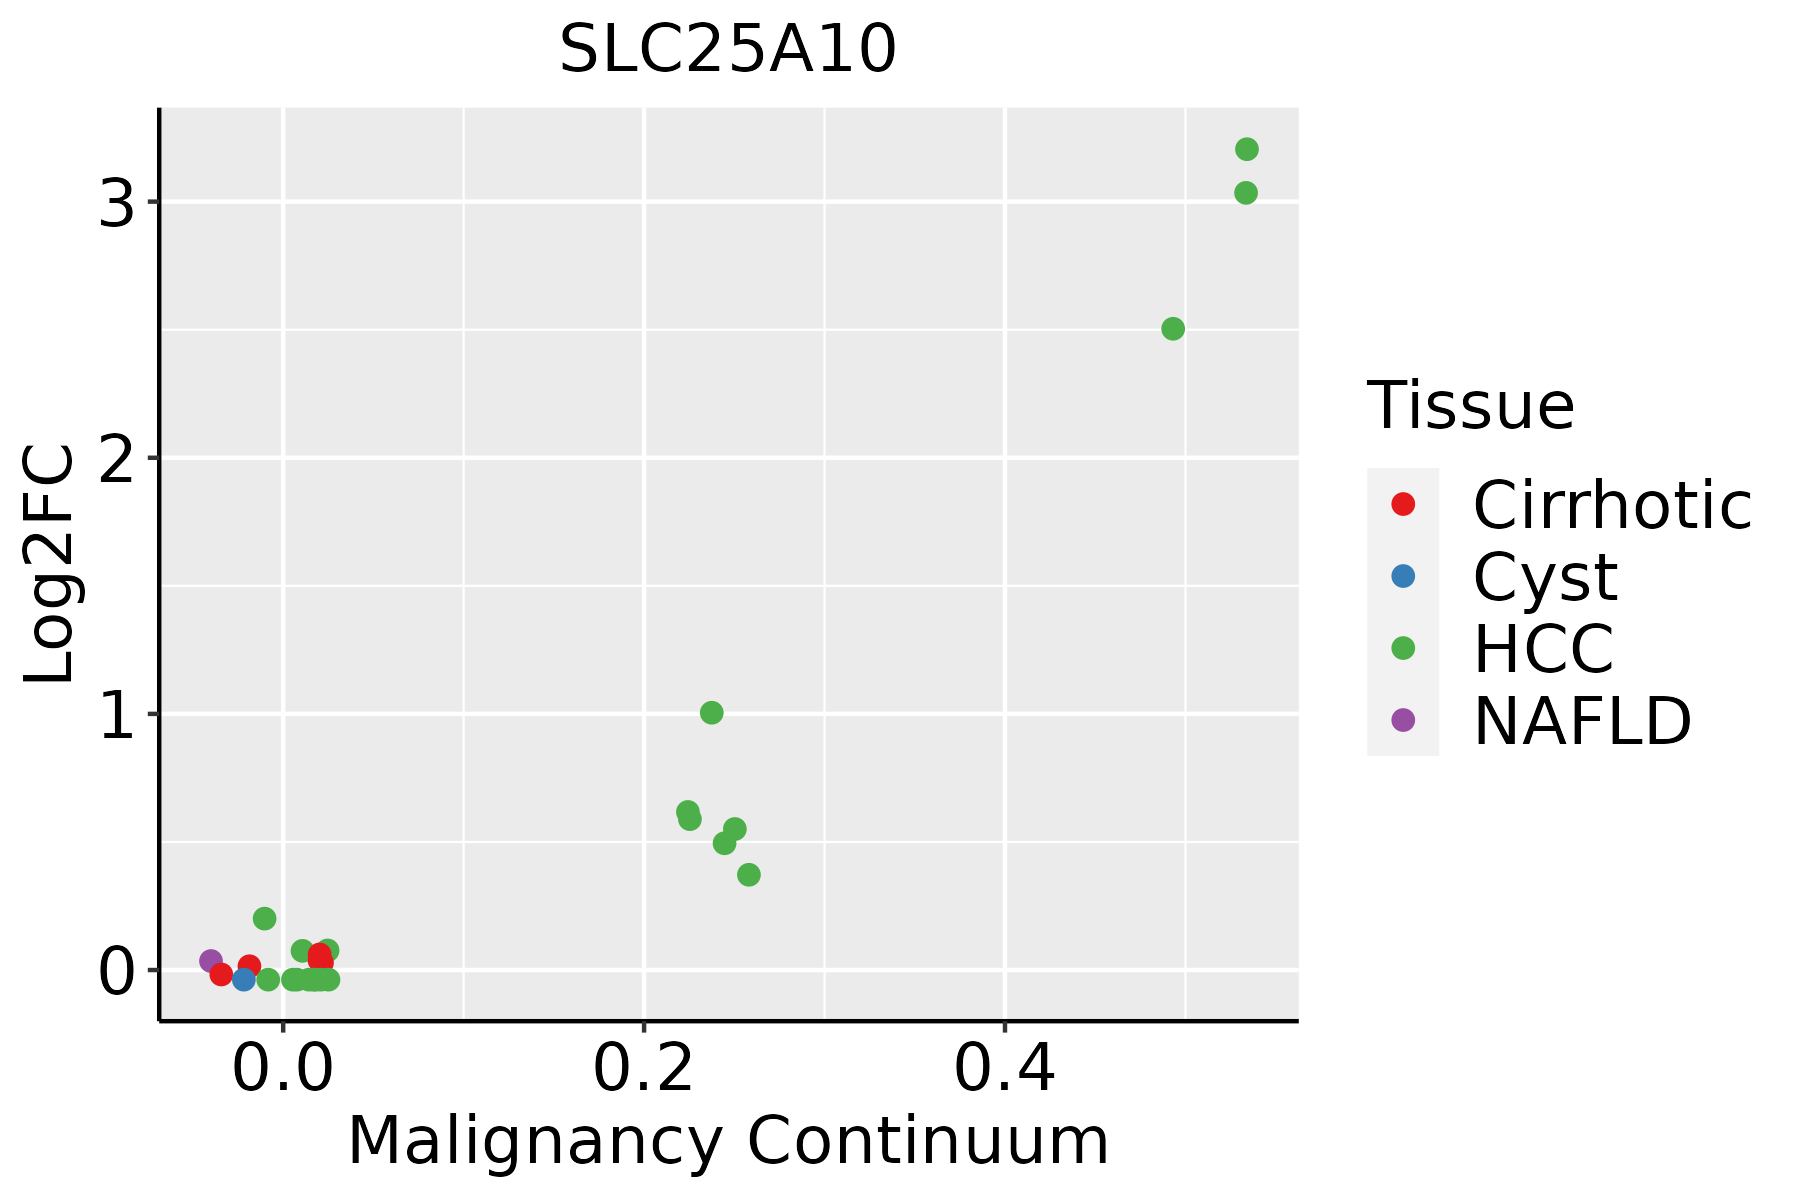 | HCC: Hepatocellular carcinoma |
| NAFLD: Non-alcoholic fatty liver disease | ||
| Oral Cavity |  | EOLP: Erosive Oral lichen planus |
| LP: leukoplakia | ||
| NEOLP: Non-erosive oral lichen planus | ||
| OSCC: Oral squamous cell carcinoma |
| ∗log2FC in expression of this searched gene in stem-like cells from each diseased tissue sample relative to stem-like cells in normal samples in each tissue plotted against the malignancy continuum. Samples are colored based on if they are from different disease stage. |
Top |
Malignant transformation related pathway analysis |
| Find out the enriched GO biological processes and KEGG pathways involved in transition from healthy to precancer to cancer |
| Tissue | Disease Stage | Enriched GO biological Processes |
| Colorectum | AD |  |
| Colorectum | SER |  |
| Colorectum | MSS |  |
| Colorectum | MSI-H |  |
| Colorectum | FAP |  |
| ∗Top 15 enriched GO BP terms are showed in the bar plot of each disease state in each tissue. Each row represents a significant GO biological process which is colored according to the -log10(p.adjust). |
| Page: 1 2 3 4 5 6 7 8 9 |
| GO ID | Tissue | Disease Stage | Description | Gene Ratio | Bg Ratio | pvalue | p.adjust | Count |
| GO:000683912 | Liver | HCC | mitochondrial transport | 184/7958 | 254/18723 | 2.30e-22 | 3.83e-20 | 184 |
| GO:000679021 | Liver | HCC | sulfur compound metabolic process | 212/7958 | 339/18723 | 5.60e-14 | 3.39e-12 | 212 |
| GO:000599621 | Liver | HCC | monosaccharide metabolic process | 167/7958 | 257/18723 | 2.31e-13 | 1.25e-11 | 167 |
| GO:001931821 | Liver | HCC | hexose metabolic process | 155/7958 | 237/18723 | 7.63e-13 | 3.90e-11 | 155 |
| GO:000600621 | Liver | HCC | glucose metabolic process | 128/7958 | 196/18723 | 8.60e-11 | 3.06e-09 | 128 |
| GO:00463642 | Liver | HCC | monosaccharide biosynthetic process | 58/7958 | 82/18723 | 2.08e-07 | 3.75e-06 | 58 |
| GO:00193192 | Liver | HCC | hexose biosynthetic process | 54/7958 | 78/18723 | 1.61e-06 | 2.27e-05 | 54 |
| GO:00060942 | Liver | HCC | gluconeogenesis | 52/7958 | 75/18723 | 2.34e-06 | 3.14e-05 | 52 |
| GO:00160512 | Liver | HCC | carbohydrate biosynthetic process | 113/7958 | 202/18723 | 7.64e-05 | 6.83e-04 | 113 |
| GO:000683918 | Oral cavity | OSCC | mitochondrial transport | 162/7305 | 254/18723 | 8.96e-16 | 6.52e-14 | 162 |
| GO:00067905 | Oral cavity | OSCC | sulfur compound metabolic process | 168/7305 | 339/18723 | 4.50e-05 | 3.84e-04 | 168 |
| GO:00059968 | Oral cavity | OSCC | monosaccharide metabolic process | 129/7305 | 257/18723 | 1.63e-04 | 1.13e-03 | 129 |
| GO:00193188 | Oral cavity | OSCC | hexose metabolic process | 118/7305 | 237/18723 | 4.53e-04 | 2.73e-03 | 118 |
| GO:00060068 | Oral cavity | OSCC | glucose metabolic process | 98/7305 | 196/18723 | 1.10e-03 | 5.63e-03 | 98 |
| GO:00160513 | Oral cavity | OSCC | carbohydrate biosynthetic process | 97/7305 | 202/18723 | 5.50e-03 | 2.13e-02 | 97 |
| GO:000683919 | Oral cavity | LP | mitochondrial transport | 119/4623 | 254/18723 | 1.06e-14 | 1.33e-12 | 119 |
| GO:000599613 | Oral cavity | LP | monosaccharide metabolic process | 86/4623 | 257/18723 | 9.13e-04 | 7.79e-03 | 86 |
| GO:001931813 | Oral cavity | LP | hexose metabolic process | 78/4623 | 237/18723 | 2.55e-03 | 1.80e-02 | 78 |
| GO:000679012 | Oral cavity | LP | sulfur compound metabolic process | 106/4623 | 339/18723 | 3.36e-03 | 2.25e-02 | 106 |
| GO:000600614 | Oral cavity | LP | glucose metabolic process | 64/4623 | 196/18723 | 7.09e-03 | 3.98e-02 | 64 |
| Page: 1 |
| Pathway ID | Tissue | Disease Stage | Description | Gene Ratio | Bg Ratio | pvalue | p.adjust | qvalue | Count |
| Page: 1 |
Top |
Cell-cell communication analysis |
| Identification of potential cell-cell interactions between two cell types and their ligand-receptor pairs for different disease states |
| Ligand | Receptor | LRpair | Pathway | Tissue | Disease Stage |
| Page: 1 |
Top |
Single-cell gene regulatory network inference analysis |
| Find out the significant the regulons (TFs) and the target genes of each regulon across cell types for different disease states |
| TF | Cell Type | Tissue | Disease Stage | Target Gene | RSS | Regulon Activity |
| ∗The dot plots of a searched regulon are shown for all cell subpopulations in each disease state of each tissue based on the regulon specific score inferred using pySCENIC and by calculating the average expression. |
| Page: 1 |
Top |
Somatic mutation of malignant transformation related genes |
| Annotation of somatic variants for genes involved in malignant transformation |
| Hugo Symbol | Variant Class | Variant Classification | dbSNP RS | HGVSc | HGVSp | HGVSp Short | SWISSPROT | BIOTYPE | SIFT | PolyPhen | Tumor Sample Barcode | Tissue | Histology | Sex | Age | Stage | Therapy Types | Drugs | Outcome |
| SLC25A10 | SNV | Missense_Mutation | novel | c.472N>G | p.Arg158Gly | p.R158G | protein_coding | tolerated_low_confidence(0.09) | possibly_damaging(0.503) | TCGA-AO-A128-01 | Breast | breast invasive carcinoma | Female | <65 | I/II | Chemotherapy | doxorubicin | SD | |
| SLC25A10 | deletion | Frame_Shift_Del | novel | c.839delN | p.Gln281LysfsTer134 | p.Q281Kfs*134 | protein_coding | TCGA-D8-A27V-01 | Breast | breast invasive carcinoma | Female | <65 | I/II | Hormone Therapy | tamoxiphen | SD | |||
| SLC25A10 | SNV | Missense_Mutation | c.274G>A | p.Gly92Ser | p.G92S | protein_coding | tolerated_low_confidence(0.1) | benign(0.113) | TCGA-AA-3710-01 | Colorectum | colon adenocarcinoma | Female | >=65 | I/II | Unknown | Unknown | SD | ||
| SLC25A10 | SNV | Missense_Mutation | rs745715469 | c.424G>A | p.Ala142Thr | p.A142T | protein_coding | deleterious_low_confidence(0.04) | benign(0.062) | TCGA-AD-A5EJ-01 | Colorectum | colon adenocarcinoma | Female | >=65 | I/II | Unknown | Unknown | SD | |
| SLC25A10 | SNV | Missense_Mutation | c.488G>A | p.Gly163Asp | p.G163D | protein_coding | deleterious_low_confidence(0) | probably_damaging(0.998) | TCGA-CK-4951-01 | Colorectum | colon adenocarcinoma | Female | >=65 | I/II | Unknown | Unknown | PD | ||
| SLC25A10 | deletion | Frame_Shift_Del | c.674delT | p.Leu225TyrfsTer36 | p.L225Yfs*36 | protein_coding | TCGA-AU-6004-01 | Colorectum | colon adenocarcinoma | Female | >=65 | I/II | Unknown | Unknown | SD | ||||
| SLC25A10 | SNV | Missense_Mutation | novel | c.213N>T | p.Gln71His | p.Q71H | protein_coding | deleterious_low_confidence(0) | probably_damaging(0.991) | TCGA-AP-A1DK-01 | Endometrium | uterine corpus endometrioid carcinoma | Female | <65 | I/II | Unknown | Unknown | SD | |
| SLC25A10 | SNV | Missense_Mutation | novel | c.355N>T | p.Pro119Ser | p.P119S | protein_coding | deleterious_low_confidence(0.01) | possibly_damaging(0.891) | TCGA-AP-A1DK-01 | Endometrium | uterine corpus endometrioid carcinoma | Female | <65 | I/II | Unknown | Unknown | SD | |
| SLC25A10 | SNV | Missense_Mutation | c.353N>T | p.Thr118Met | p.T118M | protein_coding | deleterious_low_confidence(0) | probably_damaging(0.975) | TCGA-AX-A06H-01 | Endometrium | uterine corpus endometrioid carcinoma | Female | <65 | III/IV | Chemotherapy | paclitaxel | SD | ||
| SLC25A10 | SNV | Missense_Mutation | c.668N>A | p.Gly223Asp | p.G223D | protein_coding | deleterious_low_confidence(0) | benign(0.27) | TCGA-AX-A0J1-01 | Endometrium | uterine corpus endometrioid carcinoma | Female | >=65 | I/II | Unknown | Unknown | SD |
| Page: 1 2 3 4 |
Top |
Related drugs of malignant transformation related genes |
| Identification of chemicals and drugs interact with genes involved in malignant transfromation |
| (DGIdb 4.0) |
| Entrez ID | Symbol | Category | Interaction Types | Drug Claim Name | Drug Name | PMIDs |
| Page: 1 |

Copyright 2023-Present -The University of Texas Health Science Center at Houston |