
|
|||||
|
 | |
| |
| |
| |
| |
| |
|
Gene: SLC22A3 |
Gene summary for SLC22A3 |
| Gene information | Species | Human | Gene symbol | SLC22A3 | Gene ID | 6581 |
| Gene name | solute carrier family 22 member 3 | |
| Gene Alias | EMT | |
| Cytomap | 6q25.3 | |
| Gene Type | protein-coding | GO ID | GO:0001504 | UniProtAcc | O75751 |
Top |
Malignant transformation analysis |
| Identification of the aberrant gene expression in precancerous and cancerous lesions by comparing the gene expression of stem-like cells in diseased tissues with normal stem cells |
| Entrez ID | Symbol | Replicates | Species | Organ | Tissue | Adj P-value | Log2FC | Malignancy |
| 6581 | SLC22A3 | RNA-P10T2-P10T2-2 | Human | Lung | AAH | 1.89e-05 | 8.17e-01 | -0.1406 |
| 6581 | SLC22A3 | RNA-P10T2-P10T2-4 | Human | Lung | AAH | 4.53e-02 | 6.45e-01 | -0.138 |
| 6581 | SLC22A3 | RNA-P25T1-P25T1-1 | Human | Lung | AIS | 6.20e-14 | 6.65e-01 | -0.2116 |
| 6581 | SLC22A3 | RNA-P25T1-P25T1-2 | Human | Lung | AIS | 2.32e-03 | 4.71e-01 | -0.1941 |
| 6581 | SLC22A3 | RNA-P25T1-P25T1-3 | Human | Lung | AIS | 2.09e-07 | 7.10e-01 | -0.2107 |
| 6581 | SLC22A3 | RNA-P25T1-P25T1-4 | Human | Lung | AIS | 8.45e-11 | 6.43e-01 | -0.2119 |
| 6581 | SLC22A3 | RNA-P3T-P3T-1 | Human | Lung | IAC | 2.11e-02 | 3.21e-01 | 0.1829 |
| 6581 | SLC22A3 | RNA-P3T-P3T-2 | Human | Lung | IAC | 2.78e-02 | 3.49e-01 | 0.1835 |
| 6581 | SLC22A3 | RNA-P6T2-P6T2-1 | Human | Lung | IAC | 1.24e-10 | 3.41e-01 | -0.0166 |
| 6581 | SLC22A3 | RNA-P6T2-P6T2-2 | Human | Lung | IAC | 1.01e-20 | 4.67e-01 | -0.0132 |
| 6581 | SLC22A3 | RNA-P6T2-P6T2-3 | Human | Lung | IAC | 9.35e-23 | 4.18e-01 | -0.013 |
| 6581 | SLC22A3 | RNA-P6T2-P6T2-4 | Human | Lung | IAC | 3.47e-08 | 3.19e-01 | -0.0121 |
| 6581 | SLC22A3 | RNA-P7T1-P7T1-1 | Human | Lung | AIS | 9.16e-05 | 3.91e-01 | -0.0961 |
| 6581 | SLC22A3 | RNA-P7T1-P7T1-2 | Human | Lung | AIS | 2.09e-07 | 4.73e-01 | -0.0876 |
| 6581 | SLC22A3 | RNA-P7T1-P7T1-3 | Human | Lung | AIS | 2.03e-02 | 2.75e-01 | -0.0822 |
| 6581 | SLC22A3 | RNA-P7T1-P7T1-4 | Human | Lung | AIS | 4.65e-06 | 4.50e-01 | -0.0809 |
| Page: 1 |
| Tissue | Expression Dynamics | Abbreviation |
| Lung | 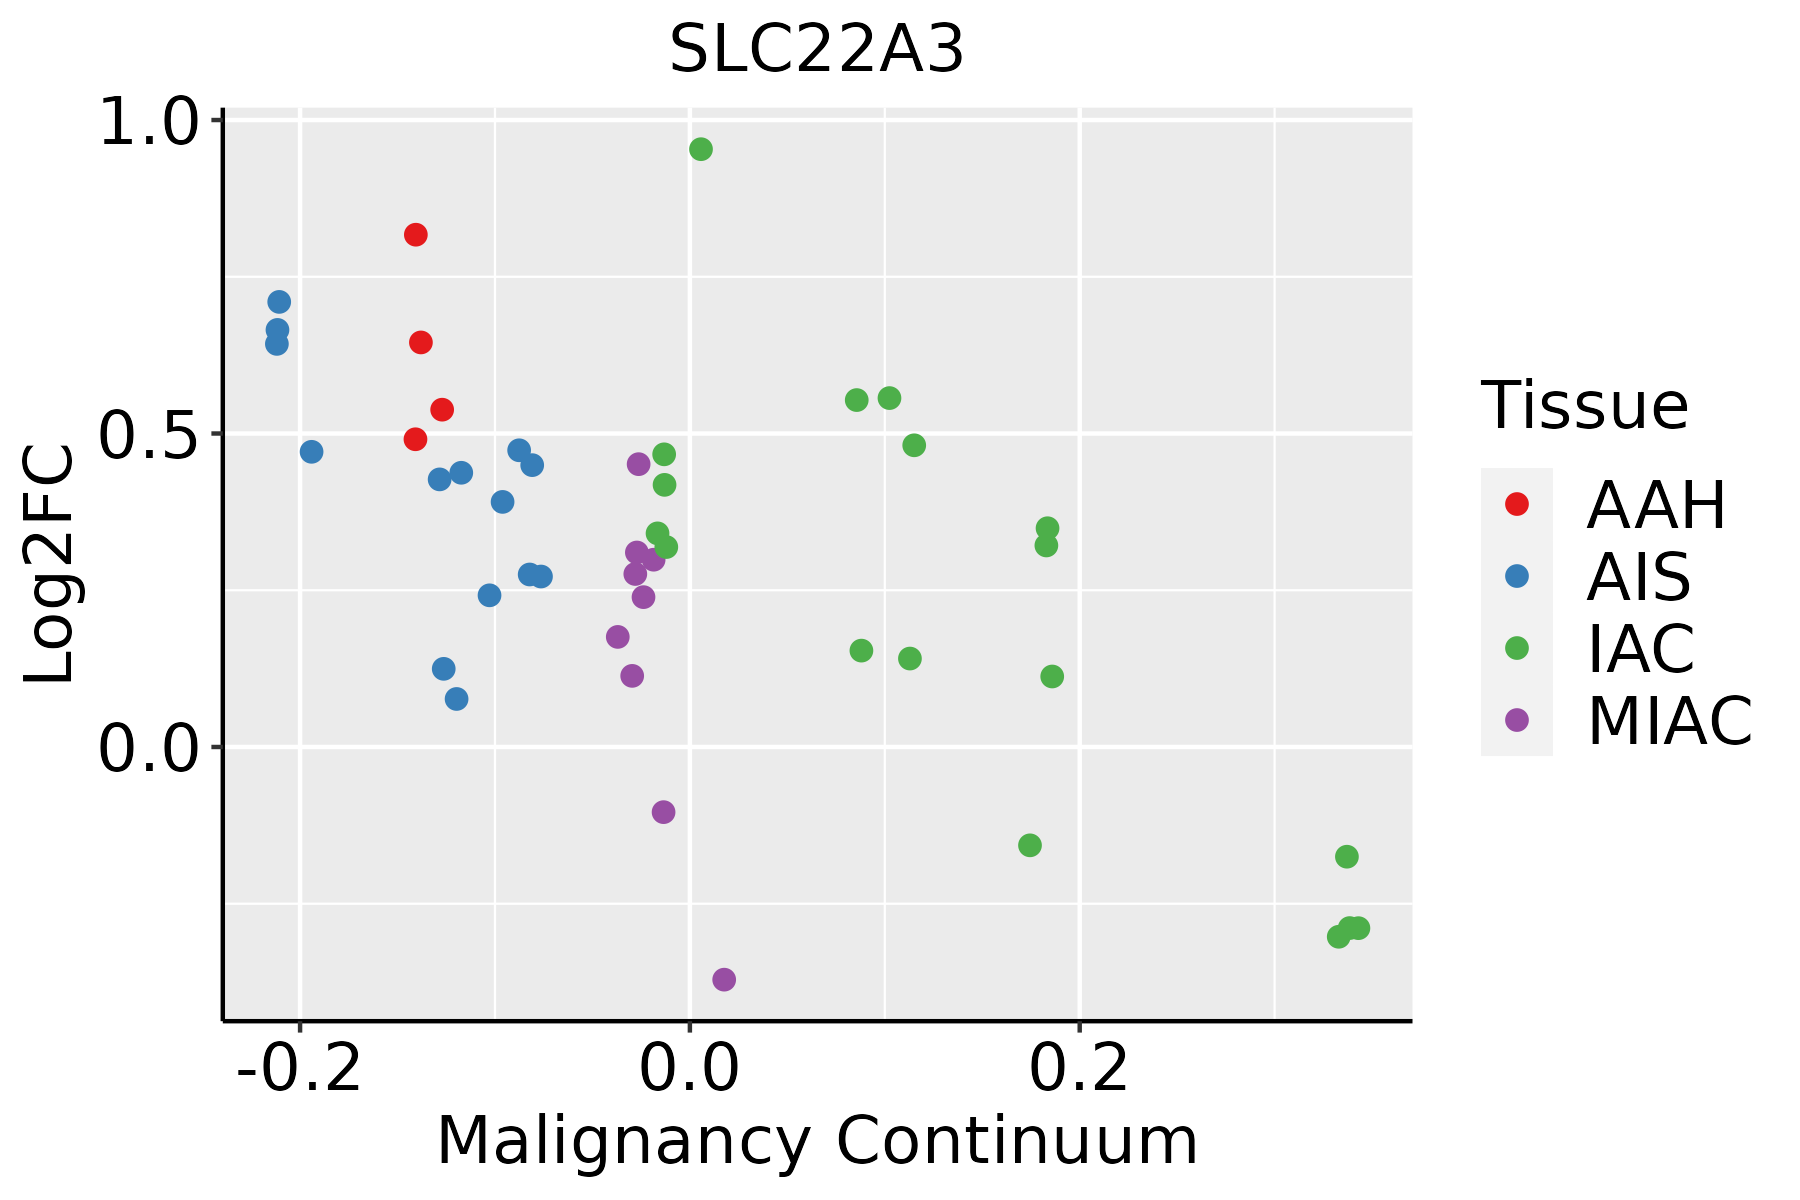 | AAH: Atypical adenomatous hyperplasia |
| AIS: Adenocarcinoma in situ | ||
| IAC: Invasive lung adenocarcinoma | ||
| MIA: Minimally invasive adenocarcinoma |
| ∗log2FC in expression of this searched gene in stem-like cells from each diseased tissue sample relative to stem-like cells in normal samples in each tissue plotted against the malignancy continuum. Samples are colored based on if they are from different disease stage. |
Top |
Malignant transformation related pathway analysis |
| Find out the enriched GO biological processes and KEGG pathways involved in transition from healthy to precancer to cancer |
| Tissue | Disease Stage | Enriched GO biological Processes |
| Colorectum | AD |  |
| Colorectum | SER |  |
| Colorectum | MSS |  |
| Colorectum | MSI-H |  |
| Colorectum | FAP |  |
| ∗Top 15 enriched GO BP terms are showed in the bar plot of each disease state in each tissue. Each row represents a significant GO biological process which is colored according to the -log10(p.adjust). |
| Page: 1 2 3 4 5 6 7 8 9 |
| GO ID | Tissue | Disease Stage | Description | Gene Ratio | Bg Ratio | pvalue | p.adjust | Count |
| GO:00316678 | Lung | IAC | response to nutrient levels | 76/2061 | 474/18723 | 4.87e-04 | 7.08e-03 | 76 |
| GO:003166713 | Lung | AIS | response to nutrient levels | 64/1849 | 474/18723 | 6.13e-03 | 4.98e-02 | 64 |
| Page: 1 |
| Pathway ID | Tissue | Disease Stage | Description | Gene Ratio | Bg Ratio | pvalue | p.adjust | qvalue | Count |
| hsa052317 | Lung | IAC | Choline metabolism in cancer | 23/1053 | 98/8465 | 1.72e-03 | 9.66e-03 | 6.41e-03 | 23 |
| hsa0523112 | Lung | IAC | Choline metabolism in cancer | 23/1053 | 98/8465 | 1.72e-03 | 9.66e-03 | 6.41e-03 | 23 |
| hsa0523121 | Lung | AIS | Choline metabolism in cancer | 23/961 | 98/8465 | 4.87e-04 | 4.39e-03 | 2.81e-03 | 23 |
| hsa0523131 | Lung | AIS | Choline metabolism in cancer | 23/961 | 98/8465 | 4.87e-04 | 4.39e-03 | 2.81e-03 | 23 |
| Page: 1 |
Top |
Cell-cell communication analysis |
| Identification of potential cell-cell interactions between two cell types and their ligand-receptor pairs for different disease states |
| Ligand | Receptor | LRpair | Pathway | Tissue | Disease Stage |
| Page: 1 |
Top |
Single-cell gene regulatory network inference analysis |
| Find out the significant the regulons (TFs) and the target genes of each regulon across cell types for different disease states |
| TF | Cell Type | Tissue | Disease Stage | Target Gene | RSS | Regulon Activity |
| ∗The dot plots of a searched regulon are shown for all cell subpopulations in each disease state of each tissue based on the regulon specific score inferred using pySCENIC and by calculating the average expression. |
| Page: 1 |
Top |
Somatic mutation of malignant transformation related genes |
| Annotation of somatic variants for genes involved in malignant transformation |
| Hugo Symbol | Variant Class | Variant Classification | dbSNP RS | HGVSc | HGVSp | HGVSp Short | SWISSPROT | BIOTYPE | SIFT | PolyPhen | Tumor Sample Barcode | Tissue | Histology | Sex | Age | Stage | Therapy Types | Drugs | Outcome |
| SLC22A3 | SNV | Missense_Mutation | rs183669984 | c.928N>T | p.Arg310Cys | p.R310C | O75751 | protein_coding | deleterious(0.01) | possibly_damaging(0.505) | TCGA-A2-A0CL-01 | Breast | breast invasive carcinoma | Female | <65 | III/IV | Chemotherapy | cytoxan | SD |
| SLC22A3 | SNV | Missense_Mutation | novel | c.1646N>A | p.Thr549Asn | p.T549N | O75751 | protein_coding | tolerated(0.51) | benign(0.01) | TCGA-AR-A1AP-01 | Breast | breast invasive carcinoma | Female | >=65 | I/II | Hormone Therapy | anastrozole | SD |
| SLC22A3 | SNV | Missense_Mutation | novel | c.1646N>A | p.Thr549Asn | p.T549N | O75751 | protein_coding | tolerated(0.51) | benign(0.01) | TCGA-BH-A0BR-01 | Breast | breast invasive carcinoma | Female | <65 | I/II | Unknown | Unknown | SD |
| SLC22A3 | SNV | Missense_Mutation | novel | c.1285G>A | p.Glu429Lys | p.E429K | O75751 | protein_coding | tolerated(0.17) | benign(0.014) | TCGA-XX-A89A-01 | Breast | breast invasive carcinoma | Female | >=65 | I/II | Unknown | Unknown | SD |
| SLC22A3 | insertion | In_Frame_Ins | novel | c.1501_1502insGCCACTTGT | p.Ile501delinsSerHisLeuPhe | p.I501delinsSHLF | O75751 | protein_coding | TCGA-AN-A049-01 | Breast | breast invasive carcinoma | Female | <65 | I/II | Unknown | Unknown | SD | ||
| SLC22A3 | SNV | Missense_Mutation | c.1658N>A | p.Arg553His | p.R553H | O75751 | protein_coding | deleterious(0.03) | benign(0.039) | TCGA-AA-3510-01 | Colorectum | colon adenocarcinoma | Male | >=65 | I/II | Unknown | Unknown | SD | |
| SLC22A3 | SNV | Missense_Mutation | c.1658N>A | p.Arg553His | p.R553H | O75751 | protein_coding | deleterious(0.03) | benign(0.039) | TCGA-AA-3877-01 | Colorectum | colon adenocarcinoma | Female | >=65 | I/II | Unknown | Unknown | SD | |
| SLC22A3 | SNV | Missense_Mutation | c.1294N>T | p.Ala432Ser | p.A432S | O75751 | protein_coding | tolerated(0.44) | benign(0) | TCGA-AA-A010-01 | Colorectum | colon adenocarcinoma | Female | <65 | I/II | Chemotherapy | folinic | CR | |
| SLC22A3 | SNV | Missense_Mutation | novel | c.1381T>A | p.Tyr461Asn | p.Y461N | O75751 | protein_coding | deleterious(0) | probably_damaging(0.998) | TCGA-AA-A029-01 | Colorectum | colon adenocarcinoma | Male | >=65 | I/II | Unknown | Unknown | SD |
| SLC22A3 | SNV | Missense_Mutation | rs753918761 | c.929N>A | p.Arg310His | p.R310H | O75751 | protein_coding | tolerated(1) | benign(0) | TCGA-AD-6889-01 | Colorectum | colon adenocarcinoma | Male | >=65 | I/II | Chemotherapy | xeloda | PD |
| Page: 1 2 3 4 5 6 7 |
Top |
Related drugs of malignant transformation related genes |
| Identification of chemicals and drugs interact with genes involved in malignant transfromation |
| (DGIdb 4.0) |
| Entrez ID | Symbol | Category | Interaction Types | Drug Claim Name | Drug Name | PMIDs |
| 6581 | SLC22A3 | DRUGGABLE GENOME, EXTERNAL SIDE OF PLASMA MEMBRANE, TRANSPORTER | catecholamines | 20859243 | ||
| 6581 | SLC22A3 | DRUGGABLE GENOME, EXTERNAL SIDE OF PLASMA MEMBRANE, TRANSPORTER | lamivudine | LAMIVUDINE | ||
| 6581 | SLC22A3 | DRUGGABLE GENOME, EXTERNAL SIDE OF PLASMA MEMBRANE, TRANSPORTER | ANTIDEPRESSANT DRUGS | 15121658 | ||
| 6581 | SLC22A3 | DRUGGABLE GENOME, EXTERNAL SIDE OF PLASMA MEMBRANE, TRANSPORTER | metformin | METFORMIN | 25920679,20859243,22722338 | |
| 6581 | SLC22A3 | DRUGGABLE GENOME, EXTERNAL SIDE OF PLASMA MEMBRANE, TRANSPORTER | SARCNU | SARCNU | 11783015,10632359 | |
| 6581 | SLC22A3 | DRUGGABLE GENOME, EXTERNAL SIDE OF PLASMA MEMBRANE, TRANSPORTER | inhibitor | 252827483 | DISPROCYNIUM24 |
| Page: 1 |

Copyright 2023-Present -The University of Texas Health Science Center at Houston |