
|
|||||
|
 | |
| |
| |
| |
| |
| |
|
Gene: SLC22A25 |
Gene summary for SLC22A25 |
| Gene information | Species | Human | Gene symbol | SLC22A25 | Gene ID | 387601 |
| Gene name | solute carrier family 22 member 25 | |
| Gene Alias | HIMTP | |
| Cytomap | 11q12.3 | |
| Gene Type | protein-coding | GO ID | GO:0006810 | UniProtAcc | Q6T423 |
Top |
Malignant transformation analysis |
| Identification of the aberrant gene expression in precancerous and cancerous lesions by comparing the gene expression of stem-like cells in diseased tissues with normal stem cells |
| Entrez ID | Symbol | Replicates | Species | Organ | Tissue | Adj P-value | Log2FC | Malignancy |
| 387601 | SLC22A25 | NAFLD1 | Human | Liver | NAFLD | 1.77e-09 | 9.53e-01 | -0.04 |
| 387601 | SLC22A25 | S41 | Human | Liver | Cirrhotic | 1.49e-03 | 6.35e-01 | -0.0343 |
| 387601 | SLC22A25 | S43 | Human | Liver | Cirrhotic | 2.37e-07 | -2.53e-01 | -0.0187 |
| 387601 | SLC22A25 | HCC1_Meng | Human | Liver | HCC | 4.21e-08 | -2.43e-01 | 0.0246 |
| 387601 | SLC22A25 | HCC2_Meng | Human | Liver | HCC | 2.32e-08 | -2.68e-01 | 0.0107 |
| 387601 | SLC22A25 | cirrhotic1 | Human | Liver | Cirrhotic | 1.07e-08 | -2.67e-01 | 0.0202 |
| 387601 | SLC22A25 | cirrhotic2 | Human | Liver | Cirrhotic | 1.92e-06 | -2.66e-01 | 0.0201 |
| 387601 | SLC22A25 | cirrhotic3 | Human | Liver | Cirrhotic | 3.06e-04 | -2.68e-01 | 0.0215 |
| 387601 | SLC22A25 | HCC1 | Human | Liver | HCC | 1.06e-31 | 6.59e-01 | 0.5336 |
| 387601 | SLC22A25 | HCC5 | Human | Liver | HCC | 4.82e-03 | 5.79e-01 | 0.4932 |
| 387601 | SLC22A25 | Pt13.a | Human | Liver | HCC | 3.25e-06 | -2.63e-01 | 0.021 |
| 387601 | SLC22A25 | Pt13.b | Human | Liver | HCC | 2.63e-03 | -2.68e-01 | 0.0251 |
| 387601 | SLC22A25 | Pt14.d | Human | Liver | HCC | 2.96e-06 | -2.63e-01 | 0.0143 |
| 387601 | SLC22A25 | S014 | Human | Liver | HCC | 3.63e-02 | -2.68e-01 | 0.2254 |
| 387601 | SLC22A25 | S016 | Human | Liver | HCC | 2.17e-03 | -2.68e-01 | 0.2243 |
| Page: 1 |
| Tissue | Expression Dynamics | Abbreviation |
| Liver | 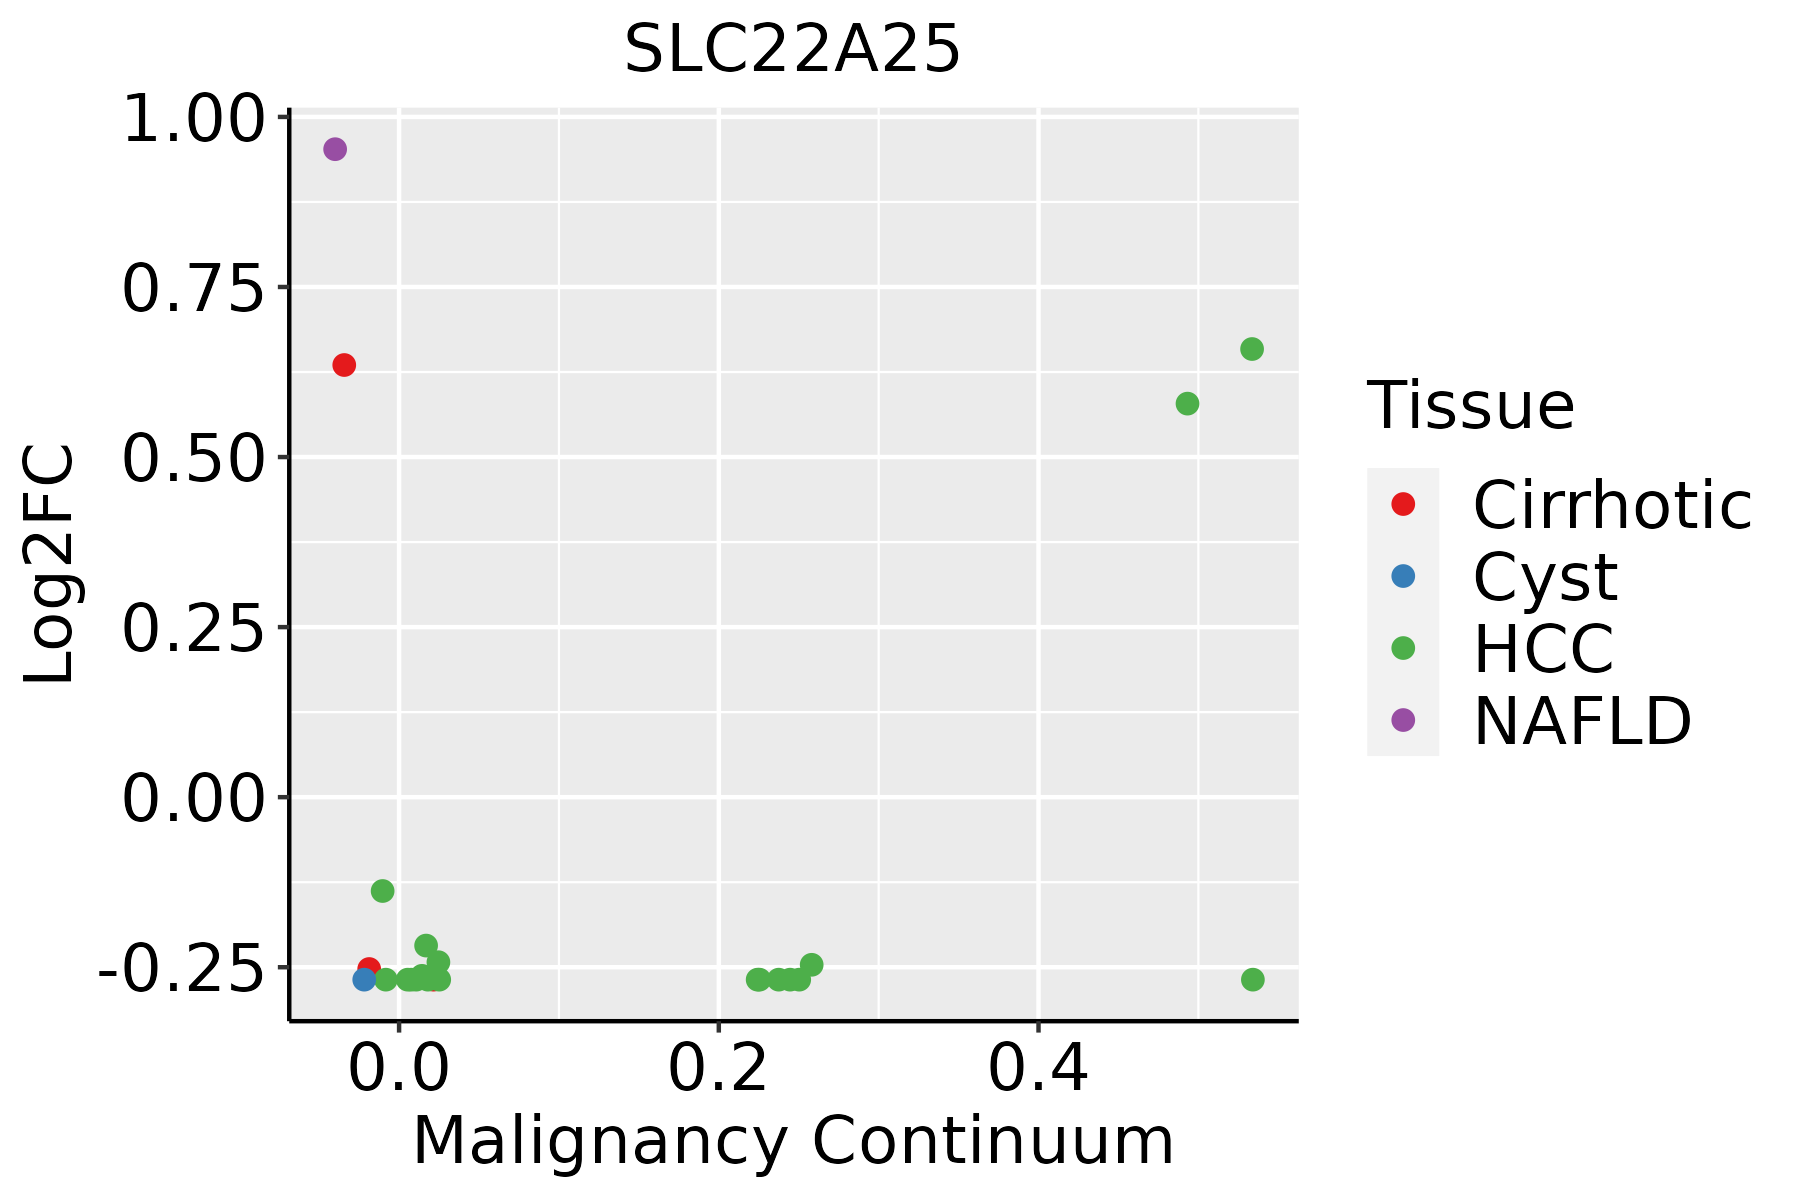 | HCC: Hepatocellular carcinoma |
| NAFLD: Non-alcoholic fatty liver disease |
| ∗log2FC in expression of this searched gene in stem-like cells from each diseased tissue sample relative to stem-like cells in normal samples in each tissue plotted against the malignancy continuum. Samples are colored based on if they are from different disease stage. |
Top |
Malignant transformation related pathway analysis |
| Find out the enriched GO biological processes and KEGG pathways involved in transition from healthy to precancer to cancer |
| Tissue | Disease Stage | Enriched GO biological Processes |
| Colorectum | AD |  |
| Colorectum | SER |  |
| Colorectum | MSS |  |
| Colorectum | MSI-H |  |
| Colorectum | FAP |  |
| ∗Top 15 enriched GO BP terms are showed in the bar plot of each disease state in each tissue. Each row represents a significant GO biological process which is colored according to the -log10(p.adjust). |
| Page: 1 2 3 4 5 6 7 8 9 |
| GO ID | Tissue | Disease Stage | Description | Gene Ratio | Bg Ratio | pvalue | p.adjust | Count |
| Page: 1 |
| Pathway ID | Tissue | Disease Stage | Description | Gene Ratio | Bg Ratio | pvalue | p.adjust | qvalue | Count |
| Page: 1 |
Top |
Cell-cell communication analysis |
| Identification of potential cell-cell interactions between two cell types and their ligand-receptor pairs for different disease states |
| Ligand | Receptor | LRpair | Pathway | Tissue | Disease Stage |
| Page: 1 |
Top |
Single-cell gene regulatory network inference analysis |
| Find out the significant the regulons (TFs) and the target genes of each regulon across cell types for different disease states |
| TF | Cell Type | Tissue | Disease Stage | Target Gene | RSS | Regulon Activity |
| ∗The dot plots of a searched regulon are shown for all cell subpopulations in each disease state of each tissue based on the regulon specific score inferred using pySCENIC and by calculating the average expression. |
| Page: 1 |
Top |
Somatic mutation of malignant transformation related genes |
| Annotation of somatic variants for genes involved in malignant transformation |
| Hugo Symbol | Variant Class | Variant Classification | dbSNP RS | HGVSc | HGVSp | HGVSp Short | SWISSPROT | BIOTYPE | SIFT | PolyPhen | Tumor Sample Barcode | Tissue | Histology | Sex | Age | Stage | Therapy Types | Drugs | Outcome |
| SLC22A25 | SNV | Missense_Mutation | rs751974630 | c.1265N>T | p.Ala422Val | p.A422V | Q6T423 | protein_coding | tolerated(0.42) | benign(0.074) | TCGA-AN-A0AK-01 | Breast | breast invasive carcinoma | Female | >=65 | I/II | Unknown | Unknown | SD |
| SLC22A25 | SNV | Missense_Mutation | c.914N>A | p.Arg305Lys | p.R305K | Q6T423 | protein_coding | tolerated(0.3) | benign(0.058) | TCGA-B6-A0IJ-01 | Breast | breast invasive carcinoma | Female | <65 | I/II | Unknown | Unknown | SD | |
| SLC22A25 | SNV | Missense_Mutation | c.1439G>A | p.Gly480Glu | p.G480E | Q6T423 | protein_coding | deleterious(0) | possibly_damaging(0.491) | TCGA-B6-A0X4-01 | Breast | breast invasive carcinoma | Female | <65 | I/II | Unknown | Unknown | PD | |
| SLC22A25 | SNV | Missense_Mutation | c.1150N>T | p.Leu384Phe | p.L384F | Q6T423 | protein_coding | deleterious(0.03) | benign(0.33) | TCGA-BH-A0HF-01 | Breast | breast invasive carcinoma | Female | >=65 | I/II | Hormone Therapy | arimidex | SD | |
| SLC22A25 | SNV | Missense_Mutation | c.169G>T | p.Asp57Tyr | p.D57Y | Q6T423 | protein_coding | deleterious(0) | possibly_damaging(0.888) | TCGA-D8-A140-01 | Breast | breast invasive carcinoma | Female | <65 | I/II | Chemotherapy | doxorubicin+cyclophosphamid | SD | |
| SLC22A25 | insertion | Frame_Shift_Ins | novel | c.230_231insAGGTGGTAACAAG | p.Pro78GlyfsTer37 | p.P78Gfs*37 | Q6T423 | protein_coding | TCGA-A2-A0CP-01 | Breast | breast invasive carcinoma | Female | <65 | I/II | Chemotherapy | cytoxan | SD | ||
| SLC22A25 | insertion | In_Frame_Ins | novel | c.64_65insATACCAGCTCAGCCACAGTAGGAGAGGGCACTGGGC | p.Val22delinsAspThrSerSerAlaThrValGlyGluGlyThrGlyLeu | p.V22delinsDTSSATVGEGTGL | Q6T423 | protein_coding | TCGA-A8-A07J-01 | Breast | breast invasive carcinoma | Female | <65 | I/II | Chemotherapy | 5-fluorouracil | CR | ||
| SLC22A25 | insertion | Frame_Shift_Ins | novel | c.1407_1408insACATG | p.Gly470ThrfsTer19 | p.G470Tfs*19 | Q6T423 | protein_coding | TCGA-AR-A0U0-01 | Breast | breast invasive carcinoma | Female | >=65 | I/II | Unknown | Unknown | SD | ||
| SLC22A25 | SNV | Missense_Mutation | c.476N>T | p.Gly159Val | p.G159V | Q6T423 | protein_coding | deleterious(0) | probably_damaging(1) | TCGA-2W-A8YY-01 | Cervix | cervical & endocervical cancer | Female | <65 | I/II | Chemotherapy | cisplatin | CR | |
| SLC22A25 | SNV | Missense_Mutation | c.1190N>T | p.Pro397Leu | p.P397L | Q6T423 | protein_coding | tolerated(1) | benign(0.001) | TCGA-LP-A7HU-01 | Cervix | cervical & endocervical cancer | Female | <65 | I/II | Unknown | Unknown | SD |
| Page: 1 2 3 4 5 6 7 8 |
Top |
Related drugs of malignant transformation related genes |
| Identification of chemicals and drugs interact with genes involved in malignant transfromation |
| (DGIdb 4.0) |
| Entrez ID | Symbol | Category | Interaction Types | Drug Claim Name | Drug Name | PMIDs |
| Page: 1 |

Copyright 2023-Present -The University of Texas Health Science Center at Houston |