
|
|||||
|
 | |
| |
| |
| |
| |
| |
|
Gene: SLC22A23 |
Gene summary for SLC22A23 |
| Gene information | Species | Human | Gene symbol | SLC22A23 | Gene ID | 63027 |
| Gene name | solute carrier family 22 member 23 | |
| Gene Alias | C6orf85 | |
| Cytomap | 6p25.2 | |
| Gene Type | protein-coding | GO ID | GO:0006810 | UniProtAcc | A1A5C7 |
Top |
Malignant transformation analysis |
| Identification of the aberrant gene expression in precancerous and cancerous lesions by comparing the gene expression of stem-like cells in diseased tissues with normal stem cells |
| Entrez ID | Symbol | Replicates | Species | Organ | Tissue | Adj P-value | Log2FC | Malignancy |
| 63027 | SLC22A23 | CCI_1 | Human | Cervix | CC | 1.48e-12 | 1.04e+00 | 0.528 |
| 63027 | SLC22A23 | CCI_2 | Human | Cervix | CC | 2.16e-13 | 1.43e+00 | 0.5249 |
| 63027 | SLC22A23 | CCI_3 | Human | Cervix | CC | 1.90e-09 | 8.85e-01 | 0.516 |
| 63027 | SLC22A23 | HTA11_3410_2000001011 | Human | Colorectum | AD | 1.42e-33 | -8.54e-01 | 0.0155 |
| 63027 | SLC22A23 | HTA11_347_2000001011 | Human | Colorectum | AD | 5.19e-08 | 6.07e-01 | -0.1954 |
| 63027 | SLC22A23 | HTA11_411_2000001011 | Human | Colorectum | SER | 2.52e-05 | 7.15e-01 | -0.2602 |
| 63027 | SLC22A23 | HTA11_866_3004761011 | Human | Colorectum | AD | 2.50e-13 | -5.80e-01 | 0.096 |
| 63027 | SLC22A23 | HTA11_9408_2000001011 | Human | Colorectum | AD | 2.14e-03 | -9.13e-01 | 0.0451 |
| 63027 | SLC22A23 | HTA11_8622_2000001021 | Human | Colorectum | SER | 2.76e-09 | -7.58e-01 | 0.0528 |
| 63027 | SLC22A23 | HTA11_6801_2000001011 | Human | Colorectum | SER | 7.67e-03 | -4.83e-01 | 0.0171 |
| 63027 | SLC22A23 | HTA11_10711_2000001011 | Human | Colorectum | AD | 1.68e-05 | -5.08e-01 | 0.0338 |
| 63027 | SLC22A23 | HTA11_7696_3000711011 | Human | Colorectum | AD | 2.86e-17 | -6.52e-01 | 0.0674 |
| 63027 | SLC22A23 | HTA11_6818_2000001011 | Human | Colorectum | AD | 6.13e-08 | -7.22e-01 | 0.0112 |
| 63027 | SLC22A23 | HTA11_99999970781_79442 | Human | Colorectum | MSS | 3.41e-38 | -8.16e-01 | 0.294 |
| 63027 | SLC22A23 | HTA11_99999971662_82457 | Human | Colorectum | MSS | 2.57e-35 | -7.72e-01 | 0.3859 |
| 63027 | SLC22A23 | HTA11_99999973899_84307 | Human | Colorectum | MSS | 2.35e-14 | -9.12e-01 | 0.2585 |
| 63027 | SLC22A23 | HTA11_99999974143_84620 | Human | Colorectum | MSS | 7.27e-61 | -1.08e+00 | 0.3005 |
| 63027 | SLC22A23 | F007 | Human | Colorectum | FAP | 3.27e-06 | -4.32e-01 | 0.1176 |
| 63027 | SLC22A23 | A002-C-010 | Human | Colorectum | FAP | 2.10e-06 | -3.30e-01 | 0.242 |
| 63027 | SLC22A23 | A001-C-207 | Human | Colorectum | FAP | 8.41e-04 | -2.99e-01 | 0.1278 |
| Page: 1 2 3 4 5 6 7 |
| Tissue | Expression Dynamics | Abbreviation |
| Cervix | 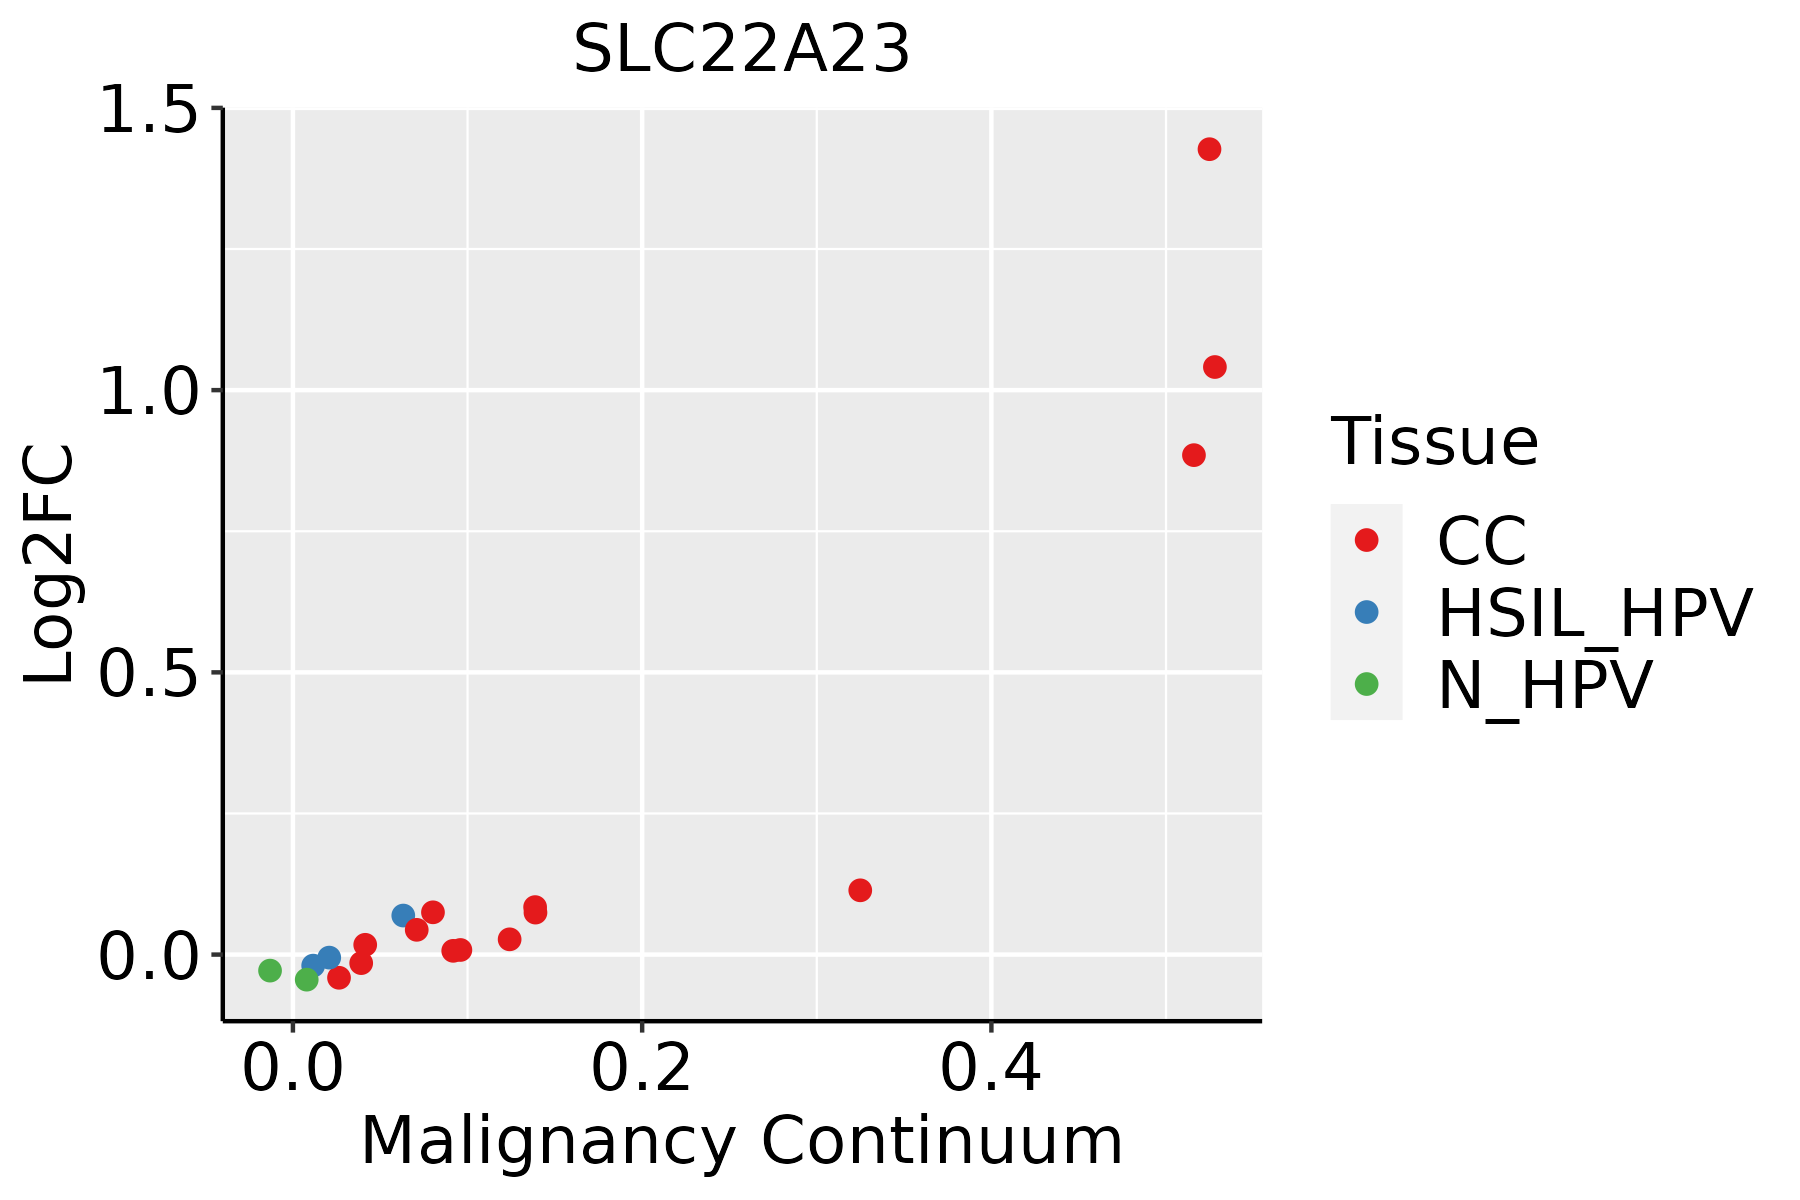 | CC: Cervix cancer |
| HSIL_HPV: HPV-infected high-grade squamous intraepithelial lesions | ||
| N_HPV: HPV-infected normal cervix | ||
| Colorectum (GSE201348) |  | FAP: Familial adenomatous polyposis |
| CRC: Colorectal cancer | ||
| Colorectum (HTA11) | 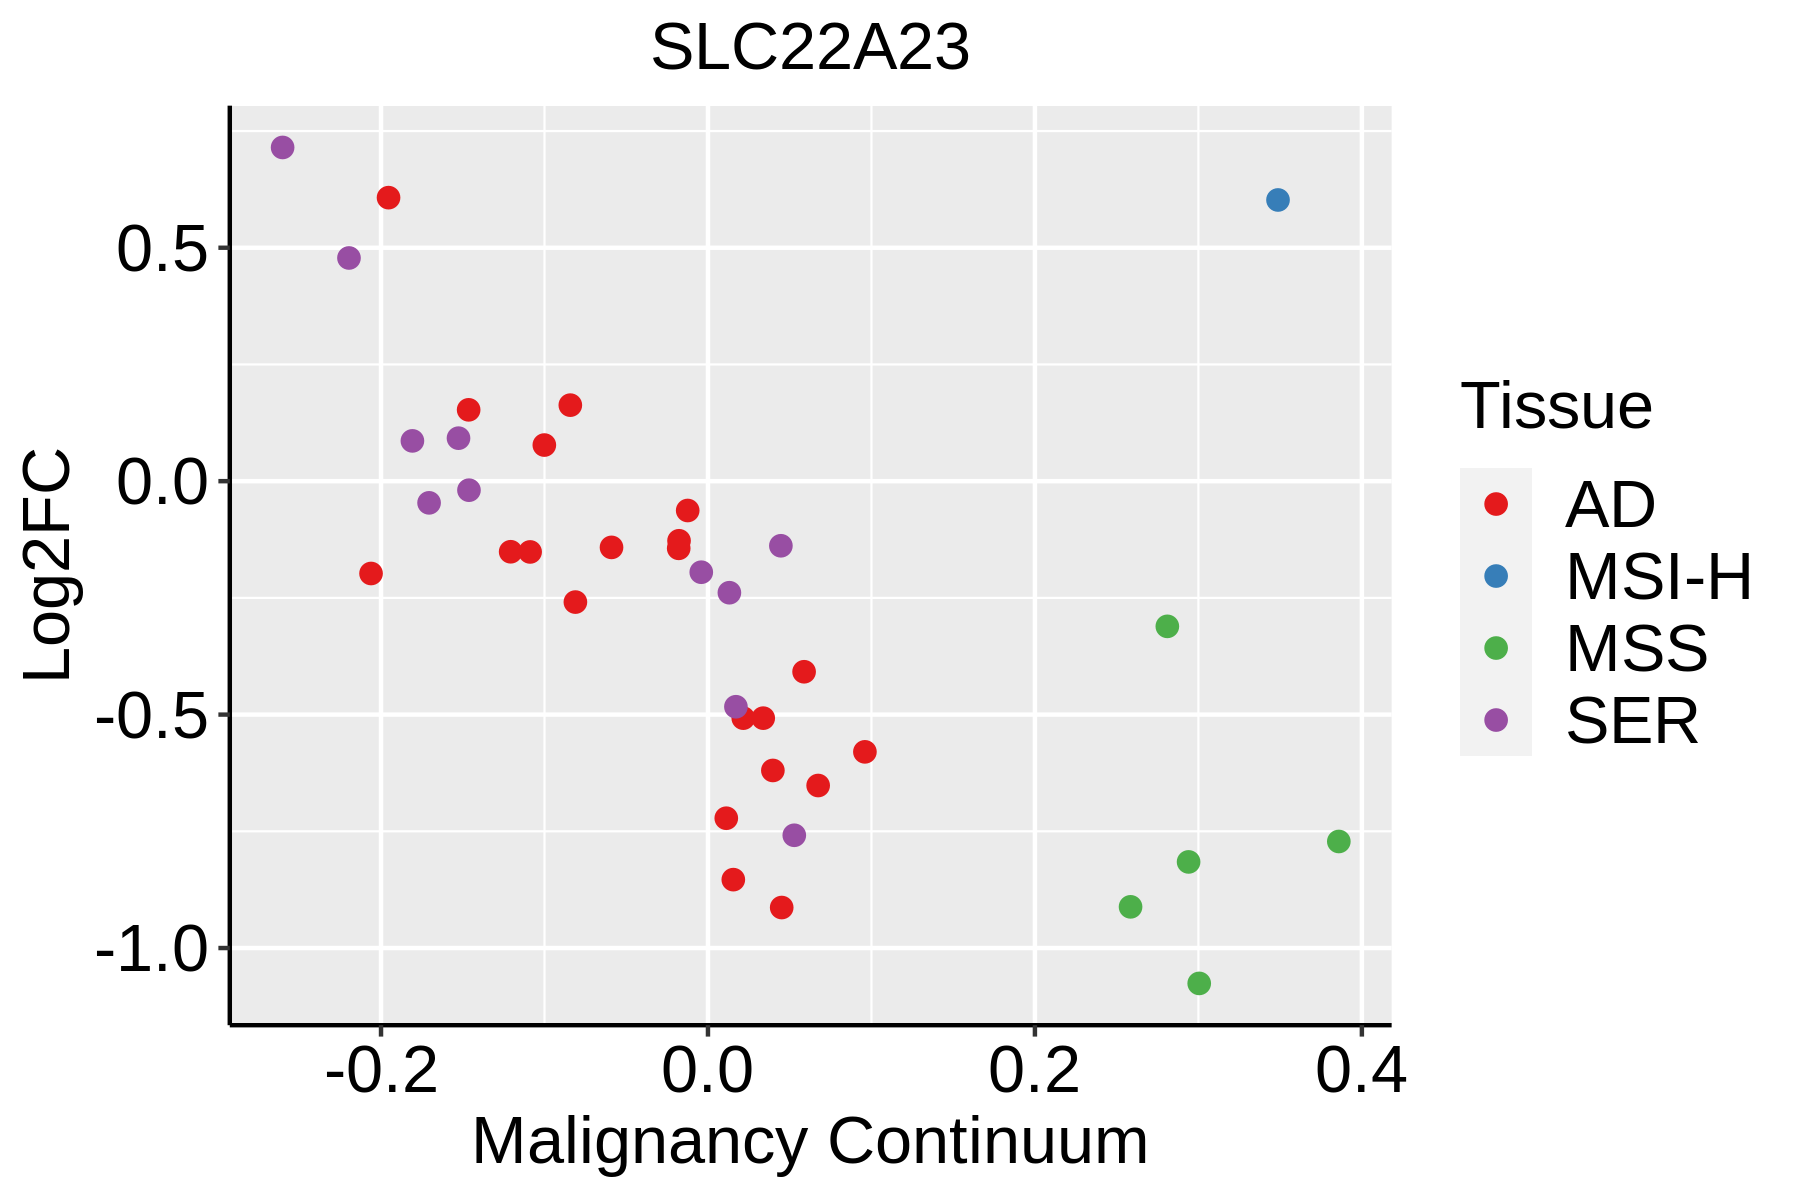 | AD: Adenomas |
| SER: Sessile serrated lesions | ||
| MSI-H: Microsatellite-high colorectal cancer | ||
| MSS: Microsatellite stable colorectal cancer | ||
| Esophagus | 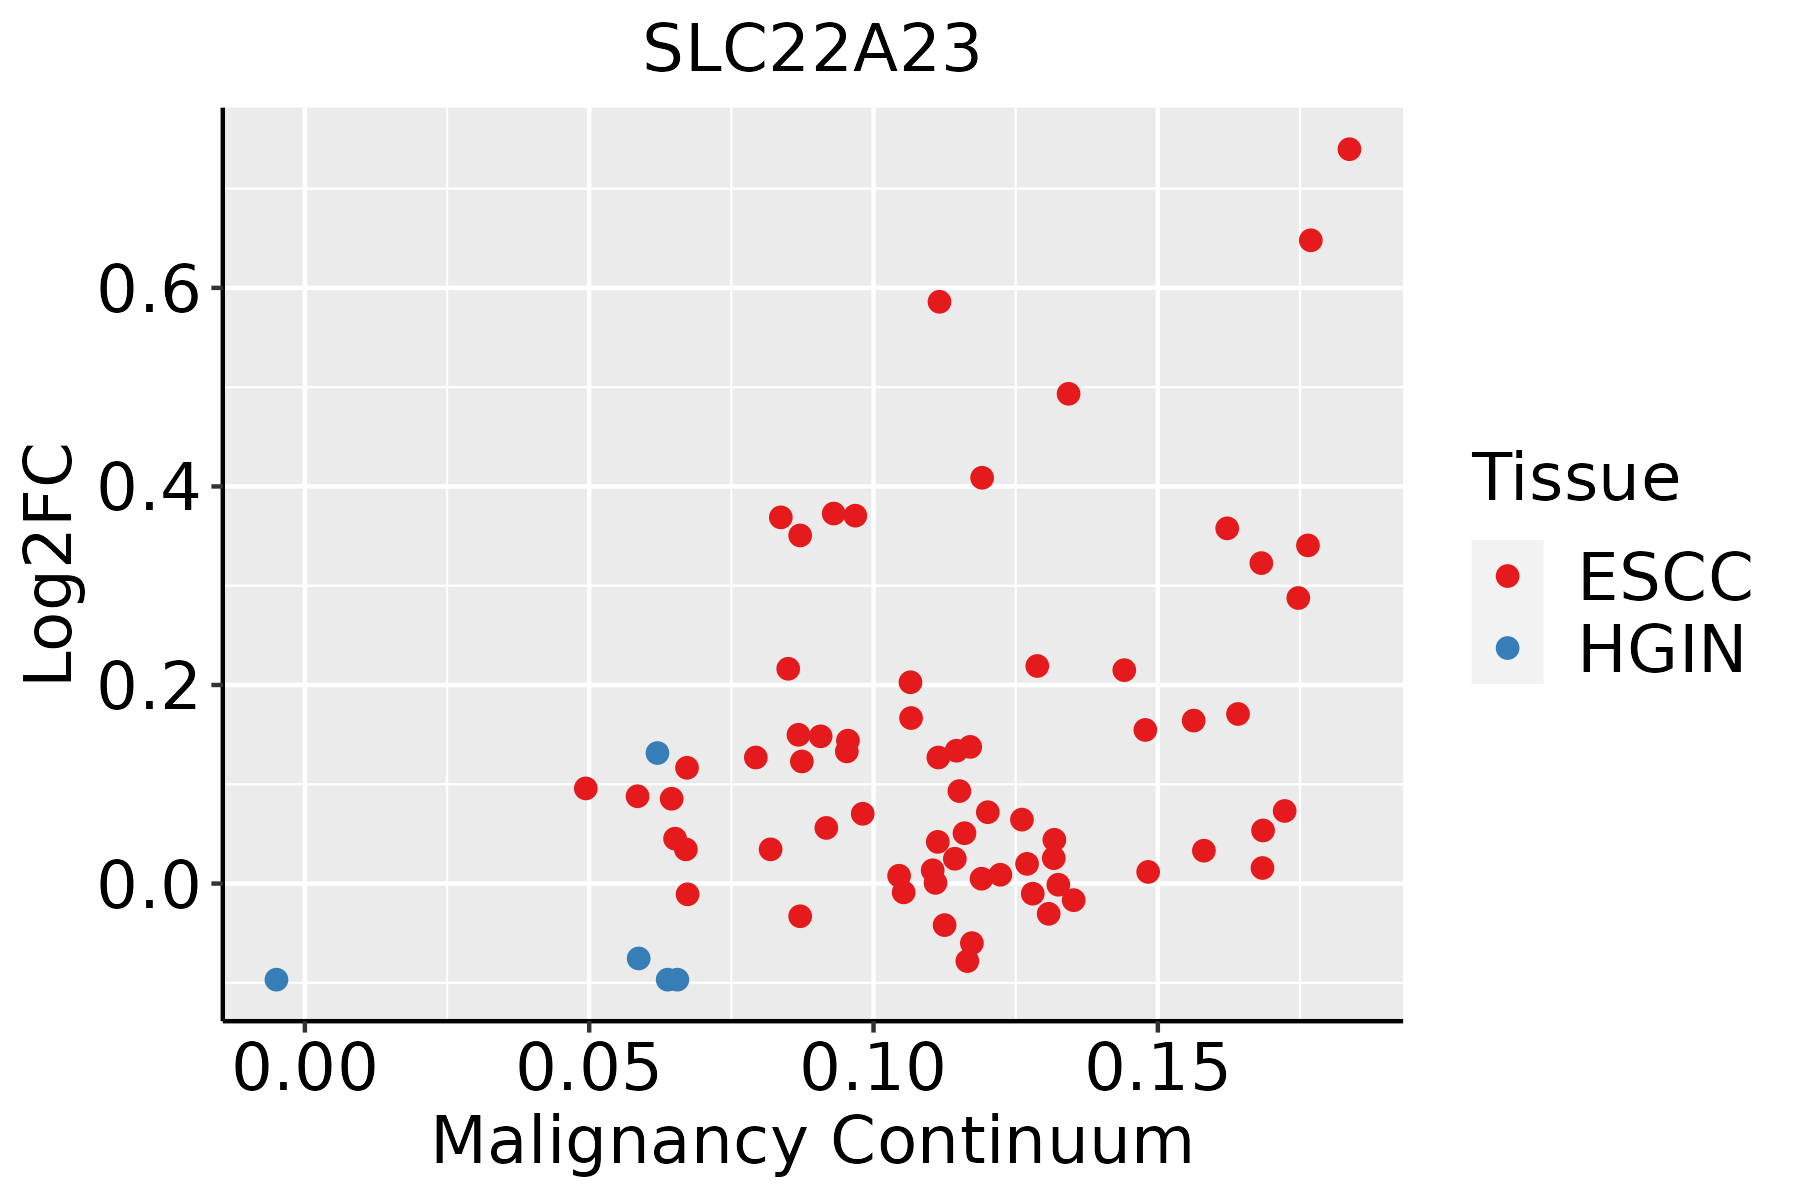 | ESCC: Esophageal squamous cell carcinoma |
| HGIN: High-grade intraepithelial neoplasias | ||
| LGIN: Low-grade intraepithelial neoplasias | ||
| Liver | 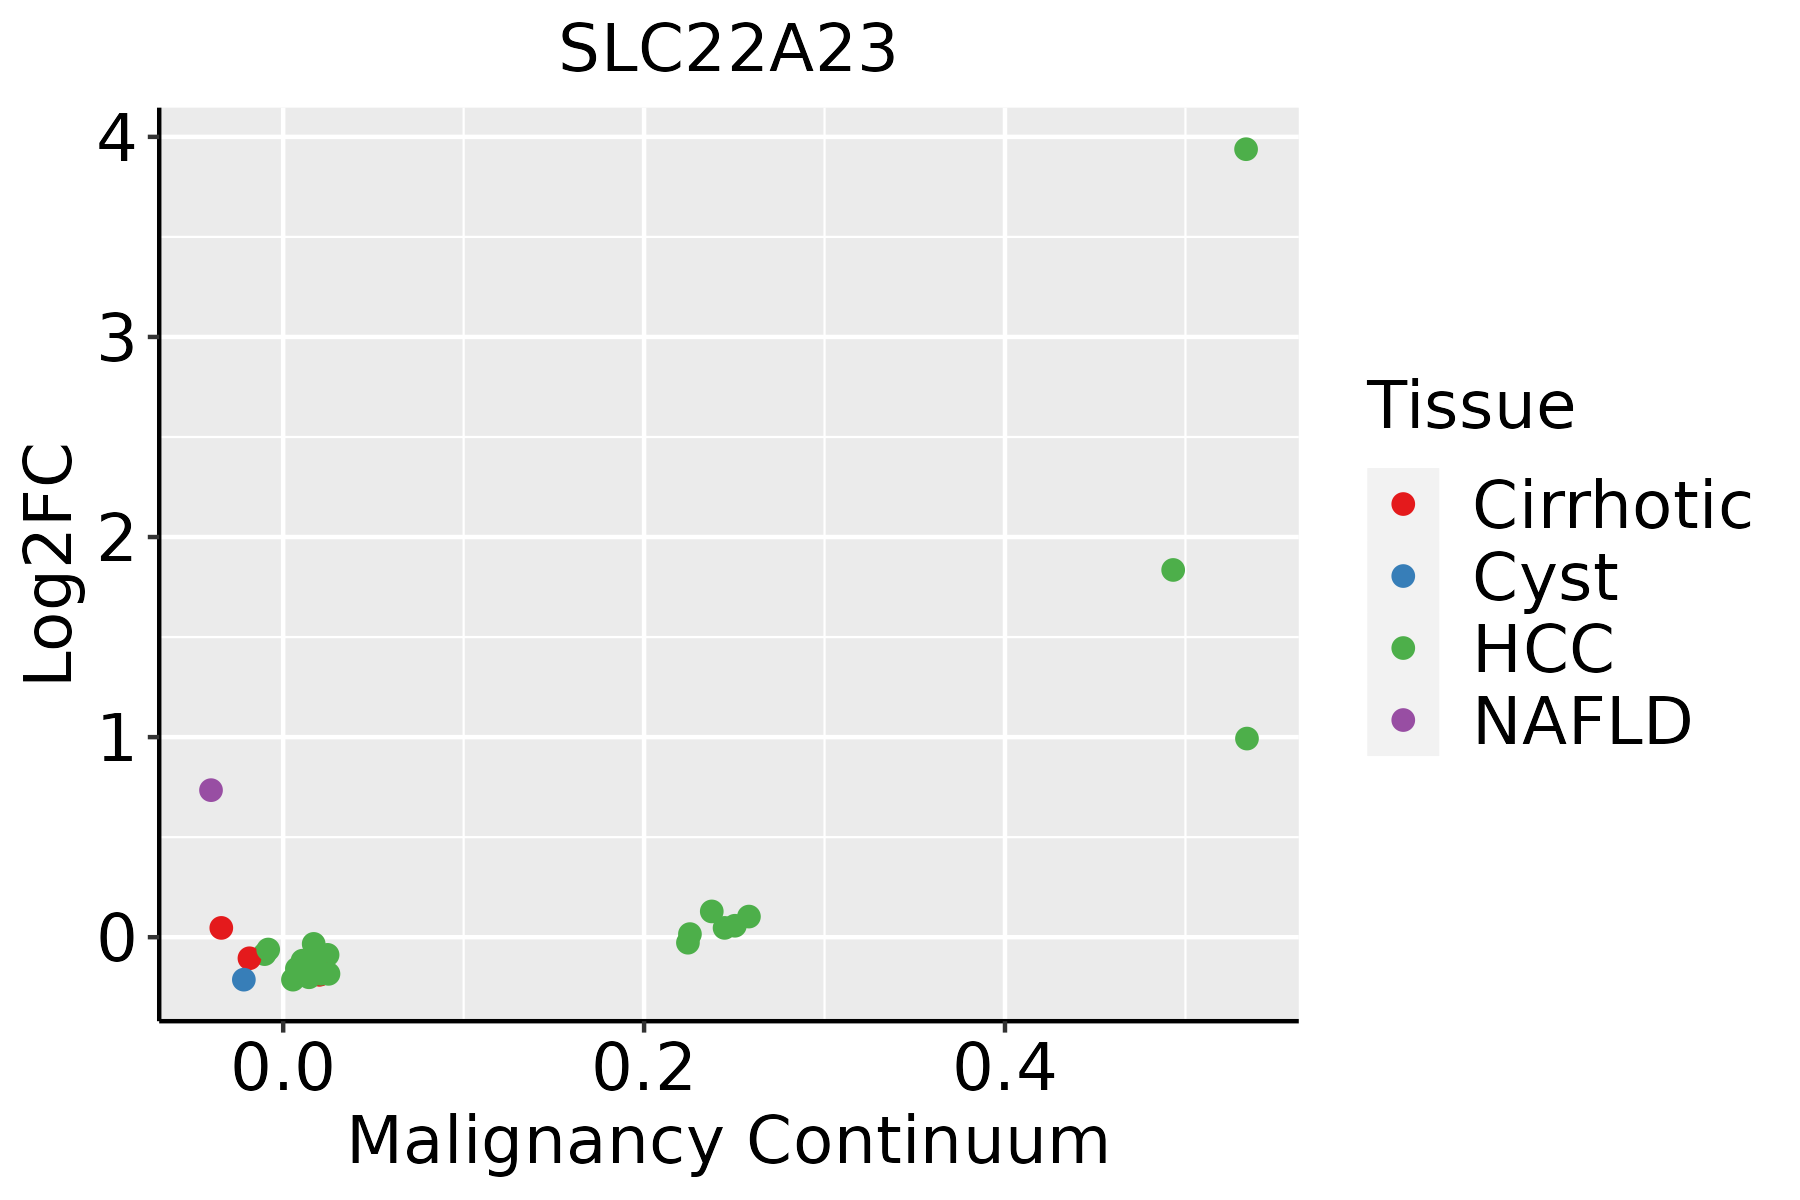 | HCC: Hepatocellular carcinoma |
| NAFLD: Non-alcoholic fatty liver disease | ||
| Lung | 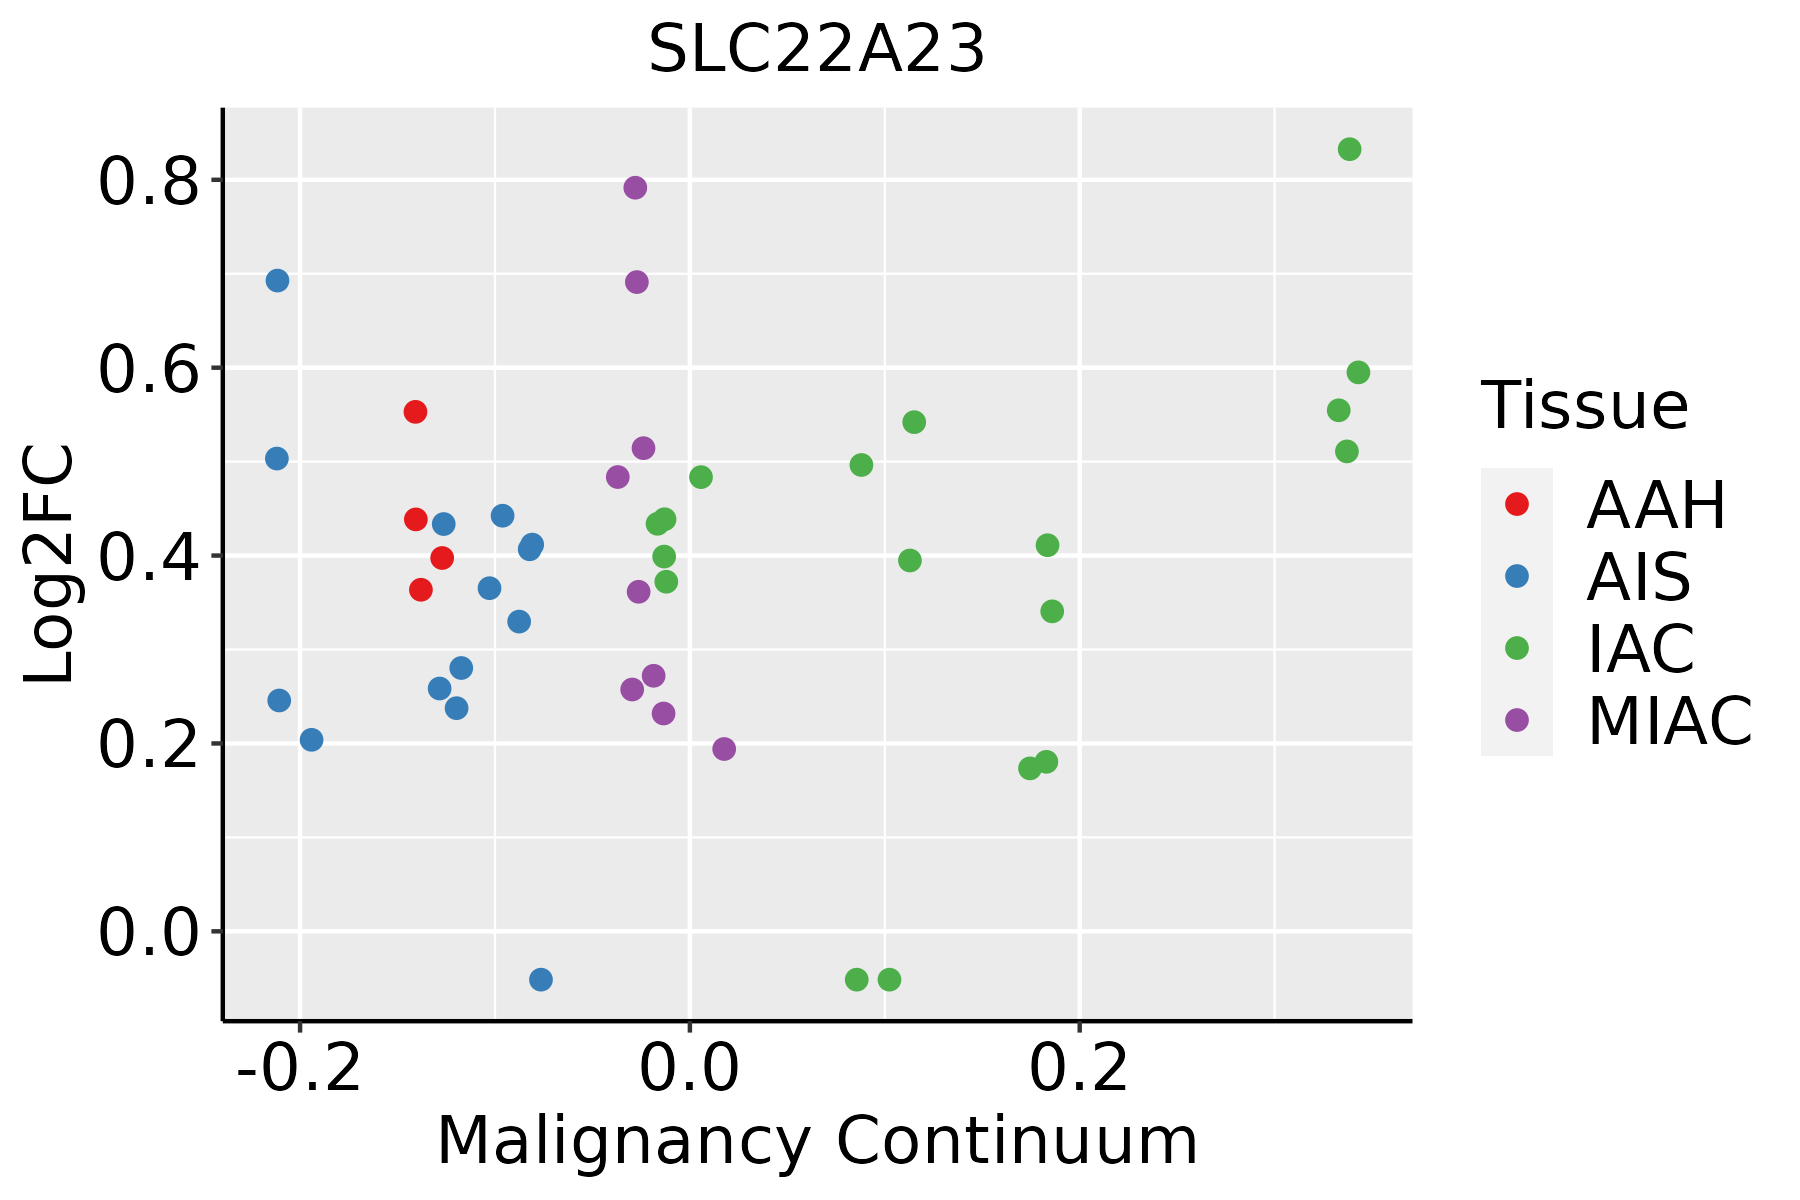 | AAH: Atypical adenomatous hyperplasia |
| AIS: Adenocarcinoma in situ | ||
| IAC: Invasive lung adenocarcinoma | ||
| MIA: Minimally invasive adenocarcinoma | ||
| Oral Cavity | 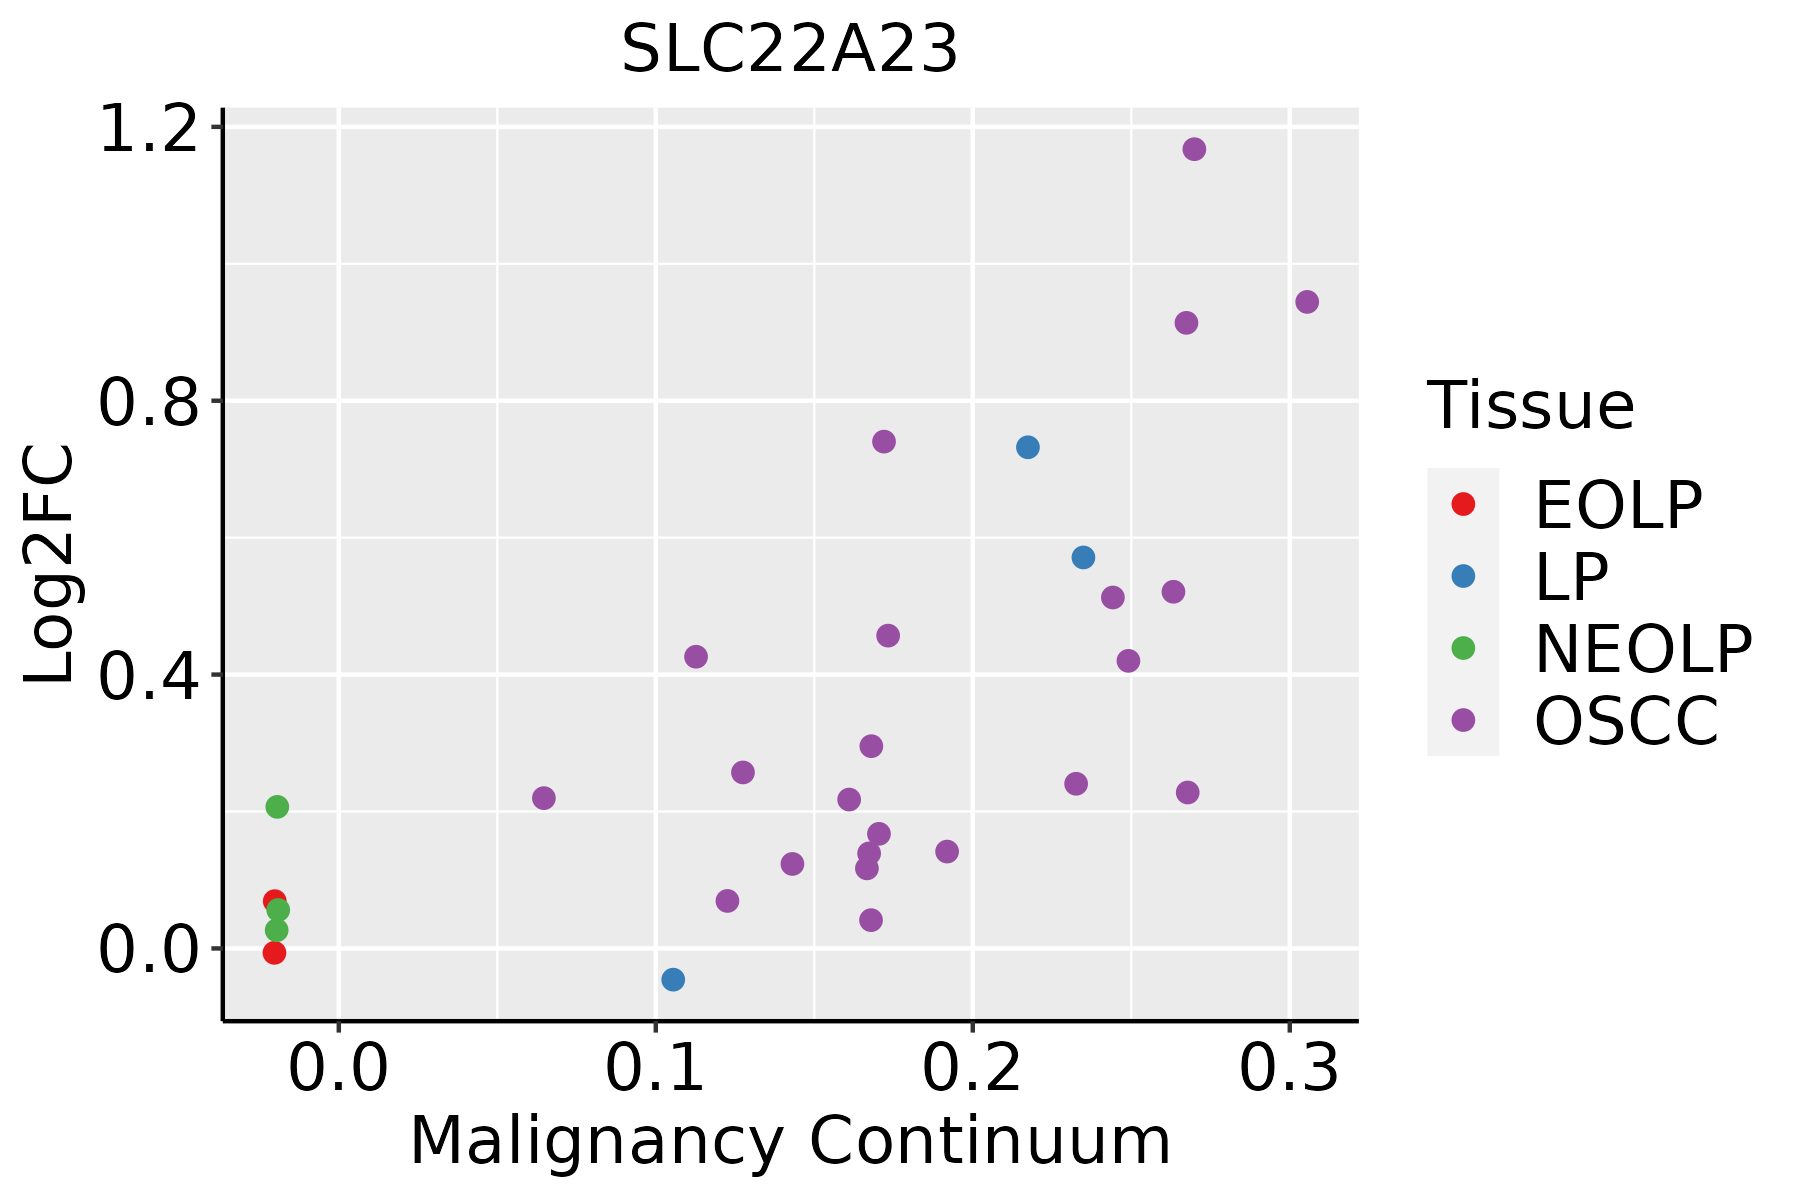 | EOLP: Erosive Oral lichen planus |
| LP: leukoplakia | ||
| NEOLP: Non-erosive oral lichen planus | ||
| OSCC: Oral squamous cell carcinoma |
| ∗log2FC in expression of this searched gene in stem-like cells from each diseased tissue sample relative to stem-like cells in normal samples in each tissue plotted against the malignancy continuum. Samples are colored based on if they are from different disease stage. |
Top |
Malignant transformation related pathway analysis |
| Find out the enriched GO biological processes and KEGG pathways involved in transition from healthy to precancer to cancer |
| Tissue | Disease Stage | Enriched GO biological Processes |
| Colorectum | AD |  |
| Colorectum | SER |  |
| Colorectum | MSS |  |
| Colorectum | MSI-H |  |
| Colorectum | FAP |  |
| ∗Top 15 enriched GO BP terms are showed in the bar plot of each disease state in each tissue. Each row represents a significant GO biological process which is colored according to the -log10(p.adjust). |
| Page: 1 2 3 4 5 6 7 8 9 |
| GO ID | Tissue | Disease Stage | Description | Gene Ratio | Bg Ratio | pvalue | p.adjust | Count |
| Page: 1 |
| Pathway ID | Tissue | Disease Stage | Description | Gene Ratio | Bg Ratio | pvalue | p.adjust | qvalue | Count |
| Page: 1 |
Top |
Cell-cell communication analysis |
| Identification of potential cell-cell interactions between two cell types and their ligand-receptor pairs for different disease states |
| Ligand | Receptor | LRpair | Pathway | Tissue | Disease Stage |
| Page: 1 |
Top |
Single-cell gene regulatory network inference analysis |
| Find out the significant the regulons (TFs) and the target genes of each regulon across cell types for different disease states |
| TF | Cell Type | Tissue | Disease Stage | Target Gene | RSS | Regulon Activity |
| ∗The dot plots of a searched regulon are shown for all cell subpopulations in each disease state of each tissue based on the regulon specific score inferred using pySCENIC and by calculating the average expression. |
| Page: 1 |
Top |
Somatic mutation of malignant transformation related genes |
| Annotation of somatic variants for genes involved in malignant transformation |
| Hugo Symbol | Variant Class | Variant Classification | dbSNP RS | HGVSc | HGVSp | HGVSp Short | SWISSPROT | BIOTYPE | SIFT | PolyPhen | Tumor Sample Barcode | Tissue | Histology | Sex | Age | Stage | Therapy Types | Drugs | Outcome |
| SLC22A23 | SNV | Missense_Mutation | c.1091N>T | p.Pro364Leu | p.P364L | A1A5C7 | protein_coding | deleterious(0.04) | probably_damaging(0.984) | TCGA-A8-A09G-01 | Breast | breast invasive carcinoma | Female | >=65 | III/IV | Unknown | Unknown | SD | |
| SLC22A23 | SNV | Missense_Mutation | rs757839112 | c.1102C>T | p.Arg368Trp | p.R368W | A1A5C7 | protein_coding | deleterious(0) | probably_damaging(0.999) | TCGA-2W-A8YY-01 | Cervix | cervical & endocervical cancer | Female | <65 | I/II | Chemotherapy | cisplatin | CR |
| SLC22A23 | SNV | Missense_Mutation | novel | c.823G>A | p.Ala275Thr | p.A275T | A1A5C7 | protein_coding | tolerated(0.11) | probably_damaging(0.994) | TCGA-AA-A00N-01 | Colorectum | colon adenocarcinoma | Male | >=65 | I/II | Unknown | Unknown | PD |
| SLC22A23 | SNV | Missense_Mutation | rs781457847 | c.1649N>T | p.Ala550Val | p.A550V | A1A5C7 | protein_coding | deleterious(0) | probably_damaging(0.976) | TCGA-AA-A010-01 | Colorectum | colon adenocarcinoma | Female | <65 | I/II | Chemotherapy | folinic | CR |
| SLC22A23 | SNV | Missense_Mutation | c.1064N>C | p.Leu355Pro | p.L355P | A1A5C7 | protein_coding | deleterious(0) | possibly_damaging(0.802) | TCGA-AA-A010-01 | Colorectum | colon adenocarcinoma | Female | <65 | I/II | Chemotherapy | folinic | CR | |
| SLC22A23 | SNV | Missense_Mutation | c.820N>A | p.Val274Met | p.V274M | A1A5C7 | protein_coding | deleterious(0) | probably_damaging(0.998) | TCGA-AD-5900-01 | Colorectum | colon adenocarcinoma | Male | >=65 | I/II | Unknown | Unknown | SD | |
| SLC22A23 | SNV | Missense_Mutation | rs778961106 | c.1327N>A | p.Gly443Arg | p.G443R | A1A5C7 | protein_coding | deleterious(0) | probably_damaging(1) | TCGA-CM-4746-01 | Colorectum | colon adenocarcinoma | Male | <65 | I/II | Unknown | Unknown | SD |
| SLC22A23 | SNV | Missense_Mutation | c.453N>G | p.Asn151Lys | p.N151K | A1A5C7 | protein_coding | tolerated(0.06) | benign(0.34) | TCGA-DM-A280-01 | Colorectum | colon adenocarcinoma | Female | >=65 | I/II | Unknown | Unknown | SD | |
| SLC22A23 | deletion | Frame_Shift_Del | novel | c.1942delN | p.Glu648SerfsTer36 | p.E648Sfs*36 | A1A5C7 | protein_coding | TCGA-AA-3947-01 | Colorectum | colon adenocarcinoma | Female | <65 | I/II | Unknown | Unknown | SD | ||
| SLC22A23 | SNV | Missense_Mutation | novel | c.1337N>T | p.His446Leu | p.H446L | A1A5C7 | protein_coding | deleterious(0) | possibly_damaging(0.904) | TCGA-A5-A0G2-01 | Endometrium | uterine corpus endometrioid carcinoma | Female | <65 | III/IV | Unknown | Unknown | SD |
| Page: 1 2 3 4 5 6 |
Top |
Related drugs of malignant transformation related genes |
| Identification of chemicals and drugs interact with genes involved in malignant transfromation |
| (DGIdb 4.0) |
| Entrez ID | Symbol | Category | Interaction Types | Drug Claim Name | Drug Name | PMIDs |
| Page: 1 |

Copyright 2023-Present -The University of Texas Health Science Center at Houston |