
|
|||||
|
 | |
| |
| |
| |
| |
| |
|
Gene: SLC22A18AS |
Gene summary for SLC22A18AS |
| Gene information | Species | Human | Gene symbol | SLC22A18AS | Gene ID | 5003 |
| Gene name | solute carrier family 22 member 18 antisense | |
| Gene Alias | BWR1B | |
| Cytomap | 11p15.4 | |
| Gene Type | ncRNA | GO ID | NA | UniProtAcc | NA |
Top |
Malignant transformation analysis |
| Identification of the aberrant gene expression in precancerous and cancerous lesions by comparing the gene expression of stem-like cells in diseased tissues with normal stem cells |
| Entrez ID | Symbol | Replicates | Species | Organ | Tissue | Adj P-value | Log2FC | Malignancy |
| 5003 | SLC22A18AS | HTA11_2487_2000001011 | Human | Colorectum | SER | 8.79e-04 | 2.17e-01 | -0.1808 |
| 5003 | SLC22A18AS | HTA11_347_2000001011 | Human | Colorectum | AD | 1.64e-05 | 2.45e-01 | -0.1954 |
| 5003 | SLC22A18AS | HTA11_83_2000001011 | Human | Colorectum | SER | 5.76e-06 | 3.64e-01 | -0.1526 |
| 5003 | SLC22A18AS | HTA11_696_2000001011 | Human | Colorectum | AD | 7.63e-03 | 1.39e-01 | -0.1464 |
| 5003 | SLC22A18AS | HTA11_5212_2000001011 | Human | Colorectum | AD | 8.10e-04 | 3.74e-01 | -0.2061 |
| 5003 | SLC22A18AS | HCC1_Meng | Human | Liver | HCC | 2.14e-06 | 2.19e-02 | 0.0246 |
| 5003 | SLC22A18AS | HCC2_Meng | Human | Liver | HCC | 1.76e-13 | 1.28e-01 | 0.0107 |
| 5003 | SLC22A18AS | S027 | Human | Liver | HCC | 5.20e-10 | 9.53e-01 | 0.2446 |
| 5003 | SLC22A18AS | S028 | Human | Liver | HCC | 1.37e-31 | 1.29e+00 | 0.2503 |
| 5003 | SLC22A18AS | S029 | Human | Liver | HCC | 1.01e-39 | 1.97e+00 | 0.2581 |
| Page: 1 |
| Tissue | Expression Dynamics | Abbreviation |
| Colorectum (GSE201348) |  | FAP: Familial adenomatous polyposis |
| CRC: Colorectal cancer | ||
| Colorectum (HTA11) |  | AD: Adenomas |
| SER: Sessile serrated lesions | ||
| MSI-H: Microsatellite-high colorectal cancer | ||
| MSS: Microsatellite stable colorectal cancer | ||
| Liver | 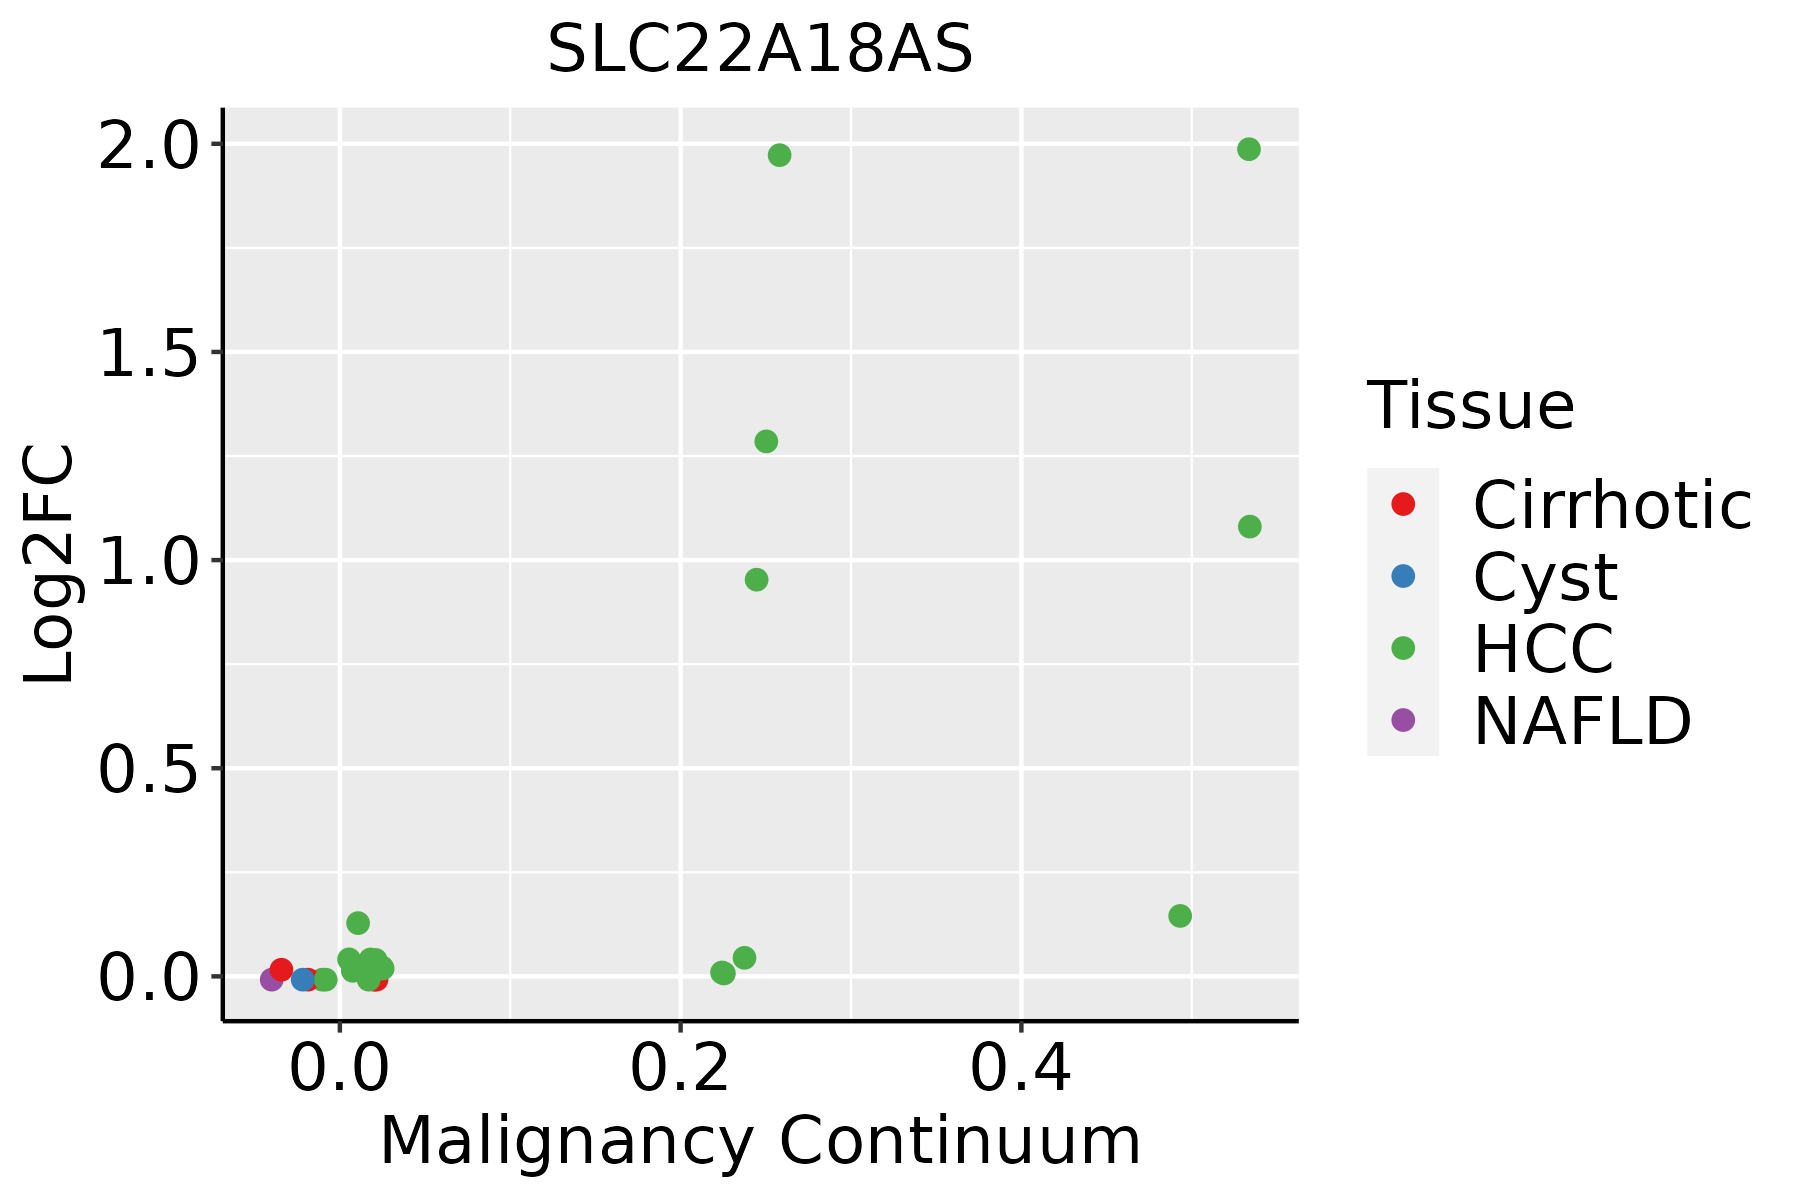 | HCC: Hepatocellular carcinoma |
| NAFLD: Non-alcoholic fatty liver disease |
| ∗log2FC in expression of this searched gene in stem-like cells from each diseased tissue sample relative to stem-like cells in normal samples in each tissue plotted against the malignancy continuum. Samples are colored based on if they are from different disease stage. |
Top |
Malignant transformation related pathway analysis |
| Find out the enriched GO biological processes and KEGG pathways involved in transition from healthy to precancer to cancer |
| Tissue | Disease Stage | Enriched GO biological Processes |
| Colorectum | AD |  |
| Colorectum | SER |  |
| Colorectum | MSS |  |
| Colorectum | MSI-H |  |
| Colorectum | FAP |  |
| ∗Top 15 enriched GO BP terms are showed in the bar plot of each disease state in each tissue. Each row represents a significant GO biological process which is colored according to the -log10(p.adjust). |
| Page: 1 2 3 4 5 6 7 8 9 |
| GO ID | Tissue | Disease Stage | Description | Gene Ratio | Bg Ratio | pvalue | p.adjust | Count |
| Page: 1 |
| Pathway ID | Tissue | Disease Stage | Description | Gene Ratio | Bg Ratio | pvalue | p.adjust | qvalue | Count |
| Page: 1 |
Top |
Cell-cell communication analysis |
| Identification of potential cell-cell interactions between two cell types and their ligand-receptor pairs for different disease states |
| Ligand | Receptor | LRpair | Pathway | Tissue | Disease Stage |
| Page: 1 |
Top |
Single-cell gene regulatory network inference analysis |
| Find out the significant the regulons (TFs) and the target genes of each regulon across cell types for different disease states |
| TF | Cell Type | Tissue | Disease Stage | Target Gene | RSS | Regulon Activity |
| ∗The dot plots of a searched regulon are shown for all cell subpopulations in each disease state of each tissue based on the regulon specific score inferred using pySCENIC and by calculating the average expression. |
| Page: 1 |
Top |
Somatic mutation of malignant transformation related genes |
| Annotation of somatic variants for genes involved in malignant transformation |
| Hugo Symbol | Variant Class | Variant Classification | dbSNP RS | HGVSc | HGVSp | HGVSp Short | SWISSPROT | BIOTYPE | SIFT | PolyPhen | Tumor Sample Barcode | Tissue | Histology | Sex | Age | Stage | Therapy Types | Drugs | Outcome |
| SLC22A18AS | SNV | Missense_Mutation | c.319N>A | p.Glu107Lys | p.E107K | Q8N1D0 | protein_coding | deleterious_low_confidence(0) | benign(0.135) | TCGA-BH-A1F2-01 | Breast | breast invasive carcinoma | Female | <65 | III/IV | Unknown | Unknown | SD | |
| SLC22A18AS | SNV | Missense_Mutation | rs752034244 | c.4C>T | p.Arg2Trp | p.R2W | Q8N1D0 | protein_coding | deleterious_low_confidence(0.02) | benign(0) | TCGA-DS-A7WF-01 | Cervix | cervical & endocervical cancer | Female | <65 | I/II | Chemotherapy | cisplatin | PD |
| SLC22A18AS | SNV | Missense_Mutation | c.295N>T | p.Arg99Cys | p.R99C | Q8N1D0 | protein_coding | deleterious_low_confidence(0) | possibly_damaging(0.632) | TCGA-A6-6653-01 | Colorectum | colon adenocarcinoma | Male | >=65 | I/II | Unknown | Unknown | SD | |
| SLC22A18AS | insertion | Frame_Shift_Ins | rs763131197 | c.357_358insC | p.Asn120GlnfsTer8 | p.N120Qfs*8 | Q8N1D0 | protein_coding | TCGA-CM-6171-01 | Colorectum | colon adenocarcinoma | Female | >=65 | I/II | Unknown | Unknown | SD | ||
| SLC22A18AS | SNV | Missense_Mutation | rs771899336 | c.334N>A | p.Asp112Asn | p.D112N | Q8N1D0 | protein_coding | tolerated_low_confidence(0.47) | benign(0) | TCGA-B5-A11E-01 | Endometrium | uterine corpus endometrioid carcinoma | Female | <65 | I/II | Unknown | Unknown | SD |
| SLC22A18AS | SNV | Missense_Mutation | novel | c.370N>A | p.Ala124Thr | p.A124T | Q8N1D0 | protein_coding | deleterious_low_confidence(0) | benign(0.42) | TCGA-BG-A222-01 | Endometrium | uterine corpus endometrioid carcinoma | Female | <65 | I/II | Unknown | Unknown | SD |
| SLC22A18AS | SNV | Missense_Mutation | novel | c.82N>A | p.Ala28Thr | p.A28T | Q8N1D0 | protein_coding | deleterious_low_confidence(0) | possibly_damaging(0.732) | TCGA-DF-A2KN-01 | Endometrium | uterine corpus endometrioid carcinoma | Female | Unknown | I/II | Unknown | Unknown | SD |
| SLC22A18AS | SNV | Missense_Mutation | novel | c.341N>C | p.Gly114Ala | p.G114A | Q8N1D0 | protein_coding | deleterious_low_confidence(0) | benign(0.376) | TCGA-EY-A1G7-01 | Endometrium | uterine corpus endometrioid carcinoma | Female | >=65 | I/II | Unknown | Unknown | PD |
| SLC22A18AS | SNV | Missense_Mutation | novel | c.356C>A | p.Pro119His | p.P119H | Q8N1D0 | protein_coding | deleterious_low_confidence(0.04) | probably_damaging(0.991) | TCGA-EY-A1GU-01 | Endometrium | uterine corpus endometrioid carcinoma | Female | >=65 | I/II | Unknown | Unknown | SD |
| SLC22A18AS | insertion | Frame_Shift_Ins | rs763131197 | c.357_358insC | p.Asn120GlnfsTer8 | p.N120Qfs*8 | Q8N1D0 | protein_coding | TCGA-PG-A917-01 | Endometrium | uterine corpus endometrioid carcinoma | Female | >=65 | I/II | Unknown | Unknown | SD |
| Page: 1 |
Top |
Related drugs of malignant transformation related genes |
| Identification of chemicals and drugs interact with genes involved in malignant transfromation |
| (DGIdb 4.0) |
| Entrez ID | Symbol | Category | Interaction Types | Drug Claim Name | Drug Name | PMIDs |
| Page: 1 |

Copyright 2023-Present -The University of Texas Health Science Center at Houston |