
|
|||||
|
 | |
| |
| |
| |
| |
| |
|
Gene: SLC22A17 |
Gene summary for SLC22A17 |
| Gene information | Species | Human | Gene symbol | SLC22A17 | Gene ID | 51310 |
| Gene name | solute carrier family 22 member 17 | |
| Gene Alias | 24p3R | |
| Cytomap | 14q11.2 | |
| Gene Type | protein-coding | GO ID | GO:0000041 | UniProtAcc | Q8WUG5 |
Top |
Malignant transformation analysis |
| Identification of the aberrant gene expression in precancerous and cancerous lesions by comparing the gene expression of stem-like cells in diseased tissues with normal stem cells |
| Entrez ID | Symbol | Replicates | Species | Organ | Tissue | Adj P-value | Log2FC | Malignancy |
| 51310 | SLC22A17 | P2T-E | Human | Esophagus | ESCC | 6.12e-07 | 1.38e-01 | 0.1177 |
| 51310 | SLC22A17 | P4T-E | Human | Esophagus | ESCC | 4.51e-20 | 2.27e-01 | 0.1323 |
| 51310 | SLC22A17 | P8T-E | Human | Esophagus | ESCC | 2.53e-04 | 1.06e-01 | 0.0889 |
| 51310 | SLC22A17 | P9T-E | Human | Esophagus | ESCC | 1.45e-05 | 1.17e-01 | 0.1131 |
| 51310 | SLC22A17 | P10T-E | Human | Esophagus | ESCC | 9.14e-24 | 4.01e-01 | 0.116 |
| 51310 | SLC22A17 | P11T-E | Human | Esophagus | ESCC | 7.33e-18 | 6.99e-01 | 0.1426 |
| 51310 | SLC22A17 | P12T-E | Human | Esophagus | ESCC | 2.29e-52 | 9.19e-01 | 0.1122 |
| 51310 | SLC22A17 | P15T-E | Human | Esophagus | ESCC | 8.83e-09 | 2.10e-01 | 0.1149 |
| 51310 | SLC22A17 | P16T-E | Human | Esophagus | ESCC | 1.21e-26 | 5.52e-01 | 0.1153 |
| 51310 | SLC22A17 | P17T-E | Human | Esophagus | ESCC | 1.57e-03 | 1.64e-01 | 0.1278 |
| 51310 | SLC22A17 | P19T-E | Human | Esophagus | ESCC | 5.32e-06 | 8.20e-01 | 0.1662 |
| 51310 | SLC22A17 | P22T-E | Human | Esophagus | ESCC | 6.39e-08 | 1.19e-01 | 0.1236 |
| 51310 | SLC22A17 | P26T-E | Human | Esophagus | ESCC | 1.87e-09 | 1.28e-01 | 0.1276 |
| 51310 | SLC22A17 | P27T-E | Human | Esophagus | ESCC | 7.85e-08 | 1.04e-01 | 0.1055 |
| 51310 | SLC22A17 | P28T-E | Human | Esophagus | ESCC | 2.42e-20 | 3.65e-01 | 0.1149 |
| 51310 | SLC22A17 | P31T-E | Human | Esophagus | ESCC | 1.52e-05 | 5.84e-02 | 0.1251 |
| 51310 | SLC22A17 | P32T-E | Human | Esophagus | ESCC | 3.01e-10 | 2.52e-01 | 0.1666 |
| 51310 | SLC22A17 | P37T-E | Human | Esophagus | ESCC | 2.63e-12 | 1.89e-01 | 0.1371 |
| 51310 | SLC22A17 | P39T-E | Human | Esophagus | ESCC | 2.09e-07 | 4.20e-02 | 0.0894 |
| 51310 | SLC22A17 | P42T-E | Human | Esophagus | ESCC | 2.66e-08 | 1.44e-01 | 0.1175 |
| Page: 1 2 3 |
| Tissue | Expression Dynamics | Abbreviation |
| Esophagus | 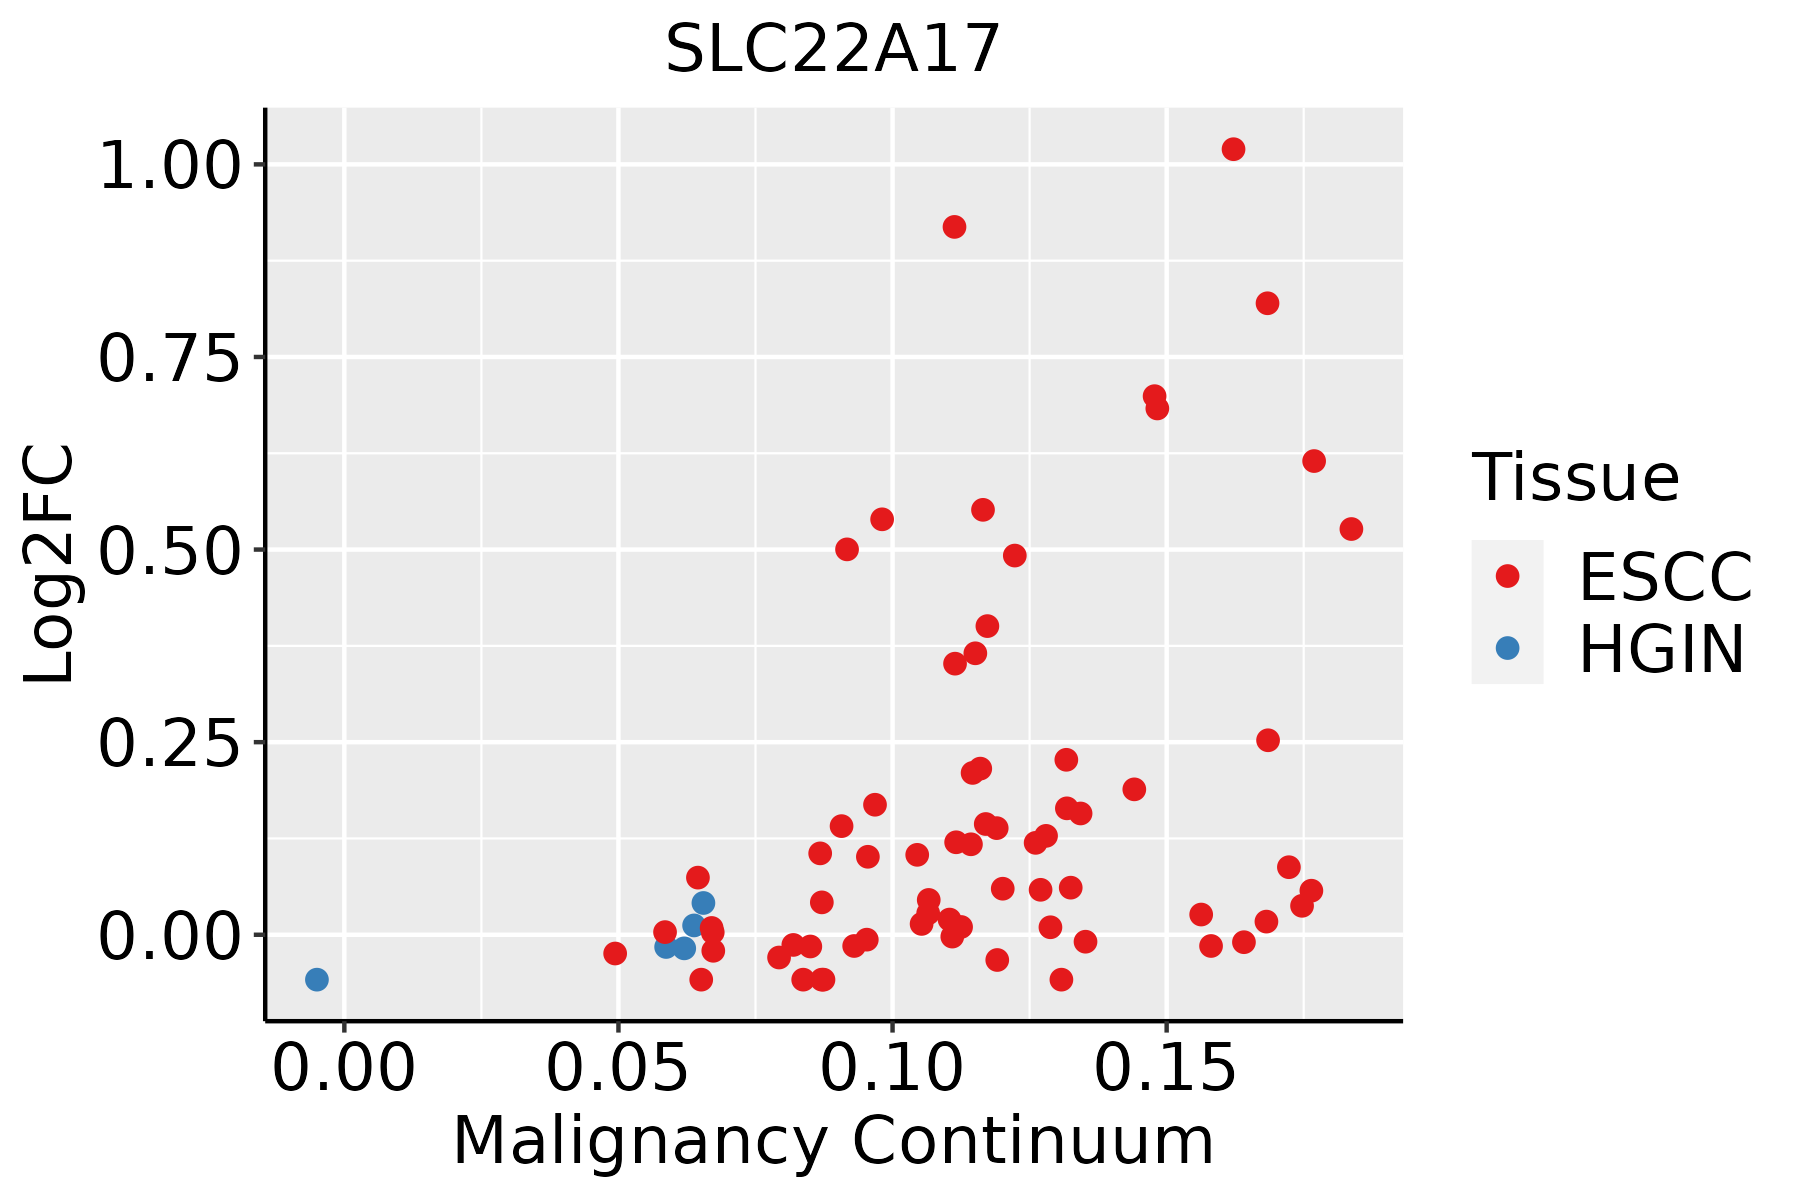 | ESCC: Esophageal squamous cell carcinoma |
| HGIN: High-grade intraepithelial neoplasias | ||
| LGIN: Low-grade intraepithelial neoplasias | ||
| Thyroid |  | ATC: Anaplastic thyroid cancer |
| HT: Hashimoto's thyroiditis | ||
| PTC: Papillary thyroid cancer |
| ∗log2FC in expression of this searched gene in stem-like cells from each diseased tissue sample relative to stem-like cells in normal samples in each tissue plotted against the malignancy continuum. Samples are colored based on if they are from different disease stage. |
Top |
Malignant transformation related pathway analysis |
| Find out the enriched GO biological processes and KEGG pathways involved in transition from healthy to precancer to cancer |
| Tissue | Disease Stage | Enriched GO biological Processes |
| Colorectum | AD |  |
| Colorectum | SER |  |
| Colorectum | MSS |  |
| Colorectum | MSI-H |  |
| Colorectum | FAP |  |
| ∗Top 15 enriched GO BP terms are showed in the bar plot of each disease state in each tissue. Each row represents a significant GO biological process which is colored according to the -log10(p.adjust). |
| Page: 1 2 3 4 5 6 7 8 9 |
| GO ID | Tissue | Disease Stage | Description | Gene Ratio | Bg Ratio | pvalue | p.adjust | Count |
| GO:005507617 | Esophagus | ESCC | transition metal ion homeostasis | 87/8552 | 138/18723 | 2.85e-05 | 2.37e-04 | 87 |
| GO:00469169 | Esophagus | ESCC | cellular transition metal ion homeostasis | 70/8552 | 115/18723 | 7.28e-04 | 3.79e-03 | 70 |
| GO:00550729 | Esophagus | ESCC | iron ion homeostasis | 52/8552 | 85/18723 | 2.86e-03 | 1.21e-02 | 52 |
| GO:0055076110 | Thyroid | PTC | transition metal ion homeostasis | 62/5968 | 138/18723 | 8.66e-04 | 5.30e-03 | 62 |
| GO:005507210 | Thyroid | PTC | iron ion homeostasis | 39/5968 | 85/18723 | 4.71e-03 | 2.21e-02 | 39 |
| GO:005507632 | Thyroid | ATC | transition metal ion homeostasis | 66/6293 | 138/18723 | 3.64e-04 | 2.25e-03 | 66 |
| GO:005507214 | Thyroid | ATC | iron ion homeostasis | 41/6293 | 85/18723 | 3.62e-03 | 1.58e-02 | 41 |
| Page: 1 |
| Pathway ID | Tissue | Disease Stage | Description | Gene Ratio | Bg Ratio | pvalue | p.adjust | qvalue | Count |
| Page: 1 |
Top |
Cell-cell communication analysis |
| Identification of potential cell-cell interactions between two cell types and their ligand-receptor pairs for different disease states |
| Ligand | Receptor | LRpair | Pathway | Tissue | Disease Stage |
| Page: 1 |
Top |
Single-cell gene regulatory network inference analysis |
| Find out the significant the regulons (TFs) and the target genes of each regulon across cell types for different disease states |
| TF | Cell Type | Tissue | Disease Stage | Target Gene | RSS | Regulon Activity |
| ∗The dot plots of a searched regulon are shown for all cell subpopulations in each disease state of each tissue based on the regulon specific score inferred using pySCENIC and by calculating the average expression. |
| Page: 1 |
Top |
Somatic mutation of malignant transformation related genes |
| Annotation of somatic variants for genes involved in malignant transformation |
| Hugo Symbol | Variant Class | Variant Classification | dbSNP RS | HGVSc | HGVSp | HGVSp Short | SWISSPROT | BIOTYPE | SIFT | PolyPhen | Tumor Sample Barcode | Tissue | Histology | Sex | Age | Stage | Therapy Types | Drugs | Outcome |
| SLC22A17 | SNV | Missense_Mutation | c.473N>T | p.Arg158Leu | p.R158L | Q8WUG5 | protein_coding | deleterious(0) | possibly_damaging(0.496) | TCGA-E9-A1RC-01 | Breast | breast invasive carcinoma | Female | <65 | III/IV | Hormone Therapy | tamoxiphen | SD | |
| SLC22A17 | SNV | Missense_Mutation | rs747236415 | c.964N>T | p.Arg322Cys | p.R322C | Q8WUG5 | protein_coding | tolerated(0.18) | benign(0.007) | TCGA-2W-A8YY-01 | Cervix | cervical & endocervical cancer | Female | <65 | I/II | Chemotherapy | cisplatin | CR |
| SLC22A17 | SNV | Missense_Mutation | rs377056957 | c.379N>T | p.Arg127Cys | p.R127C | Q8WUG5 | protein_coding | deleterious(0) | probably_damaging(0.996) | TCGA-2W-A8YY-01 | Cervix | cervical & endocervical cancer | Female | <65 | I/II | Chemotherapy | cisplatin | CR |
| SLC22A17 | SNV | Missense_Mutation | c.307N>C | p.Glu103Gln | p.E103Q | Q8WUG5 | protein_coding | tolerated(0.29) | possibly_damaging(0.771) | TCGA-DR-A0ZM-01 | Cervix | cervical & endocervical cancer | Female | <65 | III/IV | Unspecific | Cisplatin | SD | |
| SLC22A17 | SNV | Missense_Mutation | novel | c.956N>G | p.His319Arg | p.H319R | Q8WUG5 | protein_coding | tolerated(0.09) | benign(0.162) | TCGA-5M-AAT6-01 | Colorectum | colon adenocarcinoma | Female | <65 | III/IV | Unknown | Unknown | PD |
| SLC22A17 | SNV | Missense_Mutation | c.191C>T | p.Pro64Leu | p.P64L | Q8WUG5 | protein_coding | tolerated(0.19) | benign(0.326) | TCGA-AA-3663-01 | Colorectum | colon adenocarcinoma | Male | <65 | I/II | Unknown | Unknown | SD | |
| SLC22A17 | SNV | Missense_Mutation | c.917N>C | p.Lys306Thr | p.K306T | Q8WUG5 | protein_coding | deleterious(0) | probably_damaging(0.979) | TCGA-AA-A00N-01 | Colorectum | colon adenocarcinoma | Male | >=65 | I/II | Unknown | Unknown | PD | |
| SLC22A17 | SNV | Missense_Mutation | c.1516C>T | p.Arg506Trp | p.R506W | Q8WUG5 | protein_coding | deleterious(0.01) | probably_damaging(0.972) | TCGA-AZ-4313-01 | Colorectum | colon adenocarcinoma | Female | <65 | I/II | Unknown | Unknown | SD | |
| SLC22A17 | SNV | Missense_Mutation | c.953N>T | p.Ala318Val | p.A318V | Q8WUG5 | protein_coding | deleterious(0.01) | possibly_damaging(0.861) | TCGA-CA-6718-01 | Colorectum | colon adenocarcinoma | Male | <65 | I/II | Unknown | Unknown | PD | |
| SLC22A17 | SNV | Missense_Mutation | c.23N>T | p.Thr8Met | p.T8M | Q8WUG5 | protein_coding | deleterious(0) | possibly_damaging(0.78) | TCGA-CM-4743-01 | Colorectum | colon adenocarcinoma | Male | >=65 | I/II | Chemotherapy | capecitabine | SD |
| Page: 1 2 3 4 |
Top |
Related drugs of malignant transformation related genes |
| Identification of chemicals and drugs interact with genes involved in malignant transfromation |
| (DGIdb 4.0) |
| Entrez ID | Symbol | Category | Interaction Types | Drug Claim Name | Drug Name | PMIDs |
| Page: 1 |

Copyright 2023-Present -The University of Texas Health Science Center at Houston |