
|
|||||
|
 | |
| |
| |
| |
| |
| |
|
Gene: SLC20A2 |
Gene summary for SLC20A2 |
| Gene information | Species | Human | Gene symbol | SLC20A2 | Gene ID | 6575 |
| Gene name | solute carrier family 20 member 2 | |
| Gene Alias | GLVR-2 | |
| Cytomap | 8p11.21 | |
| Gene Type | protein-coding | GO ID | GO:0006810 | UniProtAcc | Q08357 |
Top |
Malignant transformation analysis |
| Identification of the aberrant gene expression in precancerous and cancerous lesions by comparing the gene expression of stem-like cells in diseased tissues with normal stem cells |
| Entrez ID | Symbol | Replicates | Species | Organ | Tissue | Adj P-value | Log2FC | Malignancy |
| 6575 | SLC20A2 | CA_HPV_3 | Human | Cervix | CC | 3.38e-07 | 1.76e-01 | 0.0414 |
| 6575 | SLC20A2 | CCI_1 | Human | Cervix | CC | 1.08e-07 | 1.04e+00 | 0.528 |
| 6575 | SLC20A2 | CCI_2 | Human | Cervix | CC | 4.57e-10 | 1.28e+00 | 0.5249 |
| 6575 | SLC20A2 | CCI_3 | Human | Cervix | CC | 5.00e-11 | 9.66e-01 | 0.516 |
| 6575 | SLC20A2 | HTA11_3410_2000001011 | Human | Colorectum | AD | 4.54e-05 | -3.60e-01 | 0.0155 |
| 6575 | SLC20A2 | HTA11_347_2000001011 | Human | Colorectum | AD | 2.75e-07 | 4.71e-01 | -0.1954 |
| 6575 | SLC20A2 | A001-C-207 | Human | Colorectum | FAP | 5.35e-03 | -2.87e-01 | 0.1278 |
| 6575 | SLC20A2 | A015-C-203 | Human | Colorectum | FAP | 1.40e-23 | -3.90e-01 | -0.1294 |
| 6575 | SLC20A2 | A015-C-204 | Human | Colorectum | FAP | 5.71e-05 | -3.16e-01 | -0.0228 |
| 6575 | SLC20A2 | A014-C-040 | Human | Colorectum | FAP | 5.63e-04 | -3.28e-01 | -0.1184 |
| 6575 | SLC20A2 | A002-C-201 | Human | Colorectum | FAP | 1.75e-11 | -3.17e-01 | 0.0324 |
| 6575 | SLC20A2 | A001-C-119 | Human | Colorectum | FAP | 4.57e-02 | -2.19e-01 | -0.1557 |
| 6575 | SLC20A2 | A001-C-108 | Human | Colorectum | FAP | 3.46e-15 | -3.84e-01 | -0.0272 |
| 6575 | SLC20A2 | A002-C-205 | Human | Colorectum | FAP | 1.19e-19 | -3.67e-01 | -0.1236 |
| 6575 | SLC20A2 | A015-C-005 | Human | Colorectum | FAP | 1.12e-02 | -2.78e-01 | -0.0336 |
| 6575 | SLC20A2 | A015-C-006 | Human | Colorectum | FAP | 4.94e-14 | -4.58e-01 | -0.0994 |
| 6575 | SLC20A2 | A015-C-106 | Human | Colorectum | FAP | 3.64e-08 | -2.49e-01 | -0.0511 |
| 6575 | SLC20A2 | A002-C-114 | Human | Colorectum | FAP | 8.42e-19 | -4.72e-01 | -0.1561 |
| 6575 | SLC20A2 | A015-C-104 | Human | Colorectum | FAP | 6.84e-25 | -4.79e-01 | -0.1899 |
| 6575 | SLC20A2 | A001-C-014 | Human | Colorectum | FAP | 4.59e-12 | -3.18e-01 | 0.0135 |
| Page: 1 2 3 4 5 6 7 8 9 |
| Tissue | Expression Dynamics | Abbreviation |
| Cervix | 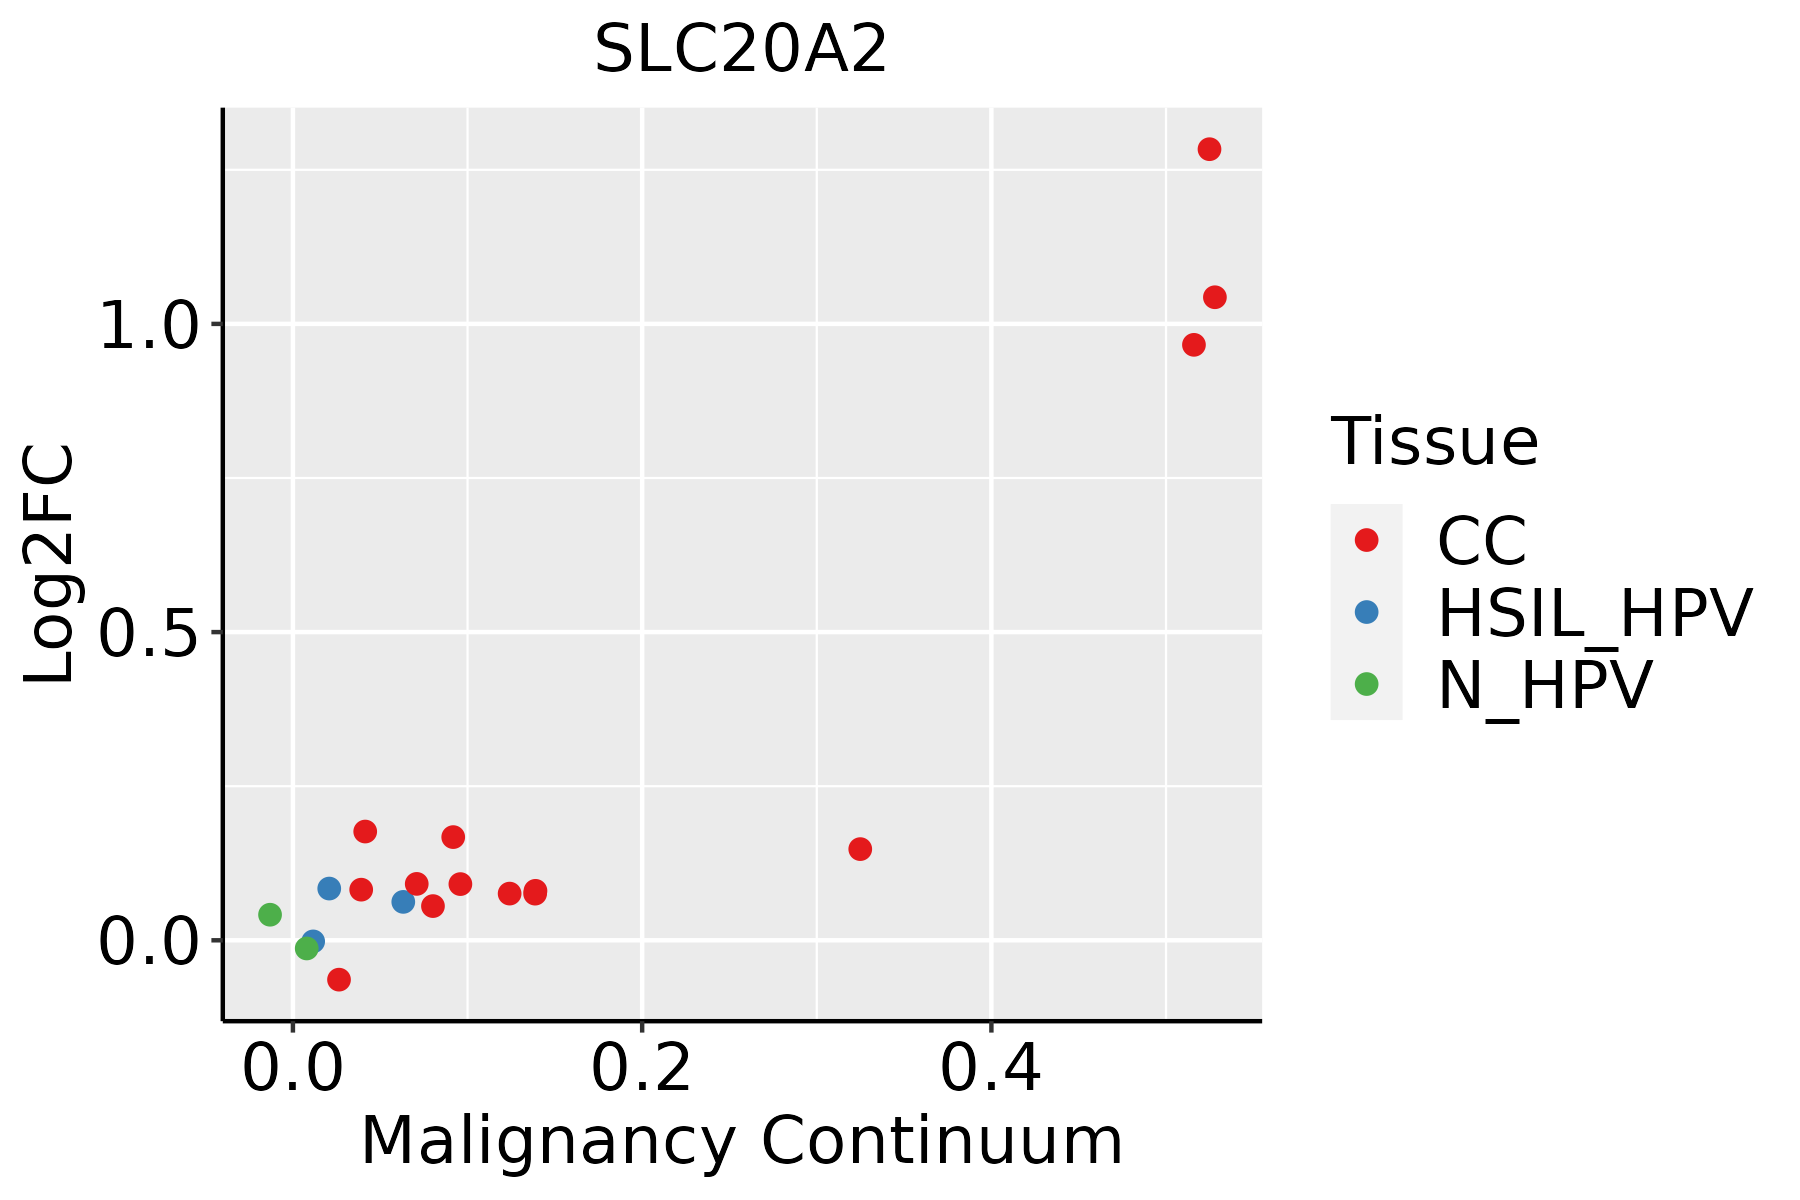 | CC: Cervix cancer |
| HSIL_HPV: HPV-infected high-grade squamous intraepithelial lesions | ||
| N_HPV: HPV-infected normal cervix | ||
| Colorectum (GSE201348) |  | FAP: Familial adenomatous polyposis |
| CRC: Colorectal cancer | ||
| Colorectum (HTA11) |  | AD: Adenomas |
| SER: Sessile serrated lesions | ||
| MSI-H: Microsatellite-high colorectal cancer | ||
| MSS: Microsatellite stable colorectal cancer | ||
| Endometrium |  | AEH: Atypical endometrial hyperplasia |
| EEC: Endometrioid Cancer | ||
| Esophagus |  | ESCC: Esophageal squamous cell carcinoma |
| HGIN: High-grade intraepithelial neoplasias | ||
| LGIN: Low-grade intraepithelial neoplasias | ||
| Lung | 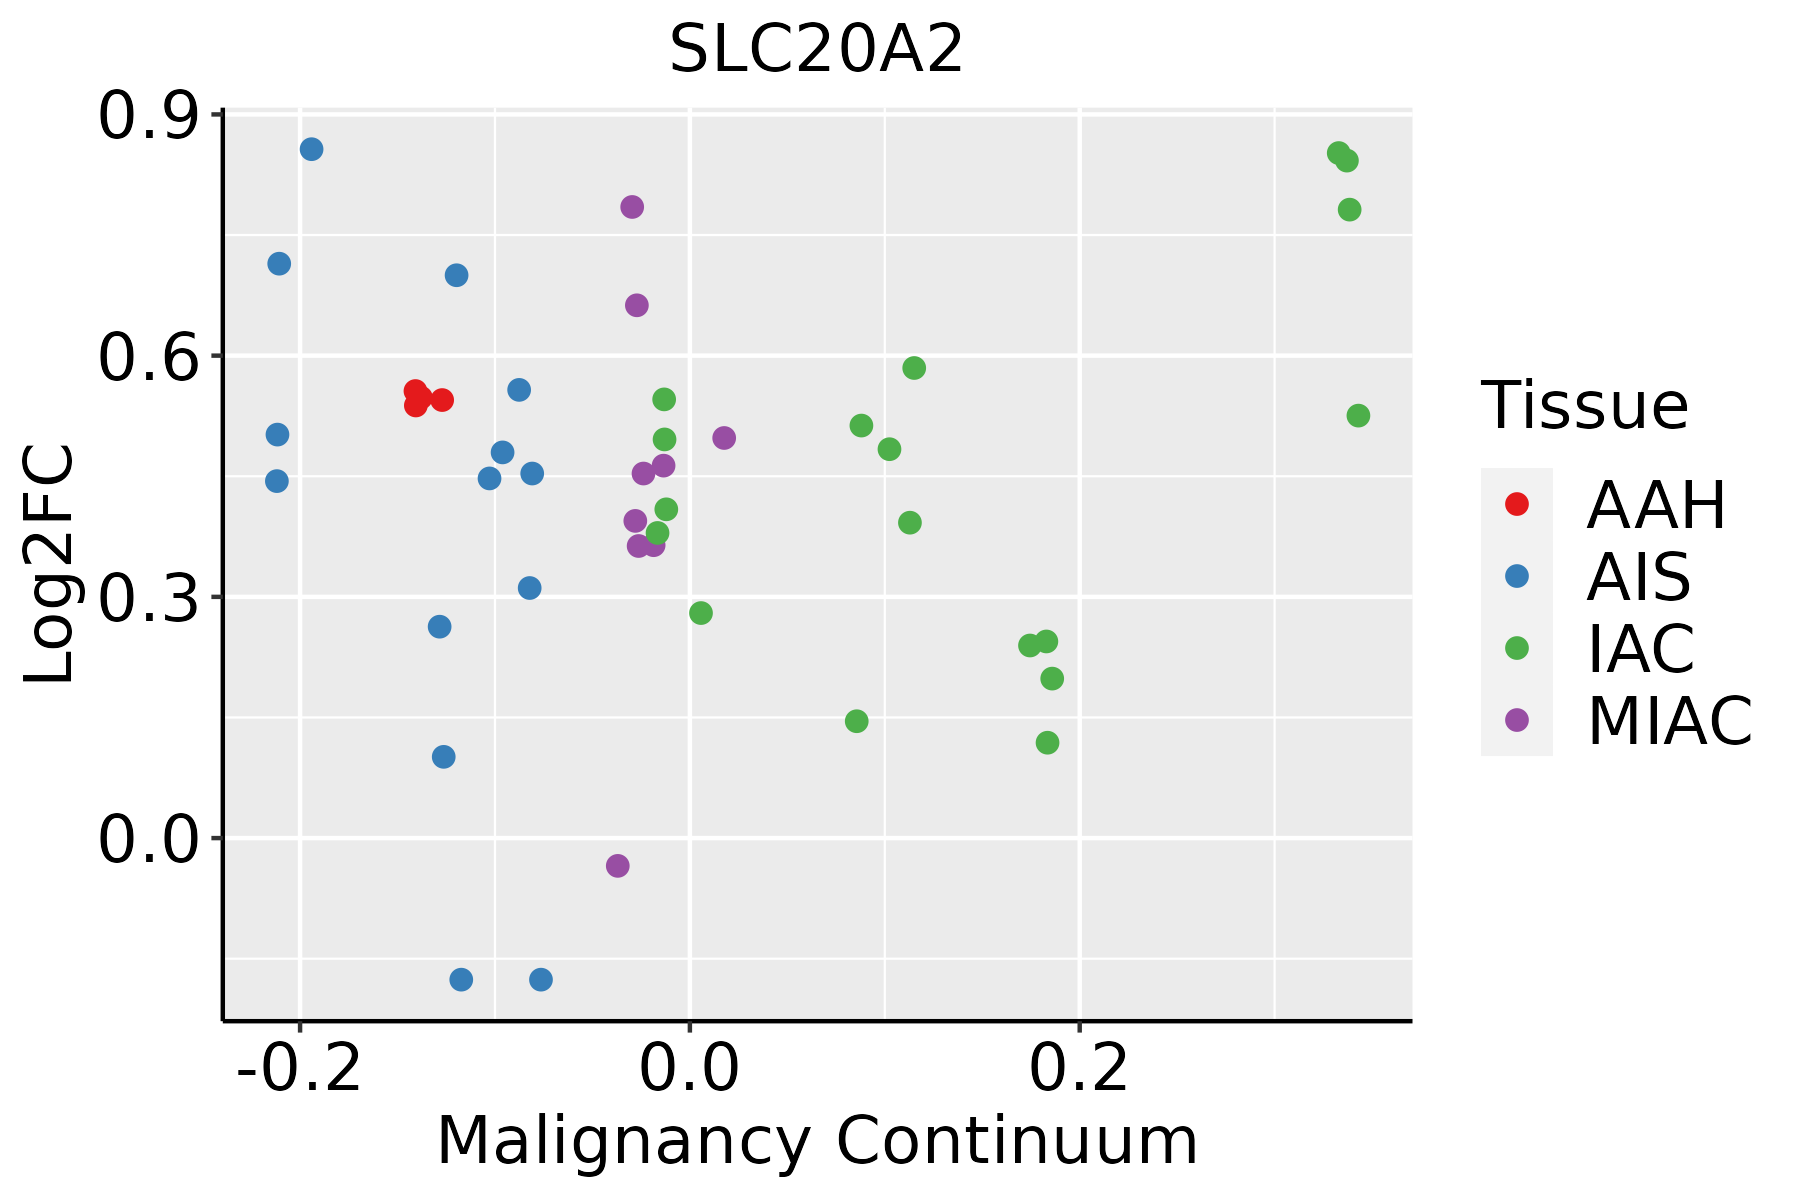 | AAH: Atypical adenomatous hyperplasia |
| AIS: Adenocarcinoma in situ | ||
| IAC: Invasive lung adenocarcinoma | ||
| MIA: Minimally invasive adenocarcinoma | ||
| Oral Cavity |  | EOLP: Erosive Oral lichen planus |
| LP: leukoplakia | ||
| NEOLP: Non-erosive oral lichen planus | ||
| OSCC: Oral squamous cell carcinoma | ||
| Prostate | 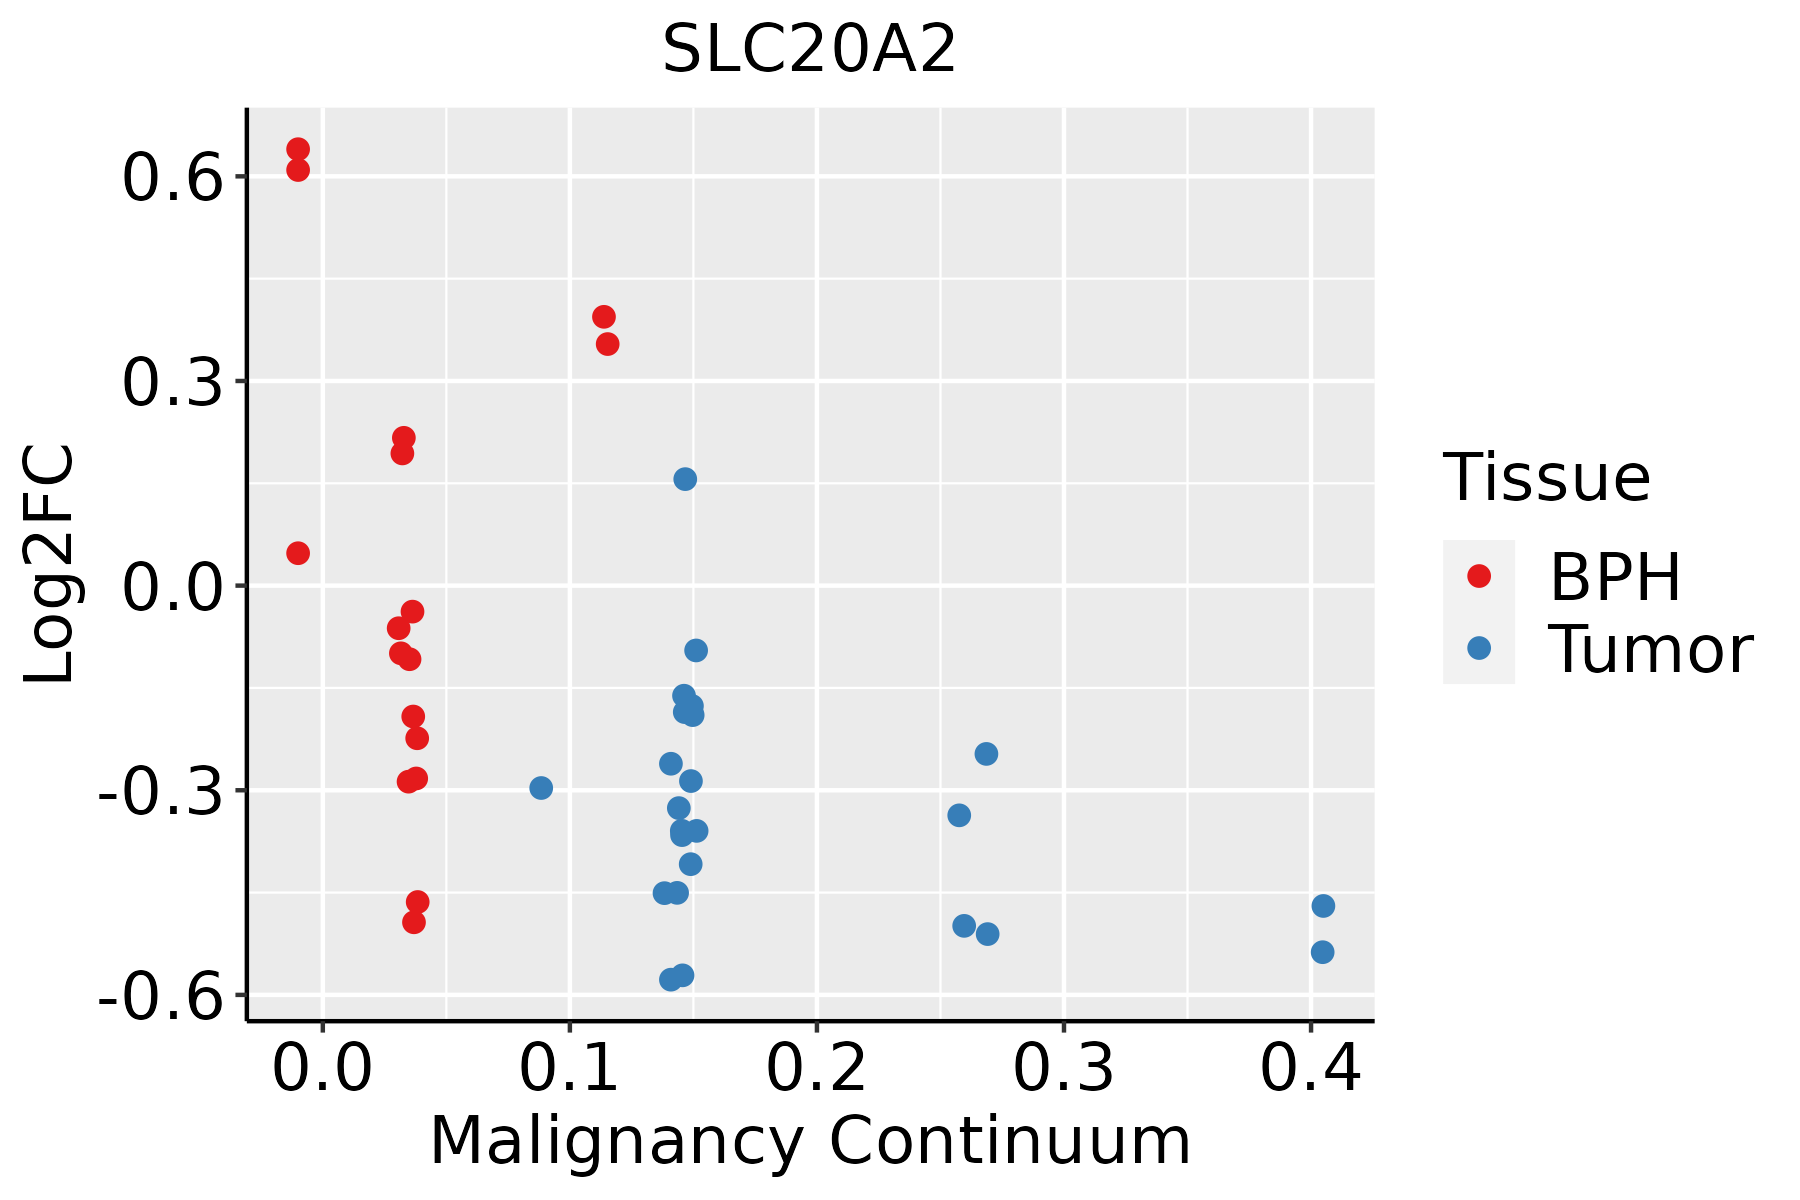 | BPH: Benign Prostatic Hyperplasia |
| Skin |  | AK: Actinic keratosis |
| cSCC: Cutaneous squamous cell carcinoma | ||
| SCCIS:squamous cell carcinoma in situ | ||
| Thyroid | 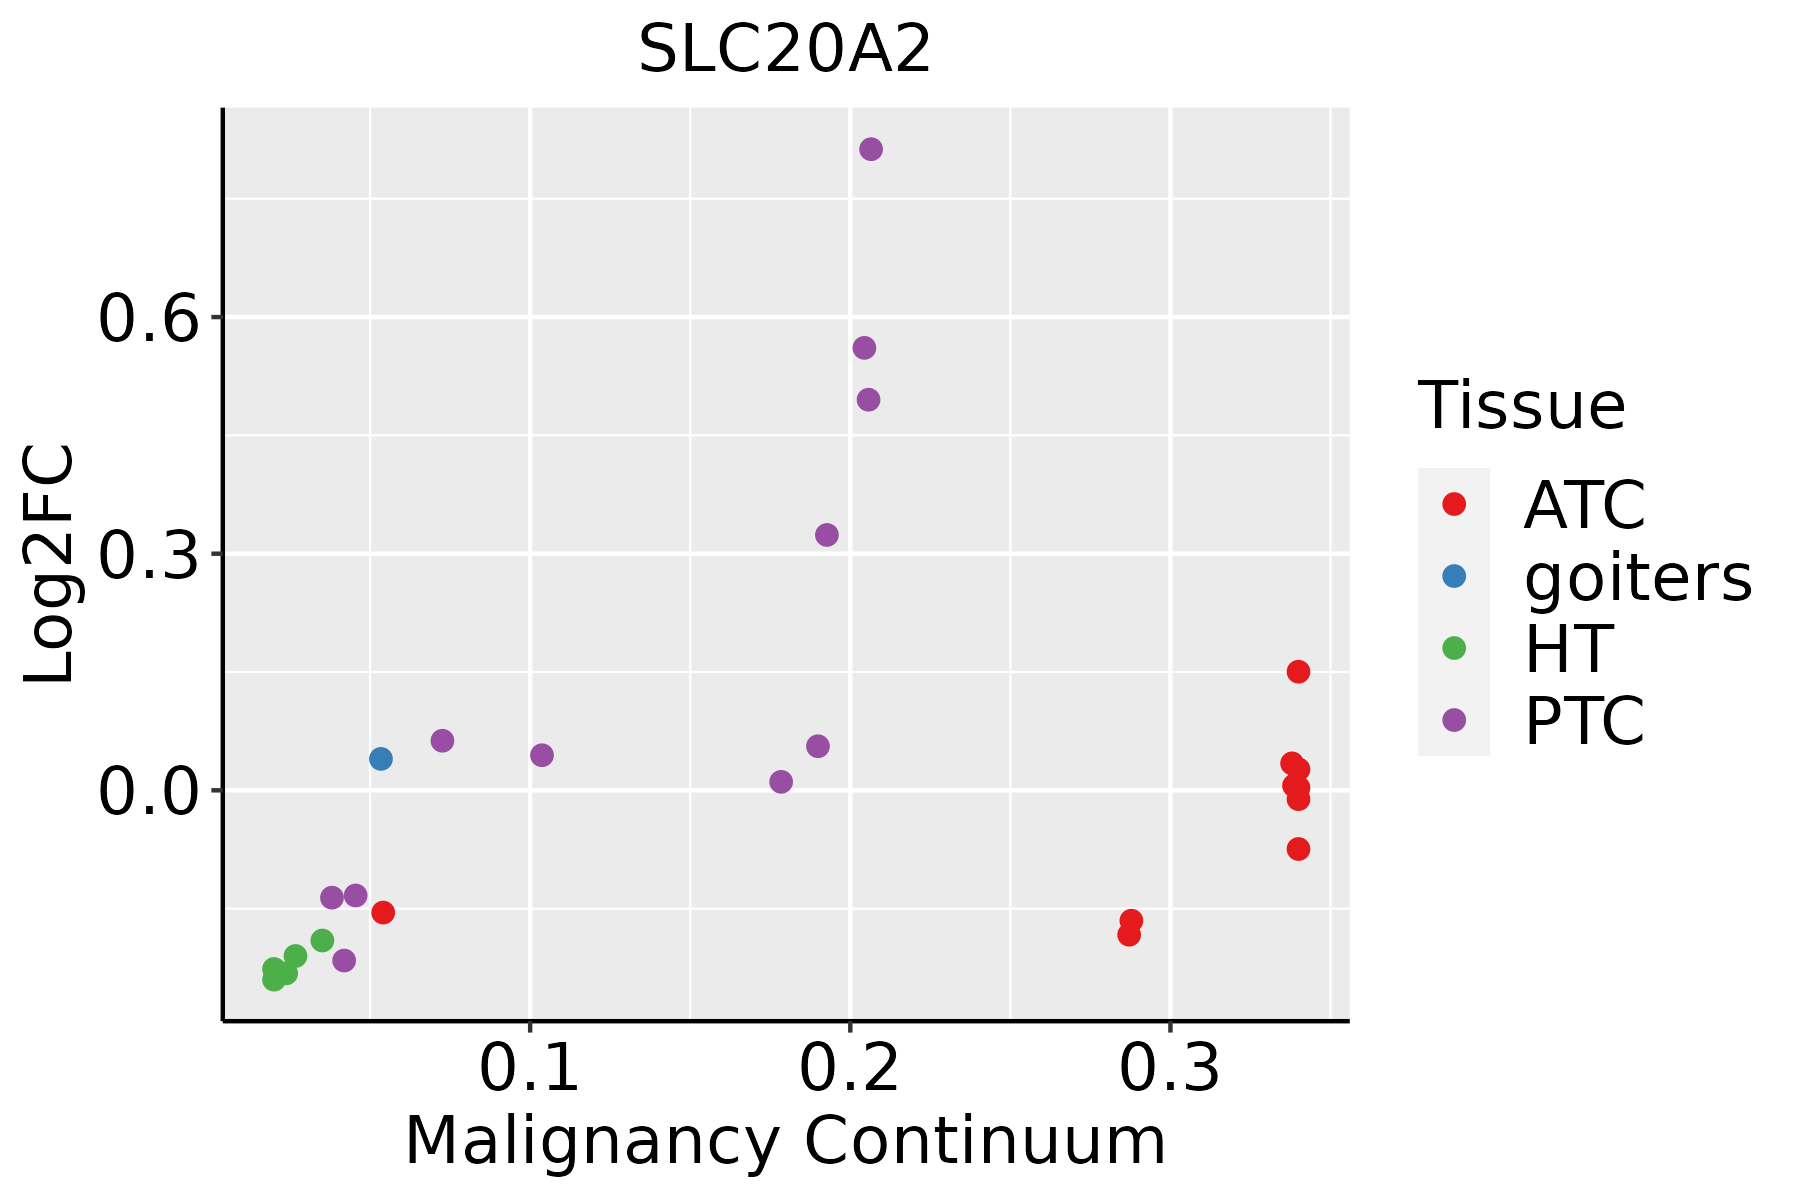 | ATC: Anaplastic thyroid cancer |
| HT: Hashimoto's thyroiditis | ||
| PTC: Papillary thyroid cancer |
| ∗log2FC in expression of this searched gene in stem-like cells from each diseased tissue sample relative to stem-like cells in normal samples in each tissue plotted against the malignancy continuum. Samples are colored based on if they are from different disease stage. |
Top |
Malignant transformation related pathway analysis |
| Find out the enriched GO biological processes and KEGG pathways involved in transition from healthy to precancer to cancer |
| Tissue | Disease Stage | Enriched GO biological Processes |
| Colorectum | AD |  |
| Colorectum | SER |  |
| Colorectum | MSS |  |
| Colorectum | MSI-H |  |
| Colorectum | FAP |  |
| ∗Top 15 enriched GO BP terms are showed in the bar plot of each disease state in each tissue. Each row represents a significant GO biological process which is colored according to the -log10(p.adjust). |
| Page: 1 2 3 4 5 6 7 8 9 |
| GO ID | Tissue | Disease Stage | Description | Gene Ratio | Bg Ratio | pvalue | p.adjust | Count |
| GO:001603210 | Cervix | CC | viral process | 109/2311 | 415/18723 | 5.40e-15 | 6.46e-12 | 109 |
| GO:001905810 | Cervix | CC | viral life cycle | 87/2311 | 317/18723 | 2.20e-13 | 1.20e-10 | 87 |
| GO:005212610 | Cervix | CC | movement in host environment | 52/2311 | 175/18723 | 7.03e-10 | 8.76e-08 | 52 |
| GO:004440910 | Cervix | CC | entry into host | 47/2311 | 151/18723 | 8.45e-10 | 1.03e-07 | 47 |
| GO:005170110 | Cervix | CC | biological process involved in interaction with host | 57/2311 | 203/18723 | 1.18e-09 | 1.41e-07 | 57 |
| GO:004671810 | Cervix | CC | viral entry into host cell | 44/2311 | 144/18723 | 5.47e-09 | 5.03e-07 | 44 |
| GO:004440310 | Cervix | CC | biological process involved in symbiotic interaction | 71/2311 | 290/18723 | 7.94e-09 | 6.98e-07 | 71 |
| GO:0016032 | Colorectum | AD | viral process | 168/3918 | 415/18723 | 4.67e-20 | 3.66e-17 | 168 |
| GO:0019058 | Colorectum | AD | viral life cycle | 119/3918 | 317/18723 | 6.18e-12 | 8.23e-10 | 119 |
| GO:0044403 | Colorectum | AD | biological process involved in symbiotic interaction | 99/3918 | 290/18723 | 1.02e-07 | 4.93e-06 | 99 |
| GO:0051701 | Colorectum | AD | biological process involved in interaction with host | 73/3918 | 203/18723 | 5.08e-07 | 1.88e-05 | 73 |
| GO:0052126 | Colorectum | AD | movement in host environment | 63/3918 | 175/18723 | 2.85e-06 | 8.11e-05 | 63 |
| GO:0046718 | Colorectum | AD | viral entry into host cell | 51/3918 | 144/18723 | 3.99e-05 | 7.16e-04 | 51 |
| GO:0044409 | Colorectum | AD | entry into host | 51/3918 | 151/18723 | 1.60e-04 | 2.21e-03 | 51 |
| GO:0015698 | Colorectum | AD | inorganic anion transport | 52/3918 | 180/18723 | 6.83e-03 | 4.22e-02 | 52 |
| GO:00160324 | Colorectum | FAP | viral process | 114/2622 | 415/18723 | 3.00e-13 | 2.63e-10 | 114 |
| GO:00190584 | Colorectum | FAP | viral life cycle | 81/2622 | 317/18723 | 2.97e-08 | 2.64e-06 | 81 |
| GO:00444034 | Colorectum | FAP | biological process involved in symbiotic interaction | 66/2622 | 290/18723 | 3.47e-05 | 7.64e-04 | 66 |
| GO:0035725 | Colorectum | FAP | sodium ion transmembrane transport | 44/2622 | 178/18723 | 9.31e-05 | 1.60e-03 | 44 |
| GO:00521264 | Colorectum | FAP | movement in host environment | 42/2622 | 175/18723 | 2.64e-04 | 3.60e-03 | 42 |
| Page: 1 2 3 4 5 6 7 |
| Pathway ID | Tissue | Disease Stage | Description | Gene Ratio | Bg Ratio | pvalue | p.adjust | qvalue | Count |
| Page: 1 |
Top |
Cell-cell communication analysis |
| Identification of potential cell-cell interactions between two cell types and their ligand-receptor pairs for different disease states |
| Ligand | Receptor | LRpair | Pathway | Tissue | Disease Stage |
| Page: 1 |
Top |
Single-cell gene regulatory network inference analysis |
| Find out the significant the regulons (TFs) and the target genes of each regulon across cell types for different disease states |
| TF | Cell Type | Tissue | Disease Stage | Target Gene | RSS | Regulon Activity |
| ∗The dot plots of a searched regulon are shown for all cell subpopulations in each disease state of each tissue based on the regulon specific score inferred using pySCENIC and by calculating the average expression. |
| Page: 1 |
Top |
Somatic mutation of malignant transformation related genes |
| Annotation of somatic variants for genes involved in malignant transformation |
| Hugo Symbol | Variant Class | Variant Classification | dbSNP RS | HGVSc | HGVSp | HGVSp Short | SWISSPROT | BIOTYPE | SIFT | PolyPhen | Tumor Sample Barcode | Tissue | Histology | Sex | Age | Stage | Therapy Types | Drugs | Outcome |
| SLC20A2 | SNV | Missense_Mutation | c.985N>A | p.Gly329Ser | p.G329S | Q08357 | protein_coding | tolerated(0.14) | probably_damaging(0.916) | TCGA-BH-A0HA-01 | Breast | breast invasive carcinoma | Female | <65 | I/II | Unknown | Unknown | SD | |
| SLC20A2 | SNV | Missense_Mutation | c.1142G>A | p.Arg381His | p.R381H | Q08357 | protein_coding | deleterious(0) | probably_damaging(0.996) | TCGA-BH-A18G-01 | Breast | breast invasive carcinoma | Female | >=65 | I/II | Unknown | Unknown | SD | |
| SLC20A2 | SNV | Missense_Mutation | c.1142G>A | p.Arg381His | p.R381H | Q08357 | protein_coding | deleterious(0) | probably_damaging(0.996) | TCGA-D8-A1XY-01 | Breast | breast invasive carcinoma | Female | >=65 | I/II | Chemotherapy | tamoxiphen | SD | |
| SLC20A2 | SNV | Missense_Mutation | novel | c.1216G>A | p.Asp406Asn | p.D406N | Q08357 | protein_coding | tolerated(0.19) | benign(0.201) | TCGA-E2-A2P6-01 | Breast | breast invasive carcinoma | Female | >=65 | I/II | Hormone Therapy | anastrozole | SD |
| SLC20A2 | SNV | Missense_Mutation | novel | c.608C>T | p.Ala203Val | p.A203V | Q08357 | protein_coding | deleterious(0.01) | possibly_damaging(0.897) | TCGA-LL-A5YO-01 | Breast | breast invasive carcinoma | Female | <65 | I/II | Chemotherapy | taxotere | CR |
| SLC20A2 | SNV | Missense_Mutation | rs777147006 | c.922N>T | p.Arg308Trp | p.R308W | Q08357 | protein_coding | deleterious(0.01) | possibly_damaging(0.849) | TCGA-MY-A5BD-01 | Cervix | cervical & endocervical cancer | Female | <65 | I/II | Chemotherapy | cisplatin | CR |
| SLC20A2 | SNV | Missense_Mutation | novel | c.1169C>T | p.Thr390Ile | p.T390I | Q08357 | protein_coding | deleterious(0.03) | probably_damaging(0.991) | TCGA-UC-A7PG-06 | Cervix | cervical & endocervical cancer | Female | <65 | III/IV | Chemotherapy | cisplatin | PD |
| SLC20A2 | SNV | Missense_Mutation | novel | c.1242G>C | p.Glu414Asp | p.E414D | Q08357 | protein_coding | tolerated(0.13) | benign(0.174) | TCGA-WL-A834-01 | Cervix | cervical & endocervical cancer | Female | <65 | I/II | Chemotherapy | paclitaxel | SD |
| SLC20A2 | SNV | Missense_Mutation | rs376447185 | c.1850N>A | p.Arg617His | p.R617H | Q08357 | protein_coding | tolerated(0.23) | benign(0.015) | TCGA-AA-3947-01 | Colorectum | colon adenocarcinoma | Female | <65 | I/II | Unknown | Unknown | SD |
| SLC20A2 | SNV | Missense_Mutation | rs387906652 | c.1802N>T | p.Ser601Leu | p.S601L | Q08357 | protein_coding | deleterious(0) | probably_damaging(0.942) | TCGA-AY-A69D-01 | Colorectum | colon adenocarcinoma | Female | <65 | I/II | Unknown | Unknown | SD |
| Page: 1 2 3 4 5 6 7 8 |
Top |
Related drugs of malignant transformation related genes |
| Identification of chemicals and drugs interact with genes involved in malignant transfromation |
| (DGIdb 4.0) |
| Entrez ID | Symbol | Category | Interaction Types | Drug Claim Name | Drug Name | PMIDs |
| Page: 1 |

Copyright 2023-Present -The University of Texas Health Science Center at Houston |