Schematic overview of the cellular and molecular mechanisms involved in the cancer progression, including the proposed cellular and molecular mechanisms in cancer cells trajectory. AT1: alveolar type 1 cells; AT2: alveolar type 2 cells; AAH: atypical adenomatous hyperplasia; AIS: adenocarcinoma in situ; MIA: minimally invasive adenocarcinoma; IA: invasive adenocarcinoma; EMT: epithelial-mesenchymal transition

Home

Download

Statistics

Help

Contact

Center for Computational Systems Medicine
leaf

Gene summary

leaf

Malignant transformation analysis

leaf

Malignant transformation related pathway analysis

leaf

Cell-cell communication analysis

leaf

Single-cell gene regulatory network inference analysis

leaf

Somatic mutation of malignant transformation related genes

leaf

Related drugs of malignant transformation related genes

Gene: SLC20A1

Gene summary for SLC20A1

check button Gene summary.

Gene informationSpeciesHuman
Gene symbol

SLC20A1

Gene ID

6574

Gene namesolute carrier family 20 member 1
Gene AliasGLVR1
Cytomap2q14.1
Gene Typeprotein-coding
GO ID

GO:0006793

UniProtAcc

A7LNJ1


Top

Malignant transformation analysis

check button Identification of the aberrant gene expression in precancerous and cancerous lesions by comparing the gene expression of stem-like cells in diseased tissues with normal stem cells
check button Malignant transformation involving gene list.
Entrez IDSymbolReplicatesSpeciesOrganTissueAdj P-valueLog2FCMalignancy
6574SLC20A1HTA11_3410_2000001011HumanColorectumAD6.48e-04-2.24e-010.0155
6574SLC20A1HTA11_866_3004761011HumanColorectumAD7.37e-03-2.22e-010.096
6574SLC20A1A015-C-203HumanColorectumFAP1.41e-02-9.17e-03-0.1294
6574SLC20A1A002-C-205HumanColorectumFAP1.33e-02-1.04e-01-0.1236
6574SLC20A1A002-C-114HumanColorectumFAP1.73e-02-1.79e-01-0.1561
6574SLC20A1F072BHumanColorectumFAP1.56e-02-2.03e-010.257
6574SLC20A1LZE4THumanEsophagusESCC2.02e-021.10e-010.0811
6574SLC20A1LZE5THumanEsophagusESCC4.16e-058.91e-020.0514
6574SLC20A1LZE7THumanEsophagusESCC2.44e-033.94e-010.0667
6574SLC20A1LZE8THumanEsophagusESCC6.50e-12-3.84e-010.067
6574SLC20A1LZE20THumanEsophagusESCC3.60e-05-8.03e-020.0662
6574SLC20A1LZE22THumanEsophagusESCC1.85e-02-4.42e-020.068
6574SLC20A1LZE24THumanEsophagusESCC6.32e-088.28e-020.0596
6574SLC20A1LZE21THumanEsophagusESCC1.78e-031.53e-010.0655
6574SLC20A1P1T-EHumanEsophagusESCC2.77e-024.37e-010.0875
6574SLC20A1P2T-EHumanEsophagusESCC1.05e-31-3.33e-010.1177
6574SLC20A1P4T-EHumanEsophagusESCC7.18e-155.71e-010.1323
6574SLC20A1P5T-EHumanEsophagusESCC9.57e-097.69e-020.1327
6574SLC20A1P8T-EHumanEsophagusESCC1.71e-06-1.33e-010.0889
6574SLC20A1P9T-EHumanEsophagusESCC1.20e-114.09e-010.1131
Page: 1 2 3 4 5 6 7 

check button Transcriptomic changes along malignancy continuum.
TissueExpression DynamicsAbbreviation
Colorectum (GSE201348)The image shows the transcriptomic changes along malignancy continuum.log2FC in expression of this searched gene in stem-like cells from each diseased tissue sample relative to stem-like cells in normal samples in each tissue plotted against the malignancy continuum. Samples are colored based on if they are from different disease stage.FAP: Familial adenomatous polyposis
CRC: Colorectal cancer
Colorectum (HTA11)The image shows the transcriptomic changes along malignancy continuum.log2FC in expression of this searched gene in stem-like cells from each diseased tissue sample relative to stem-like cells in normal samples in each tissue plotted against the malignancy continuum. Samples are colored based on if they are from different disease stage.AD: Adenomas
SER: Sessile serrated lesions
MSI-H: Microsatellite-high colorectal cancer
MSS: Microsatellite stable colorectal cancer
EsophagusThe image shows the transcriptomic changes along malignancy continuum.log2FC in expression of this searched gene in stem-like cells from each diseased tissue sample relative to stem-like cells in normal samples in each tissue plotted against the malignancy continuum. Samples are colored based on if they are from different disease stage.
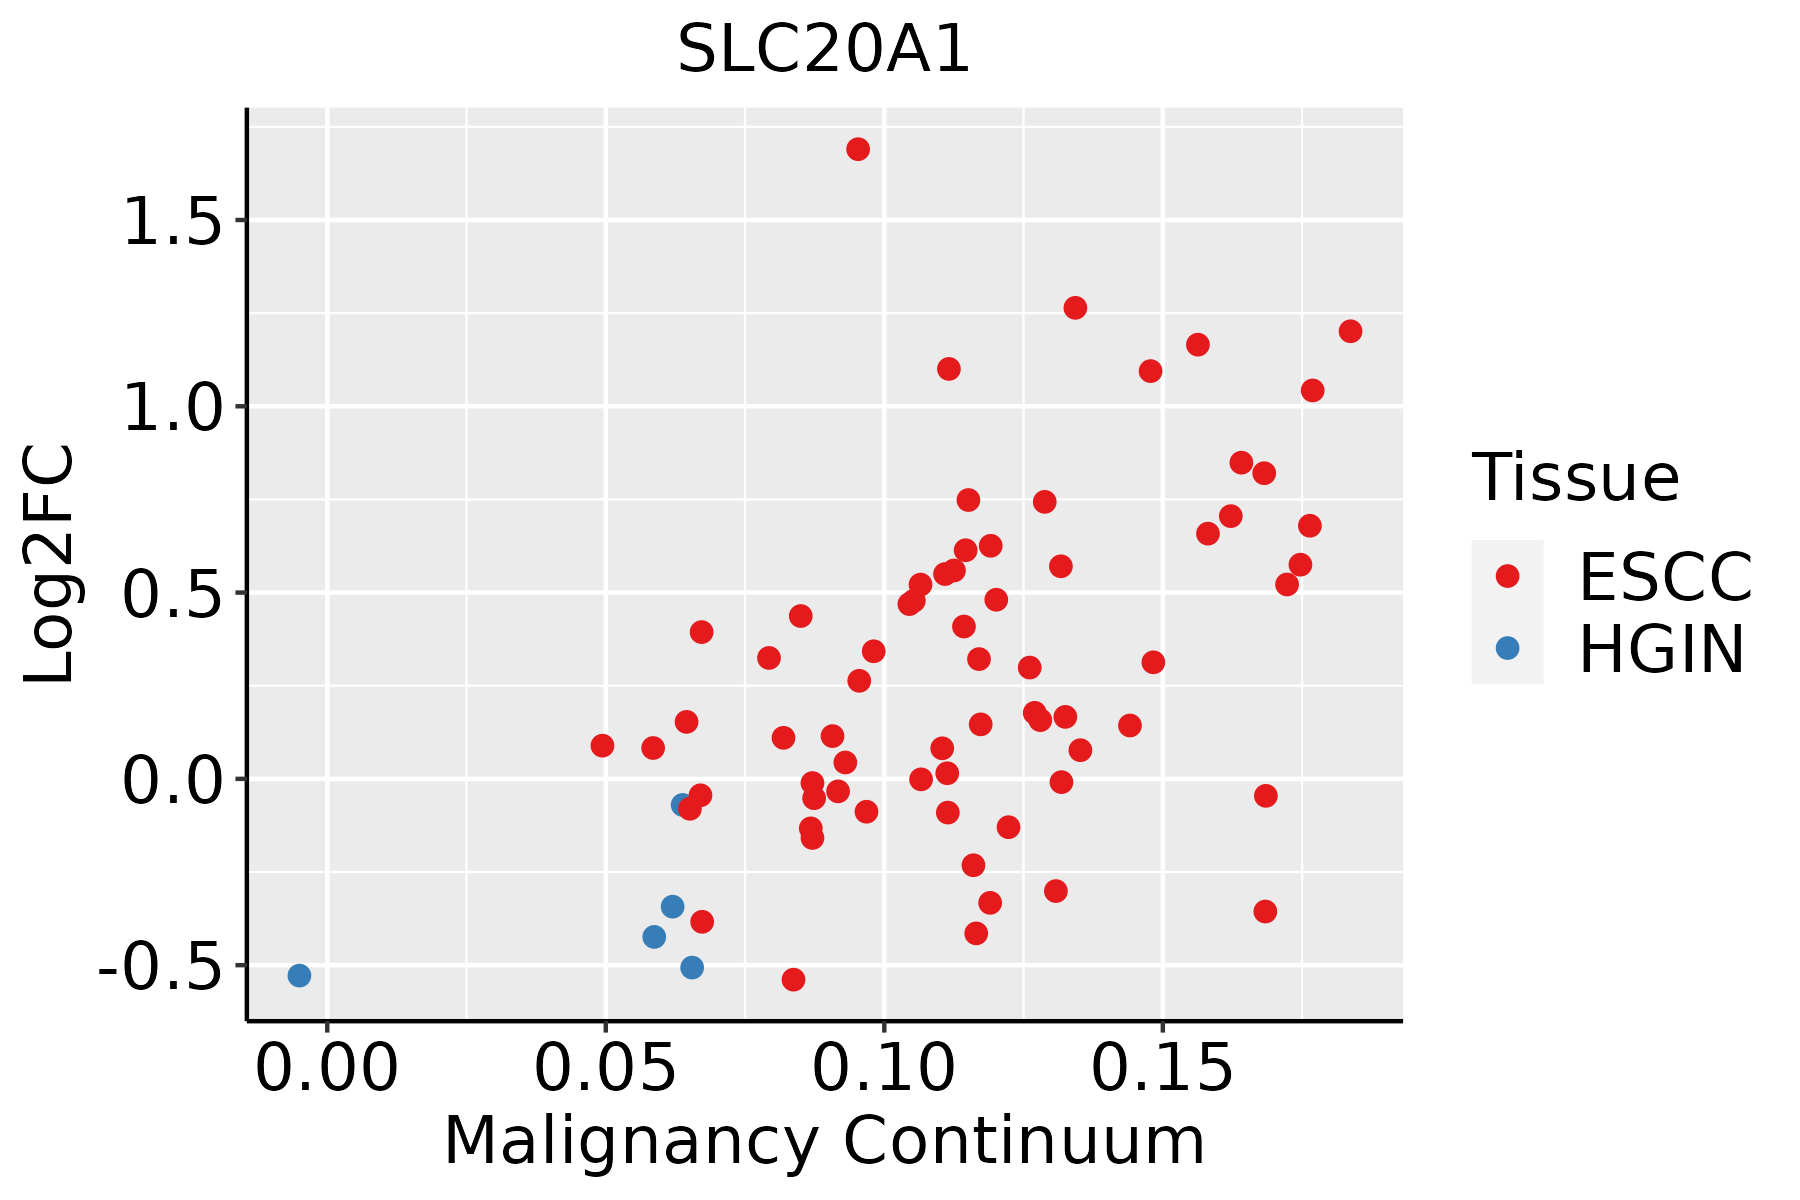
ESCC: Esophageal squamous cell carcinoma
HGIN: High-grade intraepithelial neoplasias
LGIN: Low-grade intraepithelial neoplasias
LiverThe image shows the transcriptomic changes along malignancy continuum.log2FC in expression of this searched gene in stem-like cells from each diseased tissue sample relative to stem-like cells in normal samples in each tissue plotted against the malignancy continuum. Samples are colored based on if they are from different disease stage.HCC: Hepatocellular carcinoma
NAFLD: Non-alcoholic fatty liver disease
LungThe image shows the transcriptomic changes along malignancy continuum.log2FC in expression of this searched gene in stem-like cells from each diseased tissue sample relative to stem-like cells in normal samples in each tissue plotted against the malignancy continuum. Samples are colored based on if they are from different disease stage.
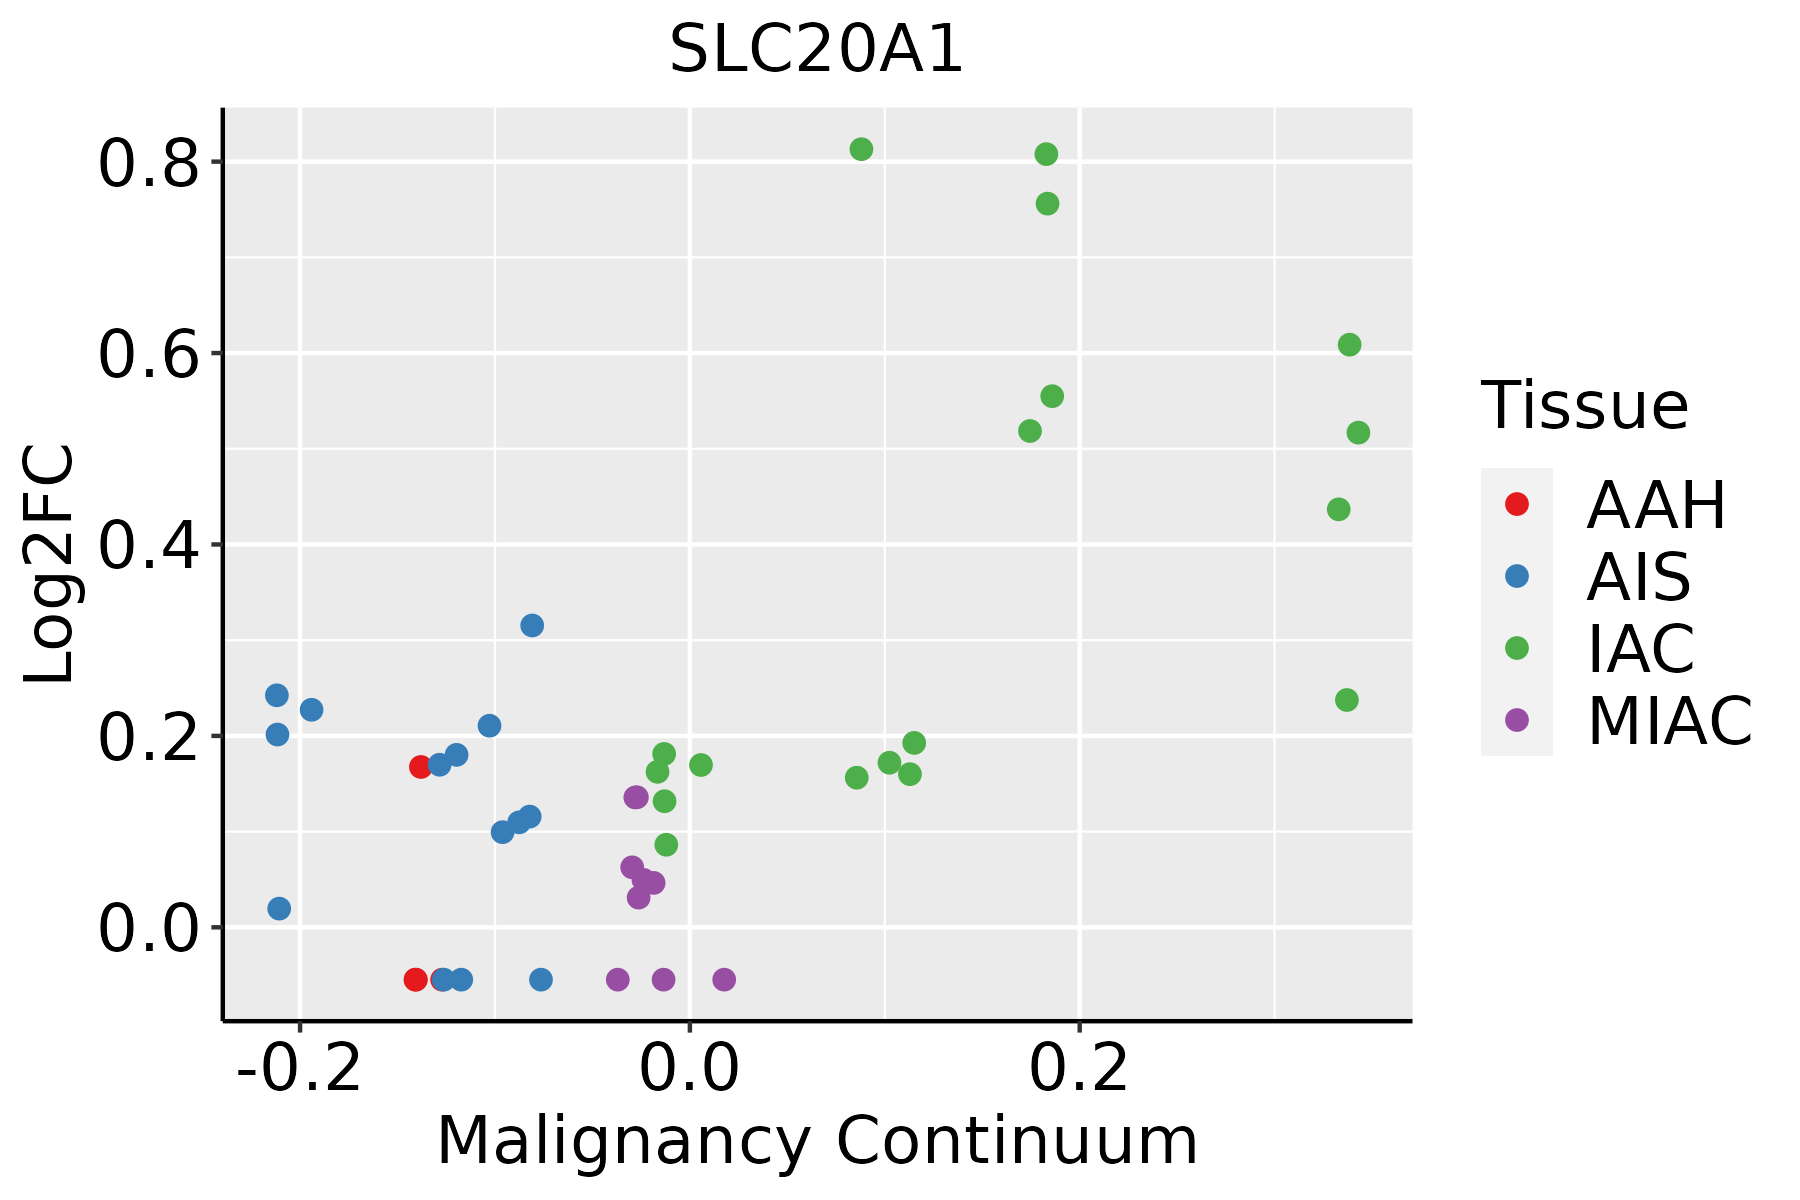
AAH: Atypical adenomatous hyperplasia
AIS: Adenocarcinoma in situ
IAC: Invasive lung adenocarcinoma
MIA: Minimally invasive adenocarcinoma
Oral CavityThe image shows the transcriptomic changes along malignancy continuum.log2FC in expression of this searched gene in stem-like cells from each diseased tissue sample relative to stem-like cells in normal samples in each tissue plotted against the malignancy continuum. Samples are colored based on if they are from different disease stage.
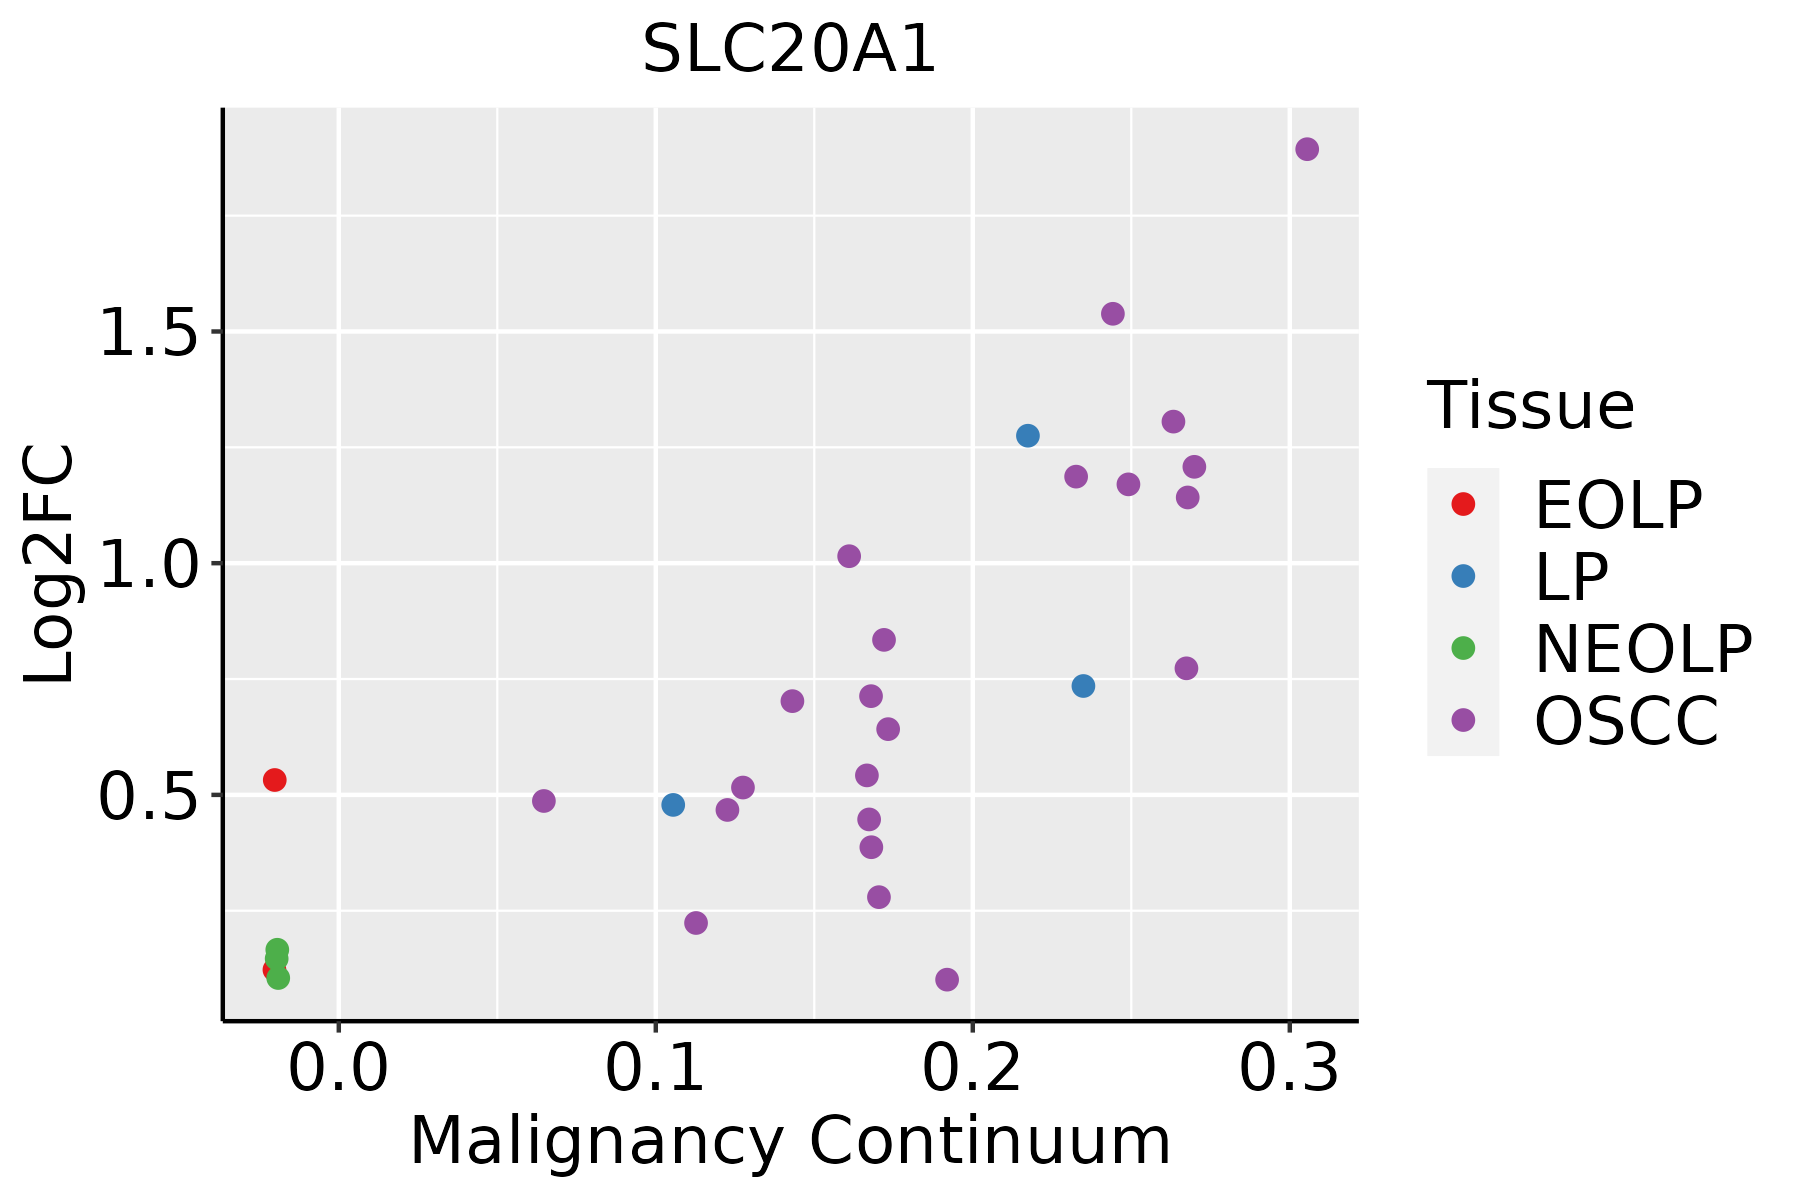
EOLP: Erosive Oral lichen planus
LP: leukoplakia
NEOLP: Non-erosive oral lichen planus
OSCC: Oral squamous cell carcinoma
SkinThe image shows the transcriptomic changes along malignancy continuum.log2FC in expression of this searched gene in stem-like cells from each diseased tissue sample relative to stem-like cells in normal samples in each tissue plotted against the malignancy continuum. Samples are colored based on if they are from different disease stage.
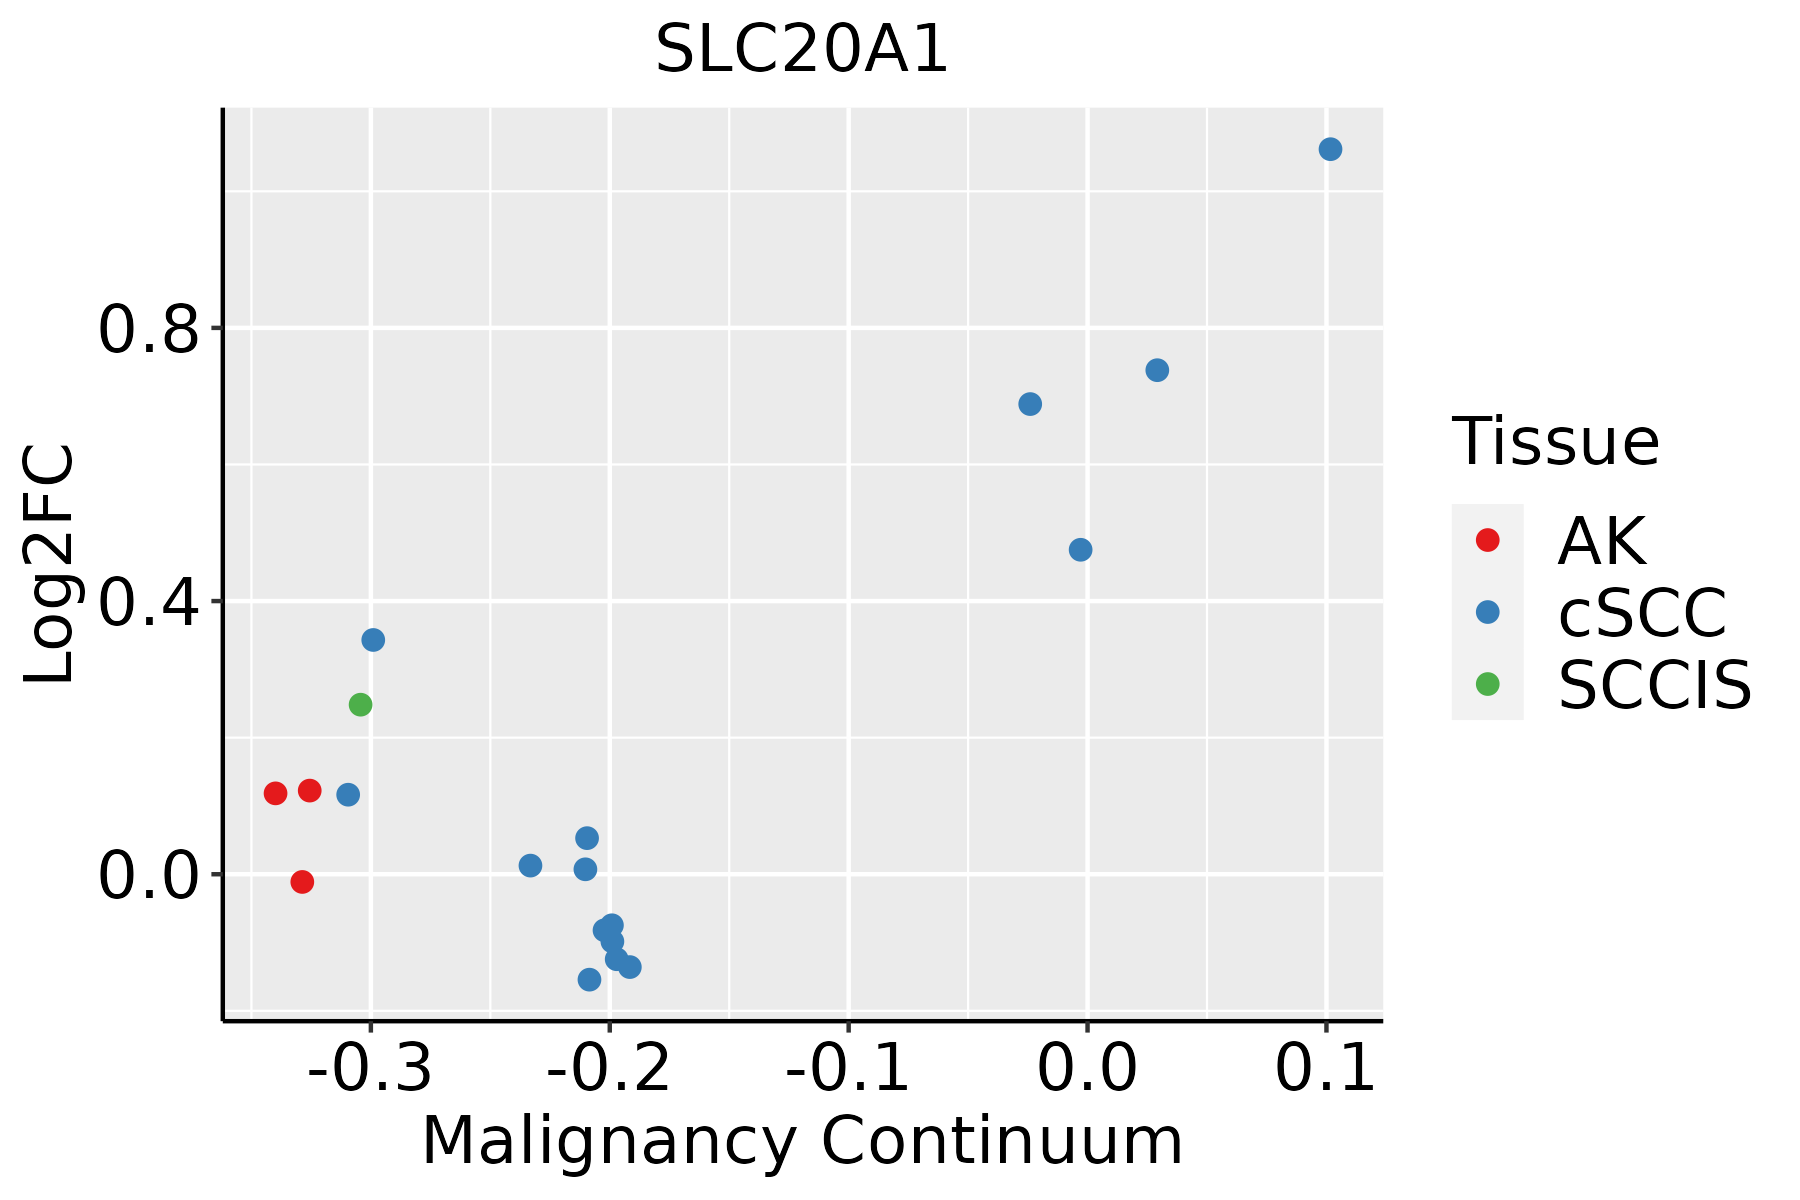
AK: Actinic keratosis
cSCC: Cutaneous squamous cell carcinoma
SCCIS:squamous cell carcinoma in situ
ThyroidThe image shows the transcriptomic changes along malignancy continuum.log2FC in expression of this searched gene in stem-like cells from each diseased tissue sample relative to stem-like cells in normal samples in each tissue plotted against the malignancy continuum. Samples are colored based on if they are from different disease stage.
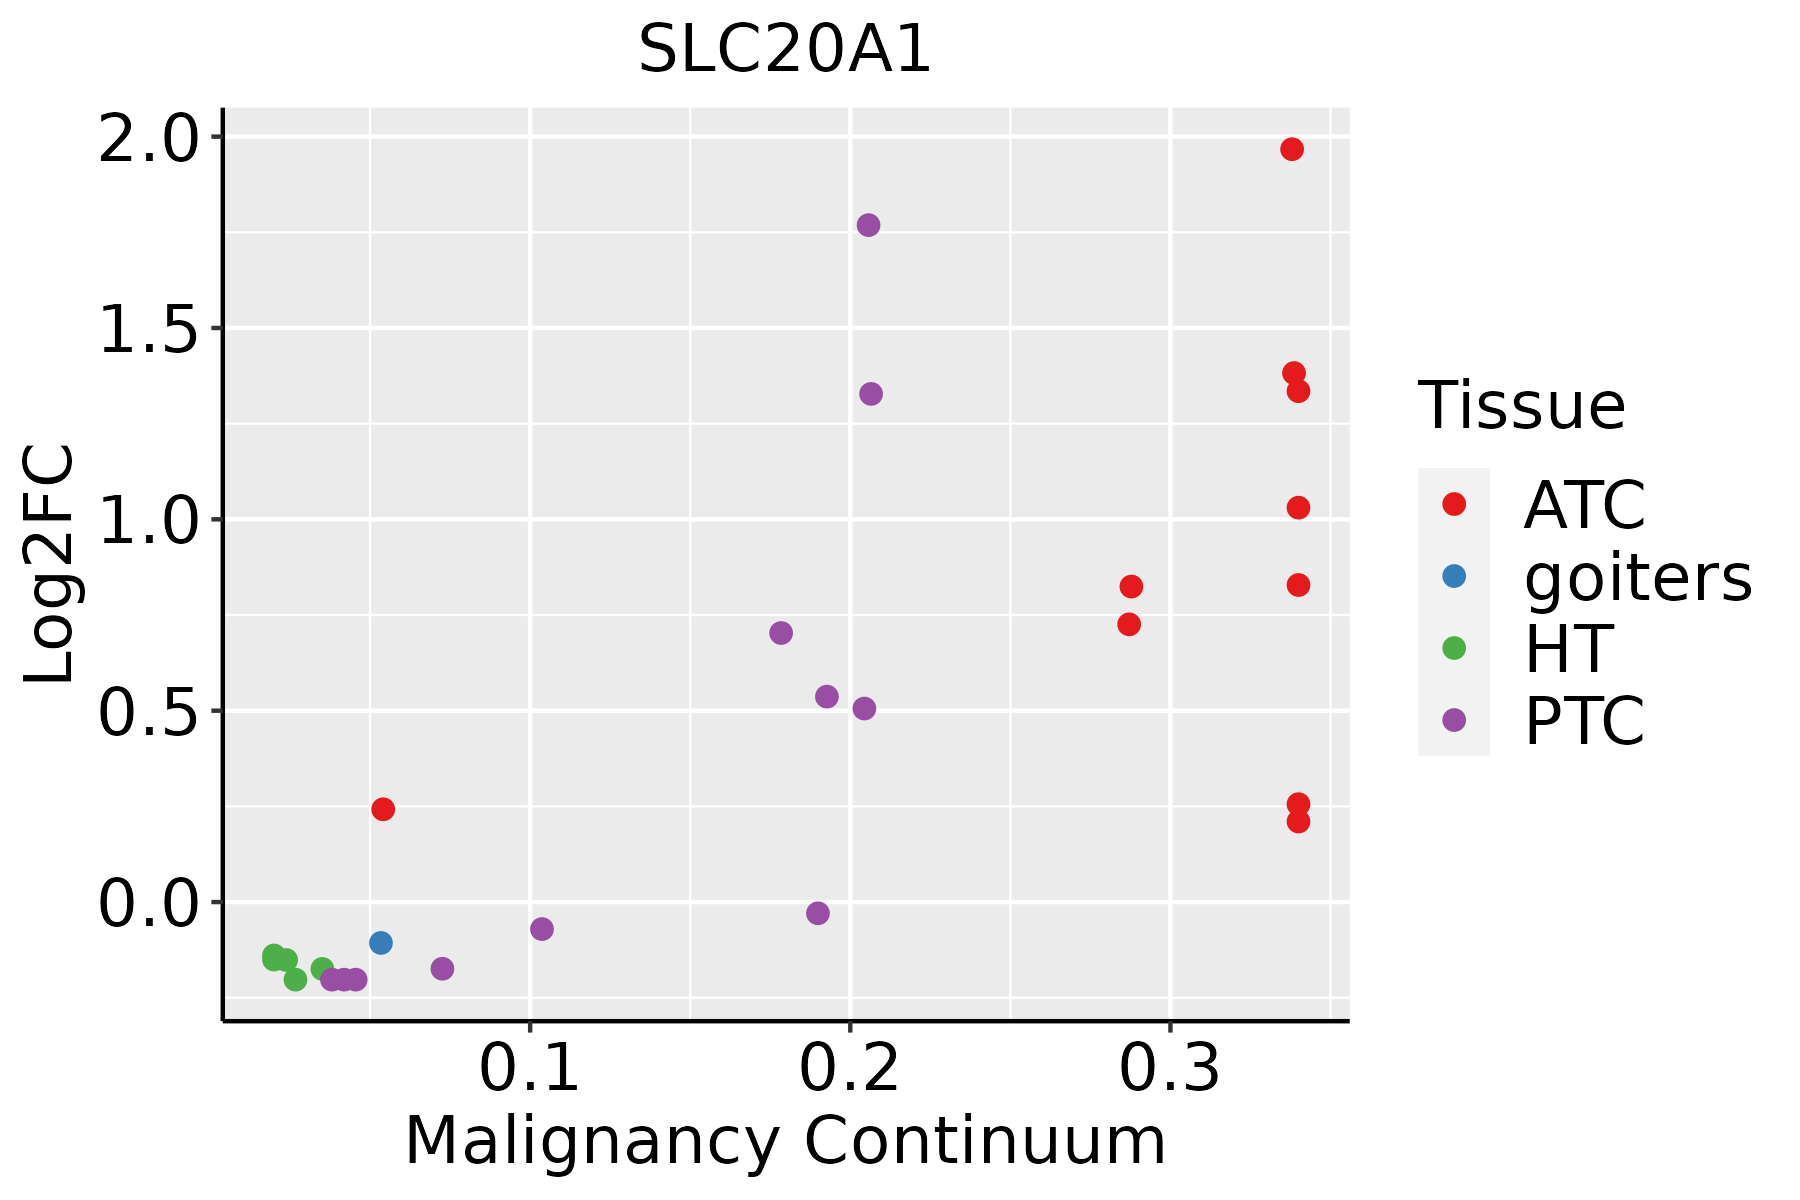
ATC: Anaplastic thyroid cancer
HT: Hashimoto's thyroiditis
PTC: Papillary thyroid cancer
∗log2FC in expression of this searched gene in stem-like cells from each diseased tissue sample relative to stem-like cells in normal samples in each tissue plotted against the malignancy continuum. Samples are colored based on if they are from different disease stage.

Top

Malignant transformation related pathway analysis

check buttonFind out the enriched GO biological processes and KEGG pathways involved in transition from healthy to precancer to cancer
check button Figure of enriched GO biological processes.
TissueDisease StageEnriched GO biological Processes
ColorectumADGO analysis - Figure of enriched GO biological processes: Top 15 enriched GO BP terms are showed in the bar plot of each disease state in each tissue. Each row represents a significant GO biological process which is colored according to the -log10(p.adjust).
ColorectumSERGO analysis - Figure of enriched GO biological processes: Top 15 enriched GO BP terms are showed in the bar plot of each disease state in each tissue. Each row represents a significant GO biological process which is colored according to the -log10(p.adjust).
ColorectumMSSGO analysis - Figure of enriched GO biological processes: Top 15 enriched GO BP terms are showed in the bar plot of each disease state in each tissue. Each row represents a significant GO biological process which is colored according to the -log10(p.adjust).
ColorectumMSI-HGO analysis - Figure of enriched GO biological processes: Top 15 enriched GO BP terms are showed in the bar plot of each disease state in each tissue. Each row represents a significant GO biological process which is colored according to the -log10(p.adjust).
ColorectumFAPGO analysis - Figure of enriched GO biological processes: Top 15 enriched GO BP terms are showed in the bar plot of each disease state in each tissue. Each row represents a significant GO biological process which is colored according to the -log10(p.adjust).
∗Top 15 enriched GO BP terms are showed in the bar plot of each disease state in each tissue. Each row represents a significant GO biological process which is colored according to the -log10(p.adjust).
Page: 1 2 3 4 5 6 7 8 9 

check button Enriched GO biological processes.
GO IDTissueDisease StageDescriptionGene RatioBg Ratiopvaluep.adjustCount
GO:0043123ColorectumADpositive regulation of I-kappaB kinase/NF-kappaB signaling60/3918186/187231.91e-042.56e-0360
GO:0043122ColorectumADregulation of I-kappaB kinase/NF-kappaB signaling76/3918249/187232.17e-042.85e-0376
GO:0007249ColorectumADI-kappaB kinase/NF-kappaB signaling82/3918281/187236.09e-046.40e-0382
GO:0015698ColorectumADinorganic anion transport52/3918180/187236.83e-034.22e-0252
GO:0035725ColorectumFAPsodium ion transmembrane transport44/2622178/187239.31e-051.60e-0344
GO:00431222ColorectumFAPregulation of I-kappaB kinase/NF-kappaB signaling56/2622249/187231.82e-042.69e-0356
GO:0006814ColorectumFAPsodium ion transport54/2622245/187233.98e-044.85e-0354
GO:00431232ColorectumFAPpositive regulation of I-kappaB kinase/NF-kappaB signaling42/2622186/187231.01e-039.89e-0342
GO:00072492ColorectumFAPI-kappaB kinase/NF-kappaB signaling58/2622281/187231.37e-031.24e-0258
GO:00156981ColorectumFAPinorganic anion transport38/2622180/187235.73e-033.67e-0238
GO:004312318EsophagusESCCpositive regulation of I-kappaB kinase/NF-kappaB signaling132/8552186/187232.07e-128.58e-11132
GO:0043122110EsophagusESCCregulation of I-kappaB kinase/NF-kappaB signaling167/8552249/187236.11e-122.32e-10167
GO:000724919EsophagusESCCI-kappaB kinase/NF-kappaB signaling183/8552281/187233.02e-111.01e-09183
GO:00072494LiverCirrhoticI-kappaB kinase/NF-kappaB signaling108/4634281/187232.21e-075.64e-06108
GO:00431225LiverCirrhoticregulation of I-kappaB kinase/NF-kappaB signaling95/4634249/187231.68e-063.22e-0595
GO:00431234LiverCirrhoticpositive regulation of I-kappaB kinase/NF-kappaB signaling71/4634186/187233.20e-053.97e-0471
GO:000724912LiverHCCI-kappaB kinase/NF-kappaB signaling156/7958281/187236.66e-068.00e-05156
GO:004312312LiverHCCpositive regulation of I-kappaB kinase/NF-kappaB signaling108/7958186/187231.28e-051.43e-04108
GO:004312212LiverHCCregulation of I-kappaB kinase/NF-kappaB signaling138/7958249/187232.47e-052.58e-04138
GO:00072495LungIACI-kappaB kinase/NF-kappaB signaling56/2061281/187237.39e-062.62e-0456
Page: 1 2 3 

check button Enriched KEGG pathways.
Pathway IDTissueDisease StageDescriptionGene RatioBg Ratiopvaluep.adjustqvalueCount
Page: 1 

Top

Cell-cell communication analysis

check buttonIdentification of potential cell-cell interactions between two cell types and their ligand-receptor pairs for different disease states
LigandReceptorLRpairPathwayTissueDisease Stage
Page: 1 

Top

Single-cell gene regulatory network inference analysis

check buttonFind out the significant the regulons (TFs) and the target genes of each regulon across cell types for different disease states
TFCell TypeTissueDisease StageTarget GeneRSSRegulon Activity
∗The dot plots of a searched regulon are shown for all cell subpopulations in each disease state of each tissue based on the regulon specific score inferred using pySCENIC and by calculating the average expression.
Page: 1 

Top

Somatic mutation of malignant transformation related genes

check buttonAnnotation of somatic variants for genes involved in malignant transformation
Hugo SymbolVariant ClassVariant ClassificationdbSNP RSHGVScHGVSpHGVSp ShortSWISSPROTBIOTYPESIFTPolyPhenTumor Sample BarcodeTissueHistologySexAgeStageTherapy TypesDrugsOutcome
SLC20A1SNVMissense_Mutationrs142437239c.1603N>Ap.Val535Ilep.V535IQ8WUM9protein_codingdeleterious(0)probably_damaging(0.984)TCGA-AN-A0AK-01Breastbreast invasive carcinomaFemale>=65I/IIUnknownUnknownSD
SLC20A1SNVMissense_Mutationc.1333A>Cp.Met445Leup.M445LQ8WUM9protein_codingtolerated(0.32)benign(0.021)TCGA-AO-A03P-01Breastbreast invasive carcinomaFemale<65I/IIHormone TherapyletrozolePD
SLC20A1SNVMissense_Mutationc.340G>Tp.Ala114Serp.A114SQ8WUM9protein_codingtolerated(0.12)benign(0.192)TCGA-D8-A140-01Breastbreast invasive carcinomaFemale<65I/IIChemotherapydoxorubicin+cyclophosphamidSD
SLC20A1insertionFrame_Shift_Insnovelc.1837_1838insGTGCAGTGCAGTTGCCTAATGGGAACCTTGTCp.Ala613GlyfsTer82p.A613Gfs*82Q8WUM9protein_codingTCGA-AN-A0FN-01Breastbreast invasive carcinomaFemale<65I/IIUnknownUnknownSD
SLC20A1SNVMissense_Mutationnovelc.1676C>Tp.Ala559Valp.A559VQ8WUM9protein_codingtolerated(0.25)benign(0.02)TCGA-2W-A8YY-01Cervixcervical & endocervical cancerFemale<65I/IIChemotherapycisplatinCR
SLC20A1SNVMissense_Mutationc.779N>Ap.Arg260Glnp.R260QQ8WUM9protein_codingtolerated(0.58)benign(0.066)TCGA-DR-A0ZM-01Cervixcervical & endocervical cancerFemale<65III/IVUnspecificCisplatinSD
SLC20A1insertionNonsense_Mutationnovelc.171_172insGTTGTTTAGTp.Thr58ValfsTer3p.T58Vfs*3Q8WUM9protein_codingTCGA-DS-A1OD-01Cervixcervical & endocervical cancerFemale<65I/IIChemotherapycisplatinSD
SLC20A1SNVMissense_Mutationrs751466959c.1301G>Ap.Arg434Hisp.R434HQ8WUM9protein_codingtolerated(0.17)possibly_damaging(0.75)TCGA-AA-3864-01Colorectumcolon adenocarcinomaMale>=65I/IIUnknownUnknownSD
SLC20A1SNVMissense_Mutationc.1409N>Tp.Ala470Valp.A470VQ8WUM9protein_codingdeleterious(0.02)probably_damaging(0.98)TCGA-AA-A010-01Colorectumcolon adenocarcinomaFemale<65I/IIChemotherapyfolinicCR
SLC20A1SNVMissense_Mutationc.280A>Gp.Met94Valp.M94VQ8WUM9protein_codingtolerated(0.24)benign(0.003)TCGA-AM-5821-01Colorectumcolon adenocarcinomaFemale>=65I/IIUnknownUnknownSD
Page: 1 2 3 4 5 6 

Top

Related drugs of malignant transformation related genes

check buttonIdentification of chemicals and drugs interact with genes involved in malignant transfromation
(DGIdb 4.0)
Entrez IDSymbolCategoryInteraction TypesDrug Claim NameDrug NamePMIDs
Page: 1