
|
|||||
|
 | |
| |
| |
| |
| |
| |
|
Gene: SLC1A4 |
Gene summary for SLC1A4 |
| Gene information | Species | Human | Gene symbol | SLC1A4 | Gene ID | 6509 |
| Gene name | solute carrier family 1 member 4 | |
| Gene Alias | ASCT1 | |
| Cytomap | 2p14 | |
| Gene Type | protein-coding | GO ID | GO:0000101 | UniProtAcc | P43007 |
Top |
Malignant transformation analysis |
| Identification of the aberrant gene expression in precancerous and cancerous lesions by comparing the gene expression of stem-like cells in diseased tissues with normal stem cells |
| Entrez ID | Symbol | Replicates | Species | Organ | Tissue | Adj P-value | Log2FC | Malignancy |
| 6509 | SLC1A4 | LZE4T | Human | Esophagus | ESCC | 3.80e-04 | 9.19e-02 | 0.0811 |
| 6509 | SLC1A4 | LZE7T | Human | Esophagus | ESCC | 6.10e-05 | 2.20e-01 | 0.0667 |
| 6509 | SLC1A4 | LZE22T | Human | Esophagus | ESCC | 1.52e-03 | 2.55e-01 | 0.068 |
| 6509 | SLC1A4 | LZE21T | Human | Esophagus | ESCC | 6.73e-09 | 3.89e-01 | 0.0655 |
| 6509 | SLC1A4 | P2T-E | Human | Esophagus | ESCC | 8.22e-33 | 8.56e-01 | 0.1177 |
| 6509 | SLC1A4 | P4T-E | Human | Esophagus | ESCC | 1.93e-20 | 6.43e-01 | 0.1323 |
| 6509 | SLC1A4 | P5T-E | Human | Esophagus | ESCC | 4.05e-20 | 5.25e-01 | 0.1327 |
| 6509 | SLC1A4 | P8T-E | Human | Esophagus | ESCC | 2.41e-06 | 1.05e-01 | 0.0889 |
| 6509 | SLC1A4 | P9T-E | Human | Esophagus | ESCC | 4.13e-15 | 2.58e-01 | 0.1131 |
| 6509 | SLC1A4 | P10T-E | Human | Esophagus | ESCC | 4.81e-15 | 3.71e-01 | 0.116 |
| 6509 | SLC1A4 | P11T-E | Human | Esophagus | ESCC | 2.19e-16 | 1.03e+00 | 0.1426 |
| 6509 | SLC1A4 | P12T-E | Human | Esophagus | ESCC | 2.37e-21 | 5.80e-01 | 0.1122 |
| 6509 | SLC1A4 | P15T-E | Human | Esophagus | ESCC | 3.61e-22 | 7.64e-01 | 0.1149 |
| 6509 | SLC1A4 | P17T-E | Human | Esophagus | ESCC | 2.43e-03 | 3.75e-01 | 0.1278 |
| 6509 | SLC1A4 | P20T-E | Human | Esophagus | ESCC | 4.15e-35 | 1.17e+00 | 0.1124 |
| 6509 | SLC1A4 | P21T-E | Human | Esophagus | ESCC | 5.12e-29 | 7.78e-01 | 0.1617 |
| 6509 | SLC1A4 | P22T-E | Human | Esophagus | ESCC | 1.73e-19 | 4.75e-01 | 0.1236 |
| 6509 | SLC1A4 | P23T-E | Human | Esophagus | ESCC | 2.24e-08 | 5.61e-01 | 0.108 |
| 6509 | SLC1A4 | P24T-E | Human | Esophagus | ESCC | 8.76e-15 | 4.24e-01 | 0.1287 |
| 6509 | SLC1A4 | P26T-E | Human | Esophagus | ESCC | 4.91e-15 | 4.21e-01 | 0.1276 |
| Page: 1 2 3 4 5 |
| Tissue | Expression Dynamics | Abbreviation |
| Esophagus |  | ESCC: Esophageal squamous cell carcinoma |
| HGIN: High-grade intraepithelial neoplasias | ||
| LGIN: Low-grade intraepithelial neoplasias | ||
| Liver | 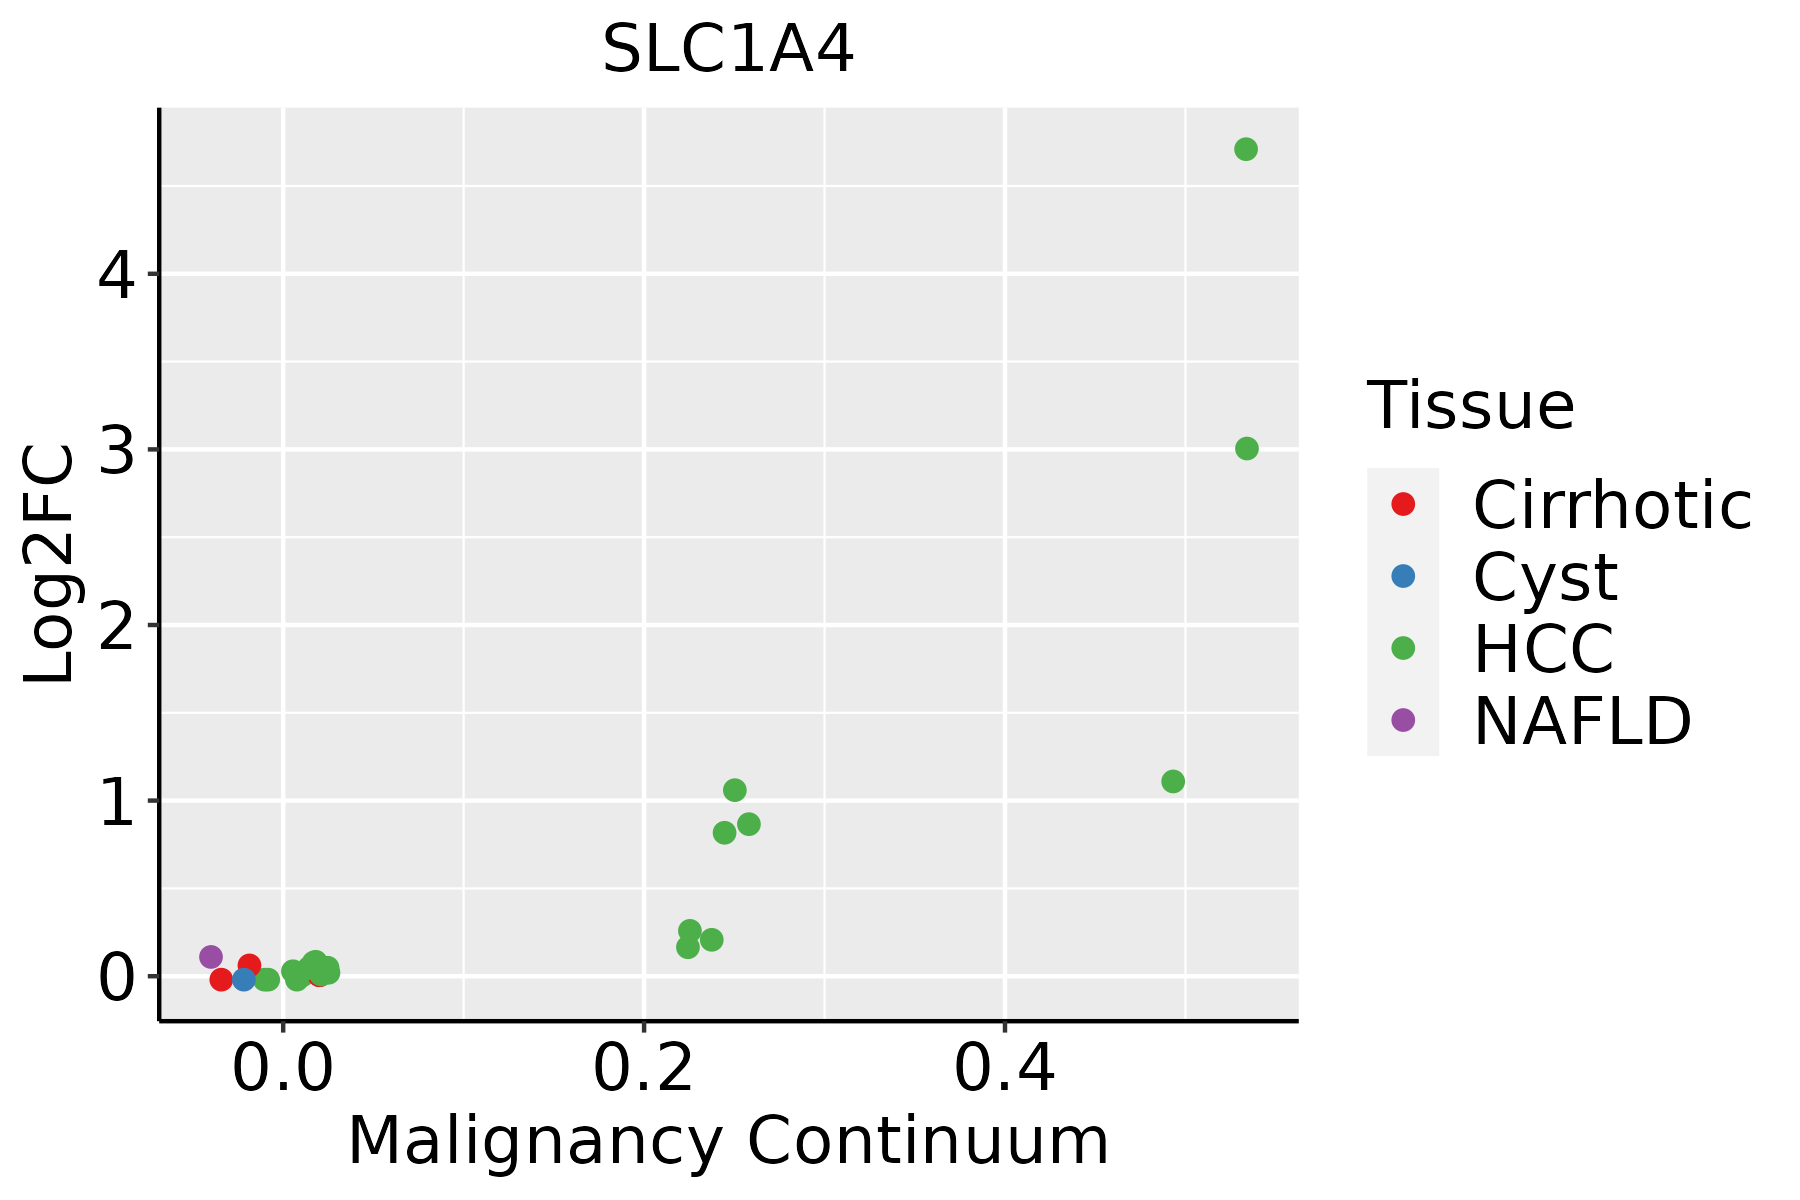 | HCC: Hepatocellular carcinoma |
| NAFLD: Non-alcoholic fatty liver disease | ||
| Oral Cavity | 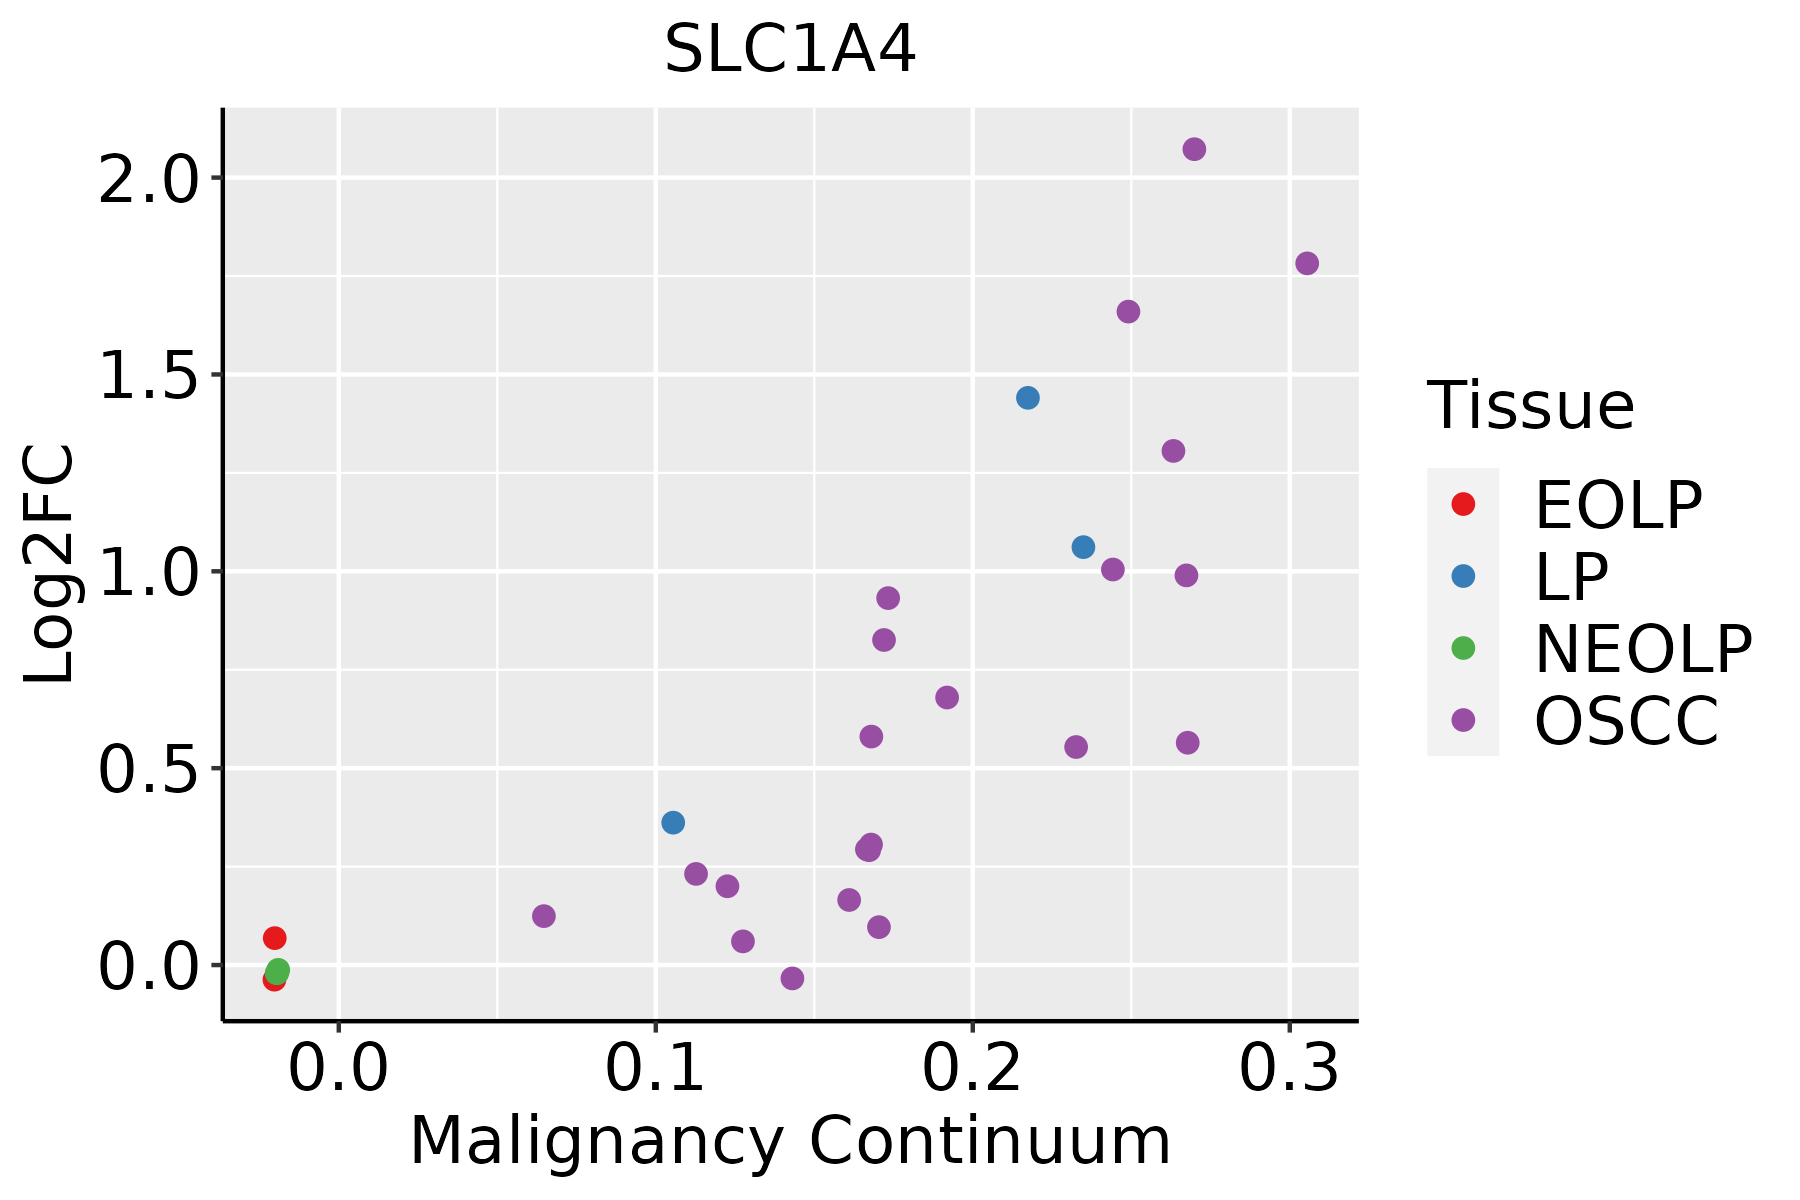 | EOLP: Erosive Oral lichen planus |
| LP: leukoplakia | ||
| NEOLP: Non-erosive oral lichen planus | ||
| OSCC: Oral squamous cell carcinoma | ||
| Skin |  | AK: Actinic keratosis |
| cSCC: Cutaneous squamous cell carcinoma | ||
| SCCIS:squamous cell carcinoma in situ |
| ∗log2FC in expression of this searched gene in stem-like cells from each diseased tissue sample relative to stem-like cells in normal samples in each tissue plotted against the malignancy continuum. Samples are colored based on if they are from different disease stage. |
Top |
Malignant transformation related pathway analysis |
| Find out the enriched GO biological processes and KEGG pathways involved in transition from healthy to precancer to cancer |
| Tissue | Disease Stage | Enriched GO biological Processes |
| Colorectum | AD |  |
| Colorectum | SER |  |
| Colorectum | MSS |  |
| Colorectum | MSI-H |  |
| Colorectum | FAP |  |
| ∗Top 15 enriched GO BP terms are showed in the bar plot of each disease state in each tissue. Each row represents a significant GO biological process which is colored according to the -log10(p.adjust). |
| Page: 1 2 3 4 5 6 7 8 9 |
| GO ID | Tissue | Disease Stage | Description | Gene Ratio | Bg Ratio | pvalue | p.adjust | Count |
| GO:015010411 | Liver | HCC | transport across blood-brain barrier | 50/7958 | 87/18723 | 3.42e-03 | 1.55e-02 | 50 |
| GO:001023211 | Liver | HCC | vascular transport | 50/7958 | 88/18723 | 4.69e-03 | 2.02e-02 | 50 |
| GO:0032329 | Oral cavity | OSCC | serine transport | 9/7305 | 11/18723 | 4.85e-03 | 1.92e-02 | 9 |
| GO:00323291 | Oral cavity | LP | serine transport | 7/4623 | 11/18723 | 7.01e-03 | 3.96e-02 | 7 |
| Page: 1 |
| Pathway ID | Tissue | Disease Stage | Description | Gene Ratio | Bg Ratio | pvalue | p.adjust | qvalue | Count |
| Page: 1 |
Top |
Cell-cell communication analysis |
| Identification of potential cell-cell interactions between two cell types and their ligand-receptor pairs for different disease states |
| Ligand | Receptor | LRpair | Pathway | Tissue | Disease Stage |
| Page: 1 |
Top |
Single-cell gene regulatory network inference analysis |
| Find out the significant the regulons (TFs) and the target genes of each regulon across cell types for different disease states |
| TF | Cell Type | Tissue | Disease Stage | Target Gene | RSS | Regulon Activity |
| ∗The dot plots of a searched regulon are shown for all cell subpopulations in each disease state of each tissue based on the regulon specific score inferred using pySCENIC and by calculating the average expression. |
| Page: 1 |
Top |
Somatic mutation of malignant transformation related genes |
| Annotation of somatic variants for genes involved in malignant transformation |
| Hugo Symbol | Variant Class | Variant Classification | dbSNP RS | HGVSc | HGVSp | HGVSp Short | SWISSPROT | BIOTYPE | SIFT | PolyPhen | Tumor Sample Barcode | Tissue | Histology | Sex | Age | Stage | Therapy Types | Drugs | Outcome |
| SLC1A4 | SNV | Missense_Mutation | novel | c.713N>C | p.Lys238Thr | p.K238T | P43007 | protein_coding | tolerated(0.07) | benign(0.309) | TCGA-OL-A5DA-01 | Breast | breast invasive carcinoma | Female | <65 | I/II | Unknown | Unknown | SD |
| SLC1A4 | insertion | Nonsense_Mutation | novel | c.752_753insTAACAATTAG | p.Ser253AsnfsTer2 | p.S253Nfs*2 | P43007 | protein_coding | TCGA-A7-A26I-01 | Breast | breast invasive carcinoma | Female | >=65 | I/II | Chemotherapy | cytoxan | SD | ||
| SLC1A4 | insertion | Frame_Shift_Ins | novel | c.1412_1413insCCTCTGCAGAGCCCGCAGAGCCAGCT | p.Gly472LeufsTer9 | p.G472Lfs*9 | P43007 | protein_coding | TCGA-B6-A0IA-01 | Breast | breast invasive carcinoma | Female | <65 | I/II | Unknown | Unknown | SD | ||
| SLC1A4 | deletion | Frame_Shift_Del | novel | c.1392delN | p.Glu465LysfsTer13 | p.E465Kfs*13 | P43007 | protein_coding | TCGA-EW-A2FV-01 | Breast | breast invasive carcinoma | Female | <65 | III/IV | Chemotherapy | docetaxel | SD | ||
| SLC1A4 | SNV | Missense_Mutation | novel | c.1310C>T | p.Ala437Val | p.A437V | P43007 | protein_coding | deleterious(0) | probably_damaging(0.971) | TCGA-2W-A8YY-01 | Cervix | cervical & endocervical cancer | Female | <65 | I/II | Chemotherapy | cisplatin | CR |
| SLC1A4 | SNV | Missense_Mutation | c.316N>A | p.Asp106Asn | p.D106N | P43007 | protein_coding | deleterious(0) | probably_damaging(0.984) | TCGA-C5-A1MK-01 | Cervix | cervical & endocervical cancer | Female | >=65 | III/IV | Chemotherapy | carboplatin | PD | |
| SLC1A4 | SNV | Missense_Mutation | rs755218346 | c.898N>A | p.Ala300Thr | p.A300T | P43007 | protein_coding | tolerated(1) | benign(0.003) | TCGA-AA-A01R-01 | Colorectum | colon adenocarcinoma | Male | <65 | III/IV | Chemotherapy | 5-fluorouracil | PD |
| SLC1A4 | SNV | Missense_Mutation | c.1375A>G | p.Thr459Ala | p.T459A | P43007 | protein_coding | tolerated(0.33) | benign(0.439) | TCGA-AU-6004-01 | Colorectum | colon adenocarcinoma | Female | >=65 | I/II | Unknown | Unknown | SD | |
| SLC1A4 | SNV | Missense_Mutation | rs760189211 | c.1129N>A | p.Val377Met | p.V377M | P43007 | protein_coding | deleterious(0) | possibly_damaging(0.904) | TCGA-AZ-6598-01 | Colorectum | colon adenocarcinoma | Female | >=65 | I/II | Unknown | Unknown | SD |
| SLC1A4 | SNV | Missense_Mutation | novel | c.1459N>A | p.Gln487Lys | p.Q487K | P43007 | protein_coding | tolerated(0.25) | benign(0.003) | TCGA-CA-6717-01 | Colorectum | colon adenocarcinoma | Male | <65 | I/II | Chemotherapy | oxaliplatin | CR |
| Page: 1 2 3 4 |
Top |
Related drugs of malignant transformation related genes |
| Identification of chemicals and drugs interact with genes involved in malignant transfromation |
| (DGIdb 4.0) |
| Entrez ID | Symbol | Category | Interaction Types | Drug Claim Name | Drug Name | PMIDs |
| Page: 1 |

Copyright 2023-Present -The University of Texas Health Science Center at Houston |