
|
|||||
|
 | |
| |
| |
| |
| |
| |
|
Gene: SLC1A3 |
Gene summary for SLC1A3 |
| Gene information | Species | Human | Gene symbol | SLC1A3 | Gene ID | 6507 |
| Gene name | solute carrier family 1 member 3 | |
| Gene Alias | EA6 | |
| Cytomap | 5p13.2 | |
| Gene Type | protein-coding | GO ID | GO:0000902 | UniProtAcc | P43003 |
Top |
Malignant transformation analysis |
| Identification of the aberrant gene expression in precancerous and cancerous lesions by comparing the gene expression of stem-like cells in diseased tissues with normal stem cells |
| Entrez ID | Symbol | Replicates | Species | Organ | Tissue | Adj P-value | Log2FC | Malignancy |
| 6507 | SLC1A3 | LZE8T | Human | Esophagus | ESCC | 4.38e-02 | 8.83e-02 | 0.067 |
| 6507 | SLC1A3 | P2T-E | Human | Esophagus | ESCC | 5.28e-07 | 1.74e-02 | 0.1177 |
| 6507 | SLC1A3 | P4T-E | Human | Esophagus | ESCC | 1.10e-15 | 5.38e-01 | 0.1323 |
| 6507 | SLC1A3 | P5T-E | Human | Esophagus | ESCC | 1.36e-08 | 1.11e-01 | 0.1327 |
| 6507 | SLC1A3 | P8T-E | Human | Esophagus | ESCC | 1.83e-03 | 2.74e-01 | 0.0889 |
| 6507 | SLC1A3 | P10T-E | Human | Esophagus | ESCC | 2.01e-04 | -4.13e-02 | 0.116 |
| 6507 | SLC1A3 | P11T-E | Human | Esophagus | ESCC | 8.41e-04 | 4.72e-01 | 0.1426 |
| 6507 | SLC1A3 | P12T-E | Human | Esophagus | ESCC | 1.72e-03 | 1.80e-01 | 0.1122 |
| 6507 | SLC1A3 | P15T-E | Human | Esophagus | ESCC | 1.93e-13 | 1.29e-01 | 0.1149 |
| 6507 | SLC1A3 | P16T-E | Human | Esophagus | ESCC | 2.04e-11 | 2.22e-01 | 0.1153 |
| 6507 | SLC1A3 | P20T-E | Human | Esophagus | ESCC | 2.10e-03 | 6.40e-02 | 0.1124 |
| 6507 | SLC1A3 | P21T-E | Human | Esophagus | ESCC | 1.38e-03 | 1.24e-02 | 0.1617 |
| 6507 | SLC1A3 | P23T-E | Human | Esophagus | ESCC | 1.42e-07 | 2.93e-01 | 0.108 |
| 6507 | SLC1A3 | P24T-E | Human | Esophagus | ESCC | 1.24e-02 | 2.16e-02 | 0.1287 |
| 6507 | SLC1A3 | P26T-E | Human | Esophagus | ESCC | 1.33e-19 | 3.83e-01 | 0.1276 |
| 6507 | SLC1A3 | P27T-E | Human | Esophagus | ESCC | 1.00e-17 | 3.83e-01 | 0.1055 |
| 6507 | SLC1A3 | P30T-E | Human | Esophagus | ESCC | 2.07e-11 | 5.40e-01 | 0.137 |
| 6507 | SLC1A3 | P32T-E | Human | Esophagus | ESCC | 4.87e-08 | 2.87e-01 | 0.1666 |
| 6507 | SLC1A3 | P37T-E | Human | Esophagus | ESCC | 2.45e-09 | 1.41e-01 | 0.1371 |
| 6507 | SLC1A3 | P40T-E | Human | Esophagus | ESCC | 7.99e-03 | 9.14e-02 | 0.109 |
| Page: 1 2 3 |
| Tissue | Expression Dynamics | Abbreviation |
| Esophagus | 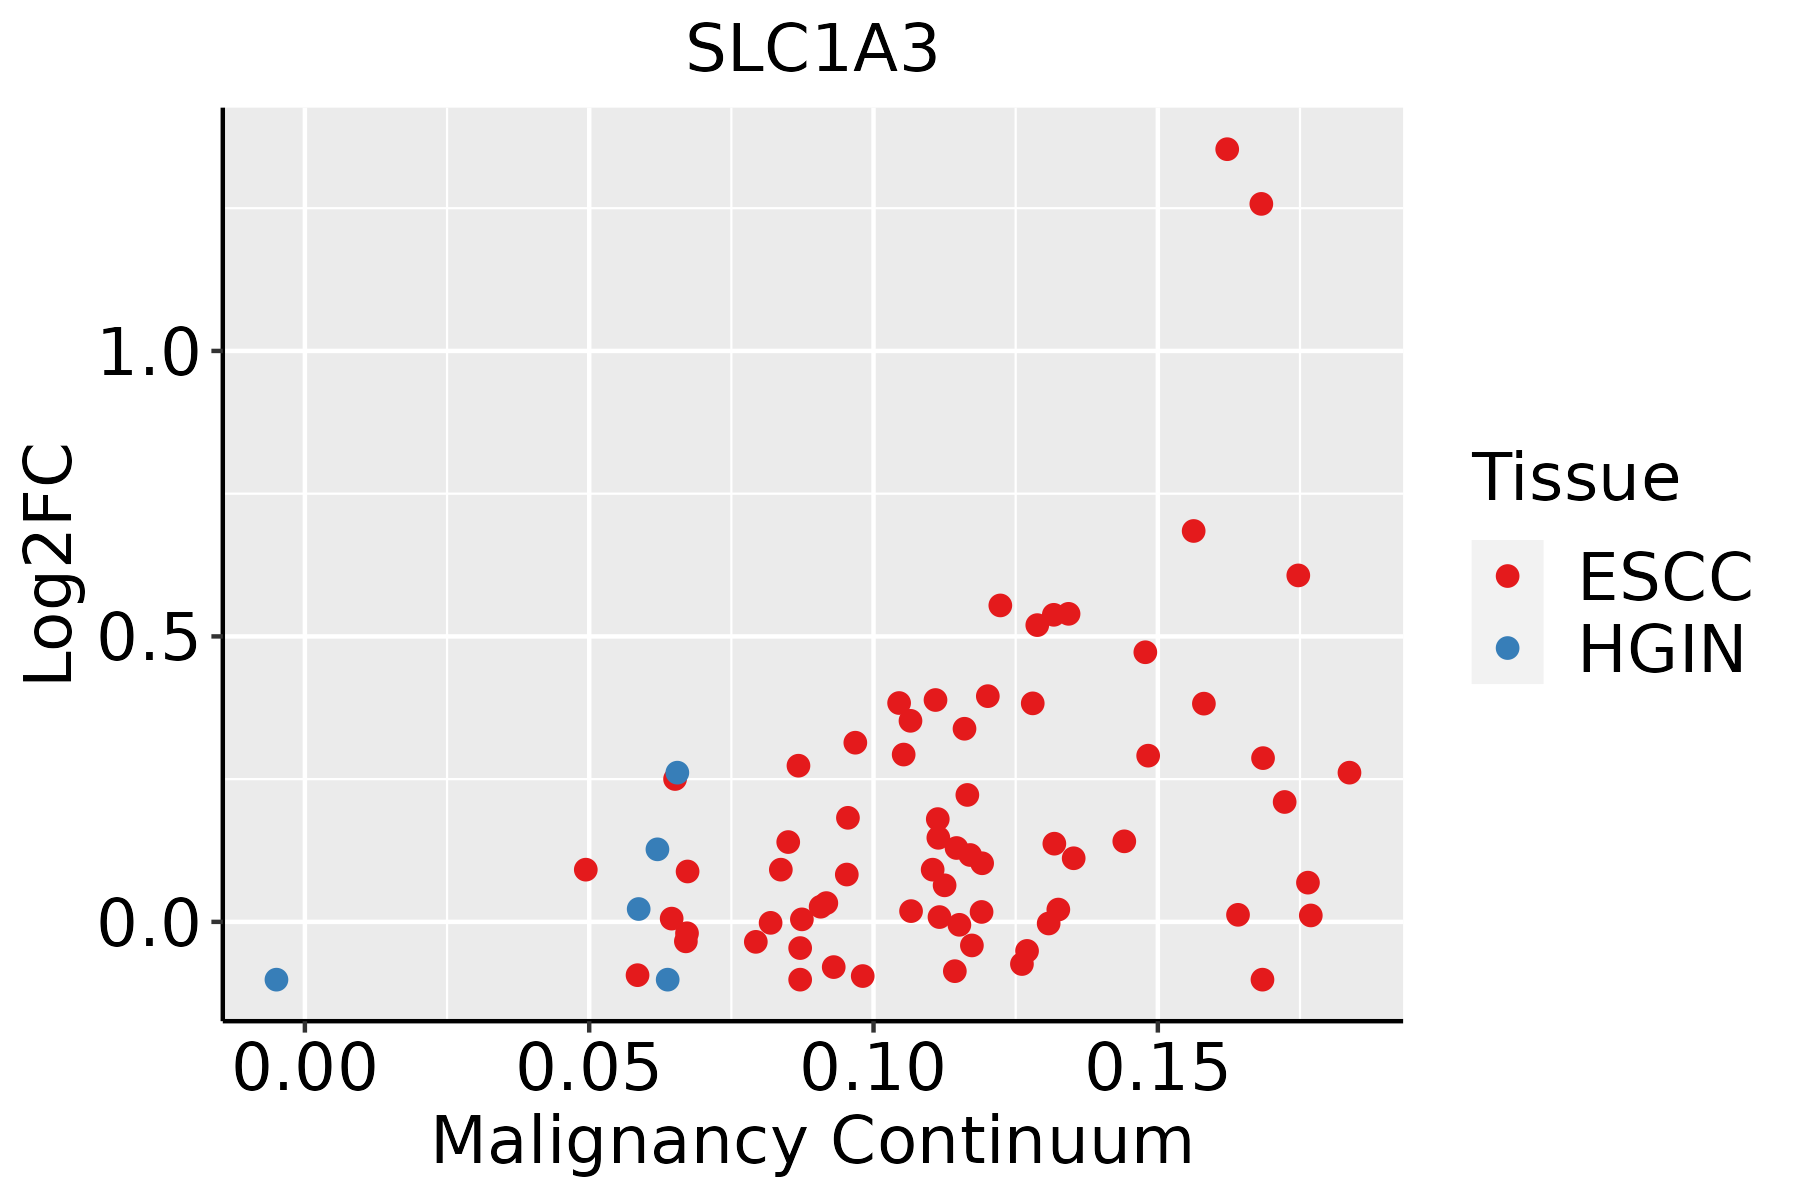 | ESCC: Esophageal squamous cell carcinoma |
| HGIN: High-grade intraepithelial neoplasias | ||
| LGIN: Low-grade intraepithelial neoplasias | ||
| Liver | 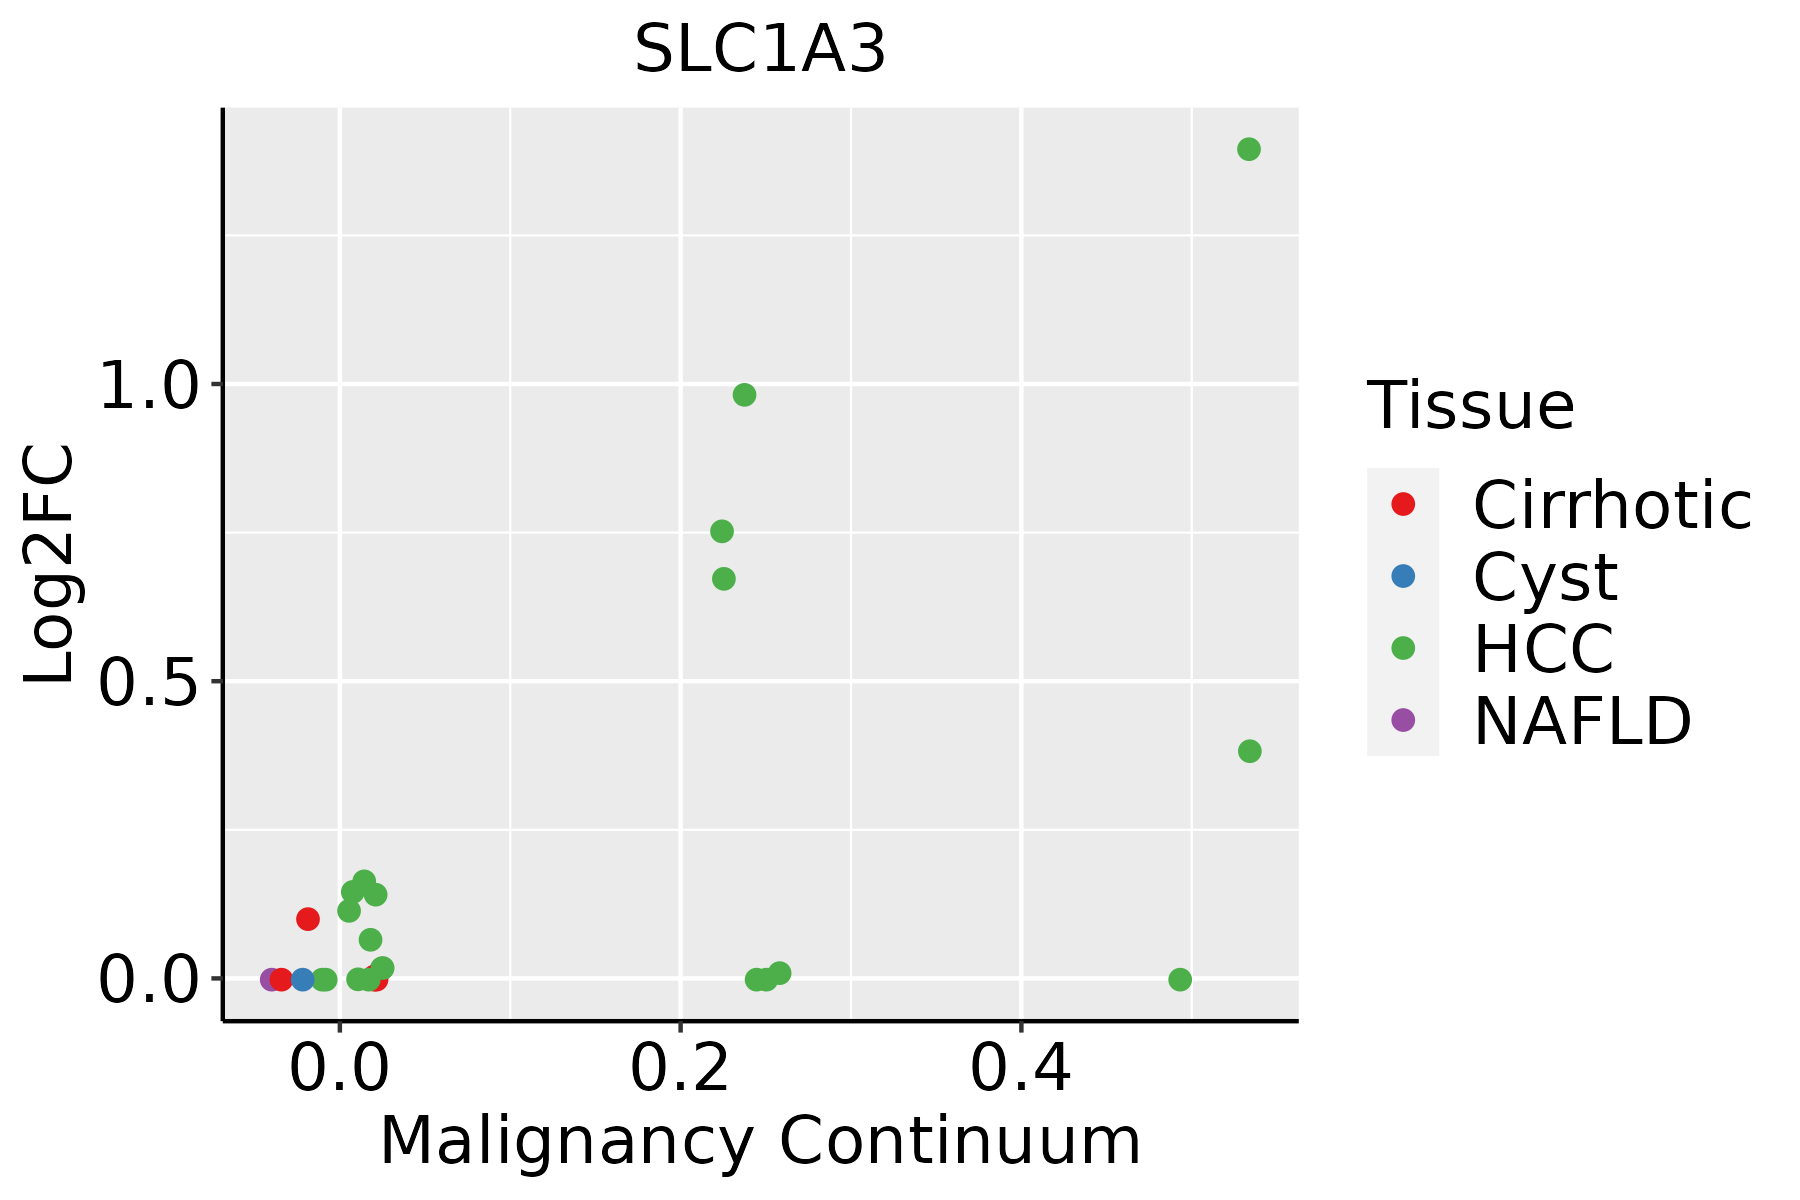 | HCC: Hepatocellular carcinoma |
| NAFLD: Non-alcoholic fatty liver disease | ||
| Oral Cavity |  | EOLP: Erosive Oral lichen planus |
| LP: leukoplakia | ||
| NEOLP: Non-erosive oral lichen planus | ||
| OSCC: Oral squamous cell carcinoma | ||
| Thyroid | 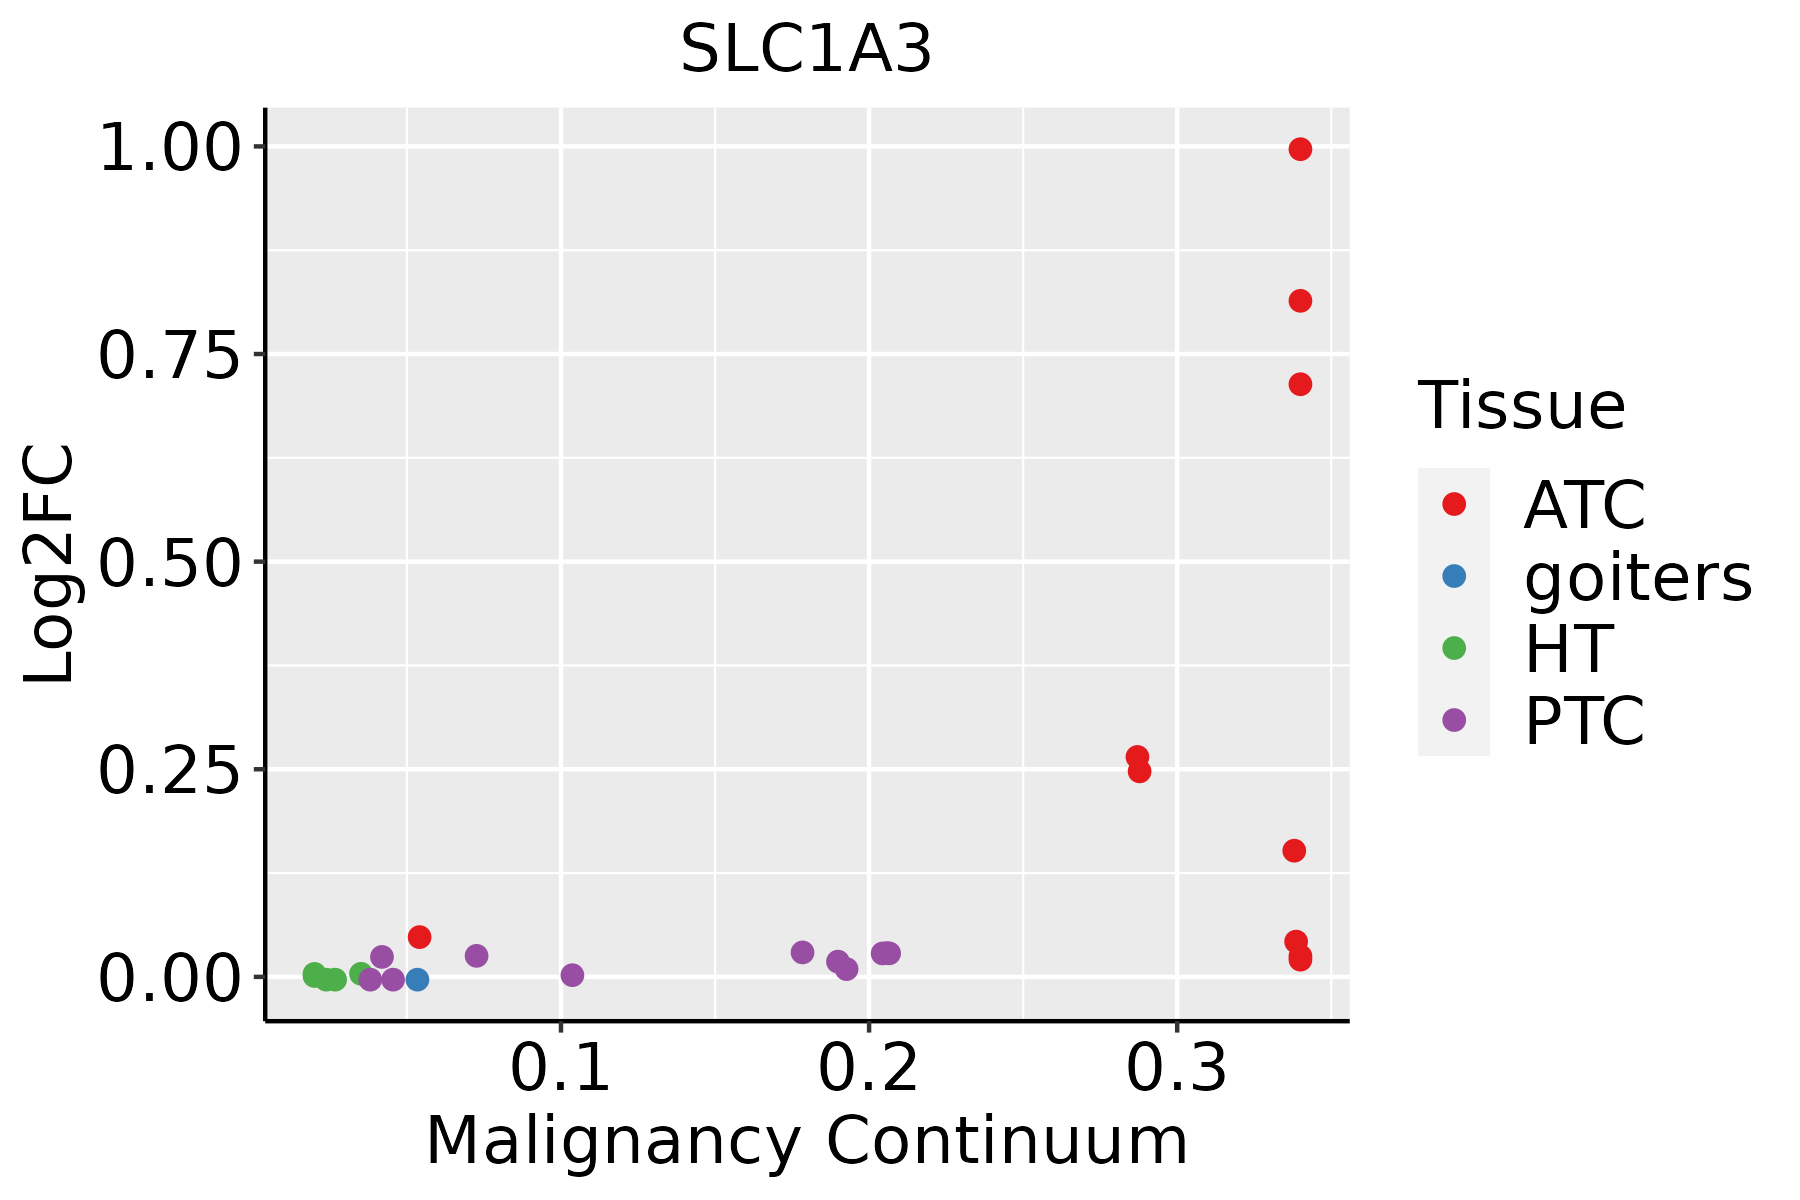 | ATC: Anaplastic thyroid cancer |
| HT: Hashimoto's thyroiditis | ||
| PTC: Papillary thyroid cancer |
| ∗log2FC in expression of this searched gene in stem-like cells from each diseased tissue sample relative to stem-like cells in normal samples in each tissue plotted against the malignancy continuum. Samples are colored based on if they are from different disease stage. |
Top |
Malignant transformation related pathway analysis |
| Find out the enriched GO biological processes and KEGG pathways involved in transition from healthy to precancer to cancer |
| Tissue | Disease Stage | Enriched GO biological Processes |
| Colorectum | AD |  |
| Colorectum | SER |  |
| Colorectum | MSS |  |
| Colorectum | MSI-H |  |
| Colorectum | FAP |  |
| ∗Top 15 enriched GO BP terms are showed in the bar plot of each disease state in each tissue. Each row represents a significant GO biological process which is colored according to the -log10(p.adjust). |
| Page: 1 2 3 4 5 6 7 8 9 |
| GO ID | Tissue | Disease Stage | Description | Gene Ratio | Bg Ratio | pvalue | p.adjust | Count |
| GO:000931419 | Esophagus | ESCC | response to radiation | 277/8552 | 456/18723 | 4.42e-11 | 1.43e-09 | 277 |
| GO:000941611 | Esophagus | ESCC | response to light stimulus | 183/8552 | 320/18723 | 2.03e-05 | 1.76e-04 | 183 |
| GO:000941020 | Esophagus | ESCC | response to xenobiotic stimulus | 253/8552 | 462/18723 | 4.55e-05 | 3.58e-04 | 253 |
| GO:00086525 | Esophagus | ESCC | cellular amino acid biosynthetic process | 51/8552 | 76/18723 | 1.30e-04 | 8.88e-04 | 51 |
| GO:00466774 | Esophagus | ESCC | response to antibiotic | 34/8552 | 47/18723 | 1.91e-04 | 1.21e-03 | 34 |
| GO:00463948 | Esophagus | ESCC | carboxylic acid biosynthetic process | 175/8552 | 314/18723 | 1.98e-04 | 1.26e-03 | 175 |
| GO:00160538 | Esophagus | ESCC | organic acid biosynthetic process | 175/8552 | 316/18723 | 3.04e-04 | 1.82e-03 | 175 |
| GO:000961216 | Esophagus | ESCC | response to mechanical stimulus | 124/8552 | 216/18723 | 3.30e-04 | 1.94e-03 | 124 |
| GO:001605321 | Liver | HCC | organic acid biosynthetic process | 200/7958 | 316/18723 | 5.24e-14 | 3.22e-12 | 200 |
| GO:004639421 | Liver | HCC | carboxylic acid biosynthetic process | 198/7958 | 314/18723 | 1.19e-13 | 6.78e-12 | 198 |
| GO:00086522 | Liver | HCC | cellular amino acid biosynthetic process | 58/7958 | 76/18723 | 1.98e-09 | 5.63e-08 | 58 |
| GO:00065202 | Liver | HCC | cellular amino acid metabolic process | 167/7958 | 284/18723 | 1.91e-08 | 4.56e-07 | 167 |
| GO:000941022 | Liver | HCC | response to xenobiotic stimulus | 248/7958 | 462/18723 | 6.47e-07 | 1.02e-05 | 248 |
| GO:00096124 | Liver | HCC | response to mechanical stimulus | 113/7958 | 216/18723 | 2.20e-03 | 1.10e-02 | 113 |
| GO:00093146 | Liver | HCC | response to radiation | 223/7958 | 456/18723 | 3.08e-03 | 1.43e-02 | 223 |
| GO:015010411 | Liver | HCC | transport across blood-brain barrier | 50/7958 | 87/18723 | 3.42e-03 | 1.55e-02 | 50 |
| GO:001023211 | Liver | HCC | vascular transport | 50/7958 | 88/18723 | 4.69e-03 | 2.02e-02 | 50 |
| GO:00432791 | Liver | HCC | response to alkaloid | 62/7958 | 115/18723 | 8.79e-03 | 3.42e-02 | 62 |
| GO:000931416 | Oral cavity | OSCC | response to radiation | 241/7305 | 456/18723 | 9.76e-10 | 2.40e-08 | 241 |
| GO:000961210 | Oral cavity | OSCC | response to mechanical stimulus | 115/7305 | 216/18723 | 1.43e-05 | 1.44e-04 | 115 |
| Page: 1 2 |
| Pathway ID | Tissue | Disease Stage | Description | Gene Ratio | Bg Ratio | pvalue | p.adjust | qvalue | Count |
| hsa05016210 | Esophagus | ESCC | Huntington disease | 226/4205 | 306/8465 | 1.38e-18 | 8.72e-17 | 4.46e-17 | 226 |
| hsa0501638 | Esophagus | ESCC | Huntington disease | 226/4205 | 306/8465 | 1.38e-18 | 8.72e-17 | 4.46e-17 | 226 |
| hsa0501622 | Liver | HCC | Huntington disease | 219/4020 | 306/8465 | 3.06e-18 | 3.42e-16 | 1.90e-16 | 219 |
| hsa0501632 | Liver | HCC | Huntington disease | 219/4020 | 306/8465 | 3.06e-18 | 3.42e-16 | 1.90e-16 | 219 |
| hsa0501628 | Oral cavity | OSCC | Huntington disease | 204/3704 | 306/8465 | 1.70e-16 | 7.13e-15 | 3.63e-15 | 204 |
| hsa05016112 | Oral cavity | OSCC | Huntington disease | 204/3704 | 306/8465 | 1.70e-16 | 7.13e-15 | 3.63e-15 | 204 |
| hsa0501629 | Oral cavity | LP | Huntington disease | 172/2418 | 306/8465 | 6.31e-25 | 5.25e-23 | 3.39e-23 | 172 |
| hsa0501637 | Oral cavity | LP | Huntington disease | 172/2418 | 306/8465 | 6.31e-25 | 5.25e-23 | 3.39e-23 | 172 |
| Page: 1 |
Top |
Cell-cell communication analysis |
| Identification of potential cell-cell interactions between two cell types and their ligand-receptor pairs for different disease states |
| Ligand | Receptor | LRpair | Pathway | Tissue | Disease Stage |
| Page: 1 |
Top |
Single-cell gene regulatory network inference analysis |
| Find out the significant the regulons (TFs) and the target genes of each regulon across cell types for different disease states |
| TF | Cell Type | Tissue | Disease Stage | Target Gene | RSS | Regulon Activity |
| ∗The dot plots of a searched regulon are shown for all cell subpopulations in each disease state of each tissue based on the regulon specific score inferred using pySCENIC and by calculating the average expression. |
| Page: 1 |
Top |
Somatic mutation of malignant transformation related genes |
| Annotation of somatic variants for genes involved in malignant transformation |
| Hugo Symbol | Variant Class | Variant Classification | dbSNP RS | HGVSc | HGVSp | HGVSp Short | SWISSPROT | BIOTYPE | SIFT | PolyPhen | Tumor Sample Barcode | Tissue | Histology | Sex | Age | Stage | Therapy Types | Drugs | Outcome |
| SLC1A3 | SNV | Missense_Mutation | rs781475471 | c.810N>A | p.Phe270Leu | p.F270L | P43003 | protein_coding | tolerated(0.07) | possibly_damaging(0.861) | TCGA-AN-A046-01 | Breast | breast invasive carcinoma | Female | >=65 | I/II | Unknown | Unknown | SD |
| SLC1A3 | SNV | Missense_Mutation | c.923G>T | p.Gly308Val | p.G308V | P43003 | protein_coding | tolerated(0.09) | benign(0.262) | TCGA-BH-A0GY-01 | Breast | breast invasive carcinoma | Female | >=65 | I/II | Chemotherapy | cyotxan | SD | |
| SLC1A3 | insertion | Nonsense_Mutation | novel | c.808_809insAGTTGTTTCCCAGTGGATAAGAAACTTTTCCATTAACCCTTGG | p.Phe270Ter | p.F270* | P43003 | protein_coding | TCGA-B6-A0I5-01 | Breast | breast invasive carcinoma | Female | <65 | I/II | Unknown | Unknown | SD | ||
| SLC1A3 | SNV | Missense_Mutation | novel | c.169N>T | p.Ala57Ser | p.A57S | P43003 | protein_coding | tolerated(0.33) | possibly_damaging(0.474) | TCGA-Q1-A73P-01 | Cervix | cervical & endocervical cancer | Female | <65 | I/II | Unknown | Unknown | SD |
| SLC1A3 | SNV | Missense_Mutation | novel | c.280A>G | p.Met94Val | p.M94V | P43003 | protein_coding | deleterious(0.01) | possibly_damaging(0.596) | TCGA-5M-AAT6-01 | Colorectum | colon adenocarcinoma | Female | <65 | III/IV | Unknown | Unknown | PD |
| SLC1A3 | SNV | Missense_Mutation | c.1024N>T | p.Arg342Trp | p.R342W | P43003 | protein_coding | deleterious(0) | probably_damaging(1) | TCGA-A6-6654-01 | Colorectum | colon adenocarcinoma | Female | >=65 | III/IV | Chemotherapy | oxaliplatin | SD | |
| SLC1A3 | SNV | Missense_Mutation | c.139N>T | p.Arg47Trp | p.R47W | P43003 | protein_coding | deleterious(0) | possibly_damaging(0.881) | TCGA-AA-3510-01 | Colorectum | colon adenocarcinoma | Male | >=65 | I/II | Unknown | Unknown | SD | |
| SLC1A3 | SNV | Missense_Mutation | novel | c.1021N>G | p.Thr341Ala | p.T341A | P43003 | protein_coding | deleterious(0.02) | probably_damaging(0.936) | TCGA-AA-A00N-01 | Colorectum | colon adenocarcinoma | Male | >=65 | I/II | Unknown | Unknown | PD |
| SLC1A3 | SNV | Missense_Mutation | rs199787096 | c.1144G>A | p.Val382Met | p.V382M | P43003 | protein_coding | tolerated(0.06) | probably_damaging(0.97) | TCGA-AA-A01R-01 | Colorectum | colon adenocarcinoma | Male | <65 | III/IV | Chemotherapy | 5-fluorouracil | PD |
| SLC1A3 | SNV | Missense_Mutation | c.1168G>A | p.Val390Met | p.V390M | P43003 | protein_coding | tolerated(0.08) | probably_damaging(0.986) | TCGA-AY-A69D-01 | Colorectum | colon adenocarcinoma | Female | <65 | I/II | Unknown | Unknown | SD |
| Page: 1 2 3 4 5 6 7 8 |
Top |
Related drugs of malignant transformation related genes |
| Identification of chemicals and drugs interact with genes involved in malignant transfromation |
| (DGIdb 4.0) |
| Entrez ID | Symbol | Category | Interaction Types | Drug Claim Name | Drug Name | PMIDs |
| 6507 | SLC1A3 | TRANSPORTER, DRUGGABLE GENOME, CELL SURFACE | 178101410 | |||
| 6507 | SLC1A3 | TRANSPORTER, DRUGGABLE GENOME, CELL SURFACE | inhibitor | 178101349 | ||
| 6507 | SLC1A3 | TRANSPORTER, DRUGGABLE GENOME, CELL SURFACE | 178101255 | |||
| 6507 | SLC1A3 | TRANSPORTER, DRUGGABLE GENOME, CELL SURFACE | ANTISERUM | 9068840 | ||
| 6507 | SLC1A3 | TRANSPORTER, DRUGGABLE GENOME, CELL SURFACE | inhibitor | 178101329 | ||
| 6507 | SLC1A3 | TRANSPORTER, DRUGGABLE GENOME, CELL SURFACE | 178100898 |
| Page: 1 |

Copyright 2023-Present -The University of Texas Health Science Center at Houston |