
|
|||||
|
 | |
| |
| |
| |
| |
| |
|
Gene: SLC1A2 |
Gene summary for SLC1A2 |
| Gene information | Species | Human | Gene symbol | SLC1A2 | Gene ID | 6506 |
| Gene name | solute carrier family 1 member 2 | |
| Gene Alias | DEE41 | |
| Cytomap | 11p13 | |
| Gene Type | protein-coding | GO ID | GO:0000101 | UniProtAcc | A2A2U1 |
Top |
Malignant transformation analysis |
| Identification of the aberrant gene expression in precancerous and cancerous lesions by comparing the gene expression of stem-like cells in diseased tissues with normal stem cells |
| Entrez ID | Symbol | Replicates | Species | Organ | Tissue | Adj P-value | Log2FC | Malignancy |
| 6506 | SLC1A2 | NAFLD1 | Human | Liver | NAFLD | 8.78e-06 | 5.35e-01 | -0.04 |
| 6506 | SLC1A2 | S43 | Human | Liver | Cirrhotic | 1.35e-04 | -1.92e-01 | -0.0187 |
| 6506 | SLC1A2 | S44 | Human | Liver | HCC | 3.84e-03 | 8.27e-01 | -0.0083 |
| 6506 | SLC1A2 | HCC1_Meng | Human | Liver | HCC | 1.52e-07 | -2.34e-01 | 0.0246 |
| 6506 | SLC1A2 | HCC2_Meng | Human | Liver | HCC | 2.75e-07 | -2.38e-01 | 0.0107 |
| 6506 | SLC1A2 | cirrhotic1 | Human | Liver | Cirrhotic | 4.95e-09 | -2.38e-01 | 0.0202 |
| 6506 | SLC1A2 | cirrhotic2 | Human | Liver | Cirrhotic | 4.95e-09 | -2.35e-01 | 0.0201 |
| 6506 | SLC1A2 | cirrhotic3 | Human | Liver | Cirrhotic | 5.80e-03 | -2.38e-01 | 0.0215 |
| 6506 | SLC1A2 | HCC1 | Human | Liver | HCC | 8.75e-05 | 3.34e+00 | 0.5336 |
| 6506 | SLC1A2 | Pt13.a | Human | Liver | HCC | 1.10e-05 | -2.23e-01 | 0.021 |
| 6506 | SLC1A2 | Pt13.b | Human | Liver | HCC | 3.53e-02 | -2.38e-01 | 0.0251 |
| 6506 | SLC1A2 | Pt14.d | Human | Liver | HCC | 4.47e-07 | -2.34e-01 | 0.0143 |
| Page: 1 |
| Tissue | Expression Dynamics | Abbreviation |
| Liver | 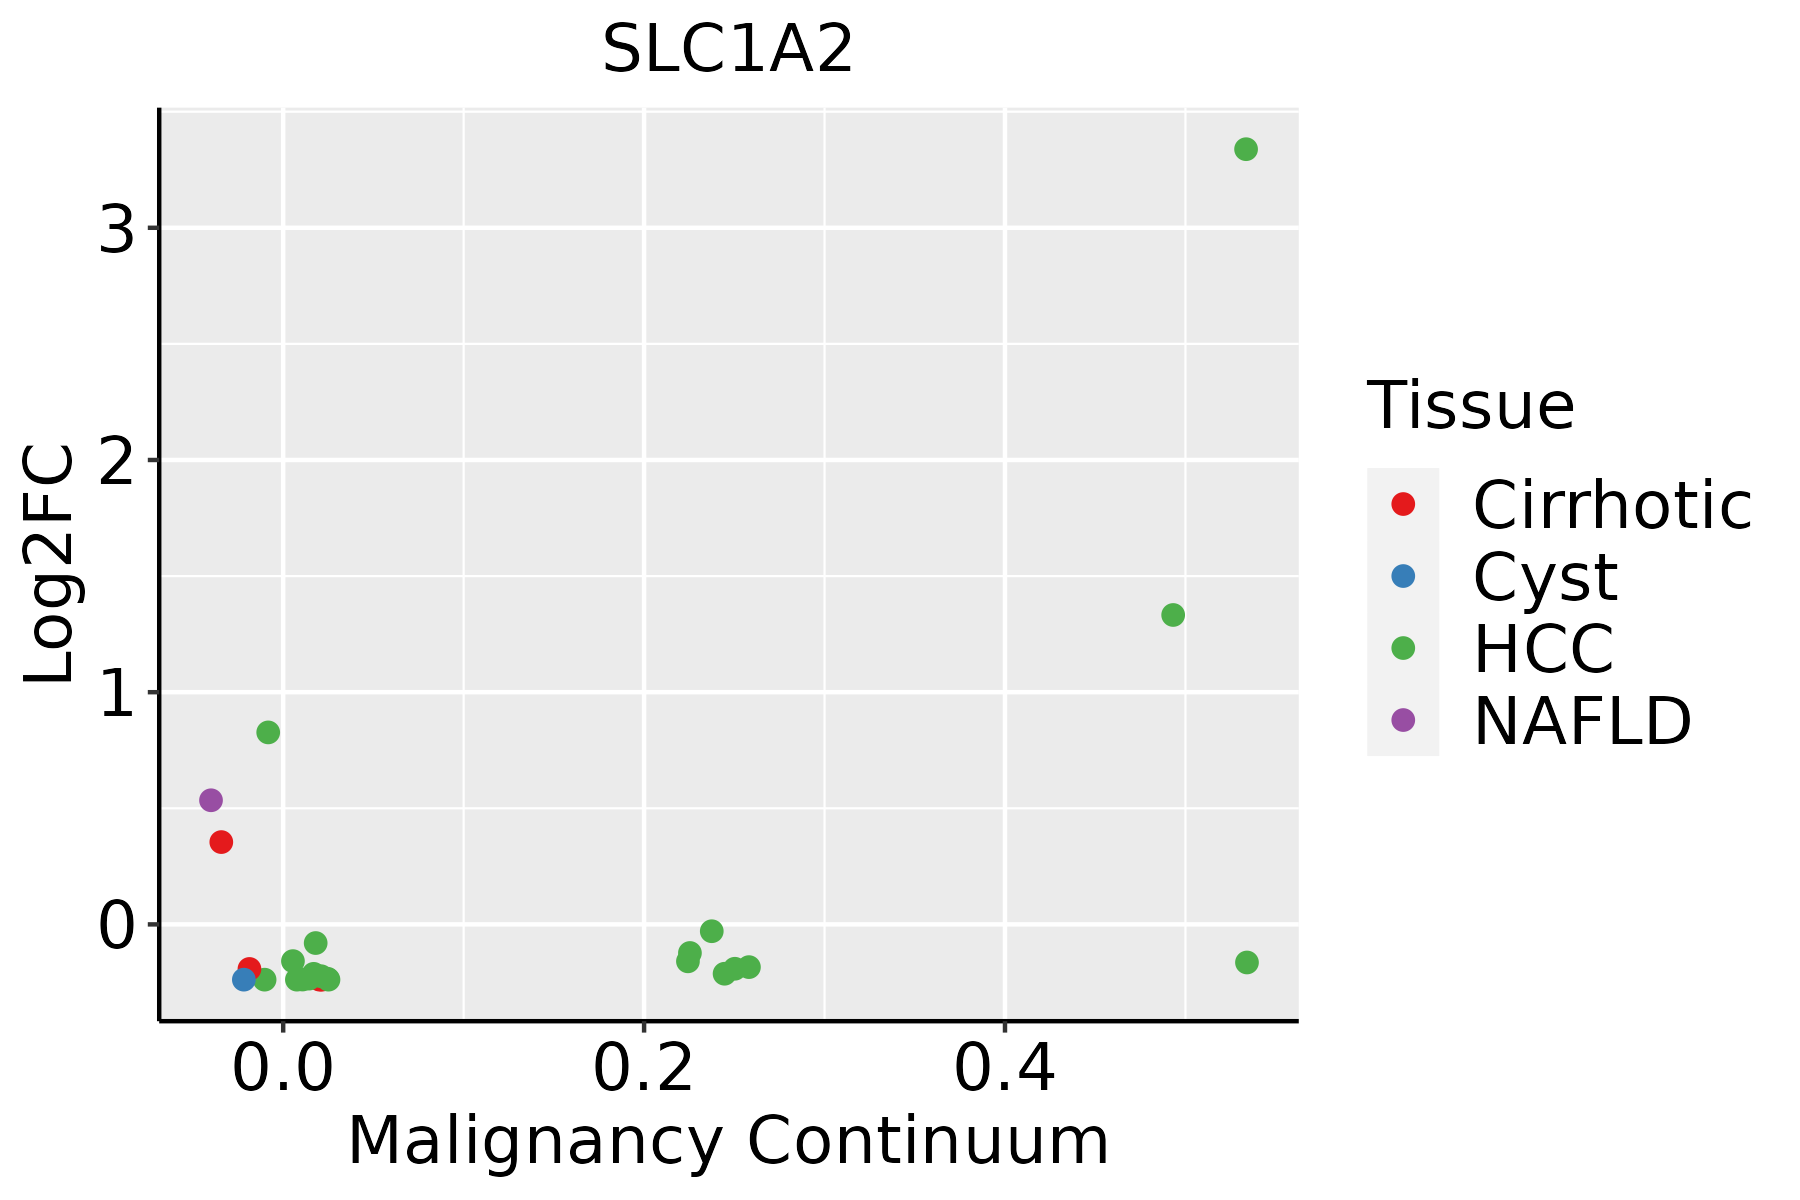 | HCC: Hepatocellular carcinoma |
| NAFLD: Non-alcoholic fatty liver disease |
| ∗log2FC in expression of this searched gene in stem-like cells from each diseased tissue sample relative to stem-like cells in normal samples in each tissue plotted against the malignancy continuum. Samples are colored based on if they are from different disease stage. |
Top |
Malignant transformation related pathway analysis |
| Find out the enriched GO biological processes and KEGG pathways involved in transition from healthy to precancer to cancer |
| Tissue | Disease Stage | Enriched GO biological Processes |
| Colorectum | AD |  |
| Colorectum | SER |  |
| Colorectum | MSS |  |
| Colorectum | MSI-H |  |
| Colorectum | FAP |  |
| ∗Top 15 enriched GO BP terms are showed in the bar plot of each disease state in each tissue. Each row represents a significant GO biological process which is colored according to the -log10(p.adjust). |
| Page: 1 2 3 4 5 6 7 8 9 |
| GO ID | Tissue | Disease Stage | Description | Gene Ratio | Bg Ratio | pvalue | p.adjust | Count |
| GO:00094107 | Liver | NAFLD | response to xenobiotic stimulus | 88/1882 | 462/18723 | 2.53e-09 | 4.11e-07 | 88 |
| GO:00067904 | Liver | NAFLD | sulfur compound metabolic process | 58/1882 | 339/18723 | 3.79e-05 | 9.38e-04 | 58 |
| GO:00030182 | Liver | NAFLD | vascular process in circulatory system | 46/1882 | 263/18723 | 1.36e-04 | 2.58e-03 | 46 |
| GO:00463241 | Liver | NAFLD | regulation of glucose import | 16/1882 | 59/18723 | 1.68e-04 | 3.06e-03 | 16 |
| GO:00352643 | Liver | NAFLD | multicellular organism growth | 27/1882 | 132/18723 | 2.57e-04 | 4.19e-03 | 27 |
| GO:0046326 | Liver | NAFLD | positive regulation of glucose import | 12/1882 | 39/18723 | 3.02e-04 | 4.75e-03 | 12 |
| GO:00108281 | Liver | NAFLD | positive regulation of glucose transmembrane transport | 13/1882 | 46/18723 | 4.35e-04 | 6.42e-03 | 13 |
| GO:00108271 | Liver | NAFLD | regulation of glucose transmembrane transport | 18/1882 | 77/18723 | 5.06e-04 | 7.15e-03 | 18 |
| GO:00714967 | Liver | NAFLD | cellular response to external stimulus | 51/1882 | 320/18723 | 6.21e-04 | 8.18e-03 | 51 |
| GO:0044272 | Liver | NAFLD | sulfur compound biosynthetic process | 28/1882 | 148/18723 | 7.52e-04 | 9.52e-03 | 28 |
| GO:00075687 | Liver | NAFLD | aging | 53/1882 | 339/18723 | 7.78e-04 | 9.77e-03 | 53 |
| GO:00463231 | Liver | NAFLD | glucose import | 16/1882 | 74/18723 | 2.43e-03 | 2.27e-02 | 16 |
| GO:0042220 | Liver | NAFLD | response to cocaine | 13/1882 | 55/18723 | 2.64e-03 | 2.42e-02 | 13 |
| GO:00347643 | Liver | NAFLD | positive regulation of transmembrane transport | 35/1882 | 219/18723 | 3.92e-03 | 3.32e-02 | 35 |
| GO:00065754 | Liver | NAFLD | cellular modified amino acid metabolic process | 31/1882 | 188/18723 | 3.98e-03 | 3.34e-02 | 31 |
| GO:00423984 | Liver | NAFLD | cellular modified amino acid biosynthetic process | 11/1882 | 46/18723 | 4.98e-03 | 3.91e-02 | 11 |
| GO:01501043 | Liver | NAFLD | transport across blood-brain barrier | 17/1882 | 87/18723 | 5.46e-03 | 4.20e-02 | 17 |
| GO:0015749 | Liver | NAFLD | monosaccharide transmembrane transport | 21/1882 | 116/18723 | 5.54e-03 | 4.23e-02 | 21 |
| GO:00102322 | Liver | NAFLD | vascular transport | 17/1882 | 88/18723 | 6.15e-03 | 4.61e-02 | 17 |
| GO:1904659 | Liver | NAFLD | glucose transmembrane transport | 20/1882 | 110/18723 | 6.36e-03 | 4.69e-02 | 20 |
| Page: 1 2 3 |
| Pathway ID | Tissue | Disease Stage | Description | Gene Ratio | Bg Ratio | pvalue | p.adjust | qvalue | Count |
| hsa0501614 | Liver | Cirrhotic | Huntington disease | 172/2530 | 306/8465 | 1.65e-22 | 1.10e-20 | 6.77e-21 | 172 |
| hsa0501414 | Liver | Cirrhotic | Amyotrophic lateral sclerosis | 187/2530 | 364/8465 | 1.56e-18 | 6.50e-17 | 4.01e-17 | 187 |
| hsa0501615 | Liver | Cirrhotic | Huntington disease | 172/2530 | 306/8465 | 1.65e-22 | 1.10e-20 | 6.77e-21 | 172 |
| hsa0501415 | Liver | Cirrhotic | Amyotrophic lateral sclerosis | 187/2530 | 364/8465 | 1.56e-18 | 6.50e-17 | 4.01e-17 | 187 |
| hsa0501622 | Liver | HCC | Huntington disease | 219/4020 | 306/8465 | 3.06e-18 | 3.42e-16 | 1.90e-16 | 219 |
| hsa0501422 | Liver | HCC | Amyotrophic lateral sclerosis | 252/4020 | 364/8465 | 8.85e-18 | 7.41e-16 | 4.12e-16 | 252 |
| hsa0501632 | Liver | HCC | Huntington disease | 219/4020 | 306/8465 | 3.06e-18 | 3.42e-16 | 1.90e-16 | 219 |
| hsa0501432 | Liver | HCC | Amyotrophic lateral sclerosis | 252/4020 | 364/8465 | 8.85e-18 | 7.41e-16 | 4.12e-16 | 252 |
| Page: 1 |
Top |
Cell-cell communication analysis |
| Identification of potential cell-cell interactions between two cell types and their ligand-receptor pairs for different disease states |
| Ligand | Receptor | LRpair | Pathway | Tissue | Disease Stage |
| Page: 1 |
Top |
Single-cell gene regulatory network inference analysis |
| Find out the significant the regulons (TFs) and the target genes of each regulon across cell types for different disease states |
| TF | Cell Type | Tissue | Disease Stage | Target Gene | RSS | Regulon Activity |
| ∗The dot plots of a searched regulon are shown for all cell subpopulations in each disease state of each tissue based on the regulon specific score inferred using pySCENIC and by calculating the average expression. |
| Page: 1 |
Top |
Somatic mutation of malignant transformation related genes |
| Annotation of somatic variants for genes involved in malignant transformation |
| Hugo Symbol | Variant Class | Variant Classification | dbSNP RS | HGVSc | HGVSp | HGVSp Short | SWISSPROT | BIOTYPE | SIFT | PolyPhen | Tumor Sample Barcode | Tissue | Histology | Sex | Age | Stage | Therapy Types | Drugs | Outcome |
| SLC1A2 | SNV | Missense_Mutation | novel | c.499G>A | p.Ala167Thr | p.A167T | P43004 | protein_coding | tolerated(0.13) | possibly_damaging(0.557) | TCGA-A2-A25B-01 | Breast | breast invasive carcinoma | Female | <65 | I/II | Chemotherapy | taxotere | PD |
| SLC1A2 | SNV | Missense_Mutation | novel | c.142A>C | p.Thr48Pro | p.T48P | P43004 | protein_coding | deleterious(0.04) | benign(0.174) | TCGA-A8-A0A6-01 | Breast | breast invasive carcinoma | Female | <65 | III/IV | Chemotherapy | epirubicin | CR |
| SLC1A2 | SNV | Missense_Mutation | novel | c.914N>T | p.Asp305Val | p.D305V | P43004 | protein_coding | deleterious(0) | probably_damaging(0.997) | TCGA-AC-A3QQ-01 | Breast | breast invasive carcinoma | Female | <65 | I/II | Unknown | Unknown | SD |
| SLC1A2 | SNV | Missense_Mutation | novel | c.913N>A | p.Asp305Asn | p.D305N | P43004 | protein_coding | tolerated(0.15) | possibly_damaging(0.524) | TCGA-AC-A3QQ-01 | Breast | breast invasive carcinoma | Female | <65 | I/II | Unknown | Unknown | SD |
| SLC1A2 | SNV | Missense_Mutation | c.602N>T | p.Pro201Leu | p.P201L | P43004 | protein_coding | tolerated(0.55) | benign(0.003) | TCGA-AO-A0J5-01 | Breast | breast invasive carcinoma | Female | <65 | III/IV | Other, specify in notesBisphosphonate | zoledronic | PD | |
| SLC1A2 | SNV | Missense_Mutation | novel | c.1717G>A | p.Glu573Lys | p.E573K | P43004 | protein_coding | tolerated_low_confidence(0.05) | benign(0.021) | TCGA-E9-A54Y-01 | Breast | breast invasive carcinoma | Female | <65 | III/IV | Unknown | Unknown | SD |
| SLC1A2 | insertion | Frame_Shift_Ins | novel | c.1093_1094insAGGCCAACATCAGTAATGAT | p.Ala365GlufsTer28 | p.A365Efs*28 | P43004 | protein_coding | TCGA-A2-A0CP-01 | Breast | breast invasive carcinoma | Female | <65 | I/II | Chemotherapy | cytoxan | SD | ||
| SLC1A2 | deletion | Frame_Shift_Del | c.530delN | p.Pro177LeufsTer15 | p.P177Lfs*15 | P43004 | protein_coding | TCGA-D8-A27V-01 | Breast | breast invasive carcinoma | Female | <65 | I/II | Hormone Therapy | tamoxiphen | SD | |||
| SLC1A2 | SNV | Missense_Mutation | c.1126N>C | p.Glu376Gln | p.E376Q | P43004 | protein_coding | deleterious(0) | probably_damaging(0.999) | TCGA-C5-A1BJ-01 | Cervix | cervical & endocervical cancer | Female | <65 | I/II | Unknown | Unknown | SD | |
| SLC1A2 | SNV | Missense_Mutation | c.293T>A | p.Ile98Asn | p.I98N | P43004 | protein_coding | deleterious(0) | probably_damaging(0.934) | TCGA-C5-A1MJ-01 | Cervix | cervical & endocervical cancer | Female | <65 | I/II | Unknown | Unknown | SD |
| Page: 1 2 3 4 5 6 7 |
Top |
Related drugs of malignant transformation related genes |
| Identification of chemicals and drugs interact with genes involved in malignant transfromation |
| (DGIdb 4.0) |
| Entrez ID | Symbol | Category | Interaction Types | Drug Claim Name | Drug Name | PMIDs |
| 6506 | SLC1A2 | TRANSPORTER, CLINICALLY ACTIONABLE, DRUGGABLE GENOME, CELL SURFACE | inhibitor | 178101134 | ||
| 6506 | SLC1A2 | TRANSPORTER, CLINICALLY ACTIONABLE, DRUGGABLE GENOME, CELL SURFACE | inhibitor | 178101294 | ||
| 6506 | SLC1A2 | TRANSPORTER, CLINICALLY ACTIONABLE, DRUGGABLE GENOME, CELL SURFACE | 178101410 | |||
| 6506 | SLC1A2 | TRANSPORTER, CLINICALLY ACTIONABLE, DRUGGABLE GENOME, CELL SURFACE | 178100898 | |||
| 6506 | SLC1A2 | TRANSPORTER, CLINICALLY ACTIONABLE, DRUGGABLE GENOME, CELL SURFACE | inhibitor | 178101252 | CHEMBL1628669 | |
| 6506 | SLC1A2 | TRANSPORTER, CLINICALLY ACTIONABLE, DRUGGABLE GENOME, CELL SURFACE | 178101255 | |||
| 6506 | SLC1A2 | TRANSPORTER, CLINICALLY ACTIONABLE, DRUGGABLE GENOME, CELL SURFACE | inhibitor | 178101292 | DIHYDROKAINATE | |
| 6506 | SLC1A2 | TRANSPORTER, CLINICALLY ACTIONABLE, DRUGGABLE GENOME, CELL SURFACE | inhibitor | 178101349 |
| Page: 1 |

Copyright 2023-Present -The University of Texas Health Science Center at Houston |