
|
|||||
|
 | |
| |
| |
| |
| |
| |
|
Gene: SLC19A1 |
Gene summary for SLC19A1 |
| Gene information | Species | Human | Gene symbol | SLC19A1 | Gene ID | 6573 |
| Gene name | solute carrier family 19 member 1 | |
| Gene Alias | CHMD | |
| Cytomap | 21q22.3 | |
| Gene Type | protein-coding | GO ID | GO:0000003 | UniProtAcc | P41440 |
Top |
Malignant transformation analysis |
| Identification of the aberrant gene expression in precancerous and cancerous lesions by comparing the gene expression of stem-like cells in diseased tissues with normal stem cells |
| Entrez ID | Symbol | Replicates | Species | Organ | Tissue | Adj P-value | Log2FC | Malignancy |
| 6573 | SLC19A1 | P2T-E | Human | Esophagus | ESCC | 2.13e-08 | 1.68e-01 | 0.1177 |
| 6573 | SLC19A1 | P4T-E | Human | Esophagus | ESCC | 7.93e-07 | 1.88e-01 | 0.1323 |
| 6573 | SLC19A1 | P5T-E | Human | Esophagus | ESCC | 9.95e-08 | 1.76e-01 | 0.1327 |
| 6573 | SLC19A1 | P10T-E | Human | Esophagus | ESCC | 4.12e-11 | 1.60e-01 | 0.116 |
| 6573 | SLC19A1 | P11T-E | Human | Esophagus | ESCC | 2.06e-07 | 2.43e-01 | 0.1426 |
| 6573 | SLC19A1 | P12T-E | Human | Esophagus | ESCC | 9.43e-05 | 1.31e-01 | 0.1122 |
| 6573 | SLC19A1 | P15T-E | Human | Esophagus | ESCC | 3.26e-02 | 8.50e-02 | 0.1149 |
| 6573 | SLC19A1 | P16T-E | Human | Esophagus | ESCC | 2.56e-16 | 3.32e-01 | 0.1153 |
| 6573 | SLC19A1 | P21T-E | Human | Esophagus | ESCC | 2.03e-09 | 1.97e-01 | 0.1617 |
| 6573 | SLC19A1 | P22T-E | Human | Esophagus | ESCC | 3.97e-04 | 1.07e-01 | 0.1236 |
| 6573 | SLC19A1 | P23T-E | Human | Esophagus | ESCC | 9.87e-03 | 1.03e-01 | 0.108 |
| 6573 | SLC19A1 | P26T-E | Human | Esophagus | ESCC | 2.69e-03 | 1.36e-01 | 0.1276 |
| 6573 | SLC19A1 | P27T-E | Human | Esophagus | ESCC | 1.88e-04 | 9.95e-02 | 0.1055 |
| 6573 | SLC19A1 | P28T-E | Human | Esophagus | ESCC | 9.03e-09 | 2.16e-01 | 0.1149 |
| 6573 | SLC19A1 | P30T-E | Human | Esophagus | ESCC | 1.89e-05 | 2.21e-01 | 0.137 |
| 6573 | SLC19A1 | P31T-E | Human | Esophagus | ESCC | 1.02e-12 | 2.41e-01 | 0.1251 |
| 6573 | SLC19A1 | P32T-E | Human | Esophagus | ESCC | 4.24e-09 | 1.99e-01 | 0.1666 |
| 6573 | SLC19A1 | P37T-E | Human | Esophagus | ESCC | 8.12e-10 | 2.05e-01 | 0.1371 |
| 6573 | SLC19A1 | P40T-E | Human | Esophagus | ESCC | 2.37e-02 | 1.02e-01 | 0.109 |
| 6573 | SLC19A1 | P42T-E | Human | Esophagus | ESCC | 2.62e-05 | 1.52e-01 | 0.1175 |
| Page: 1 2 3 |
| Tissue | Expression Dynamics | Abbreviation |
| Esophagus |  | ESCC: Esophageal squamous cell carcinoma |
| HGIN: High-grade intraepithelial neoplasias | ||
| LGIN: Low-grade intraepithelial neoplasias | ||
| Liver | 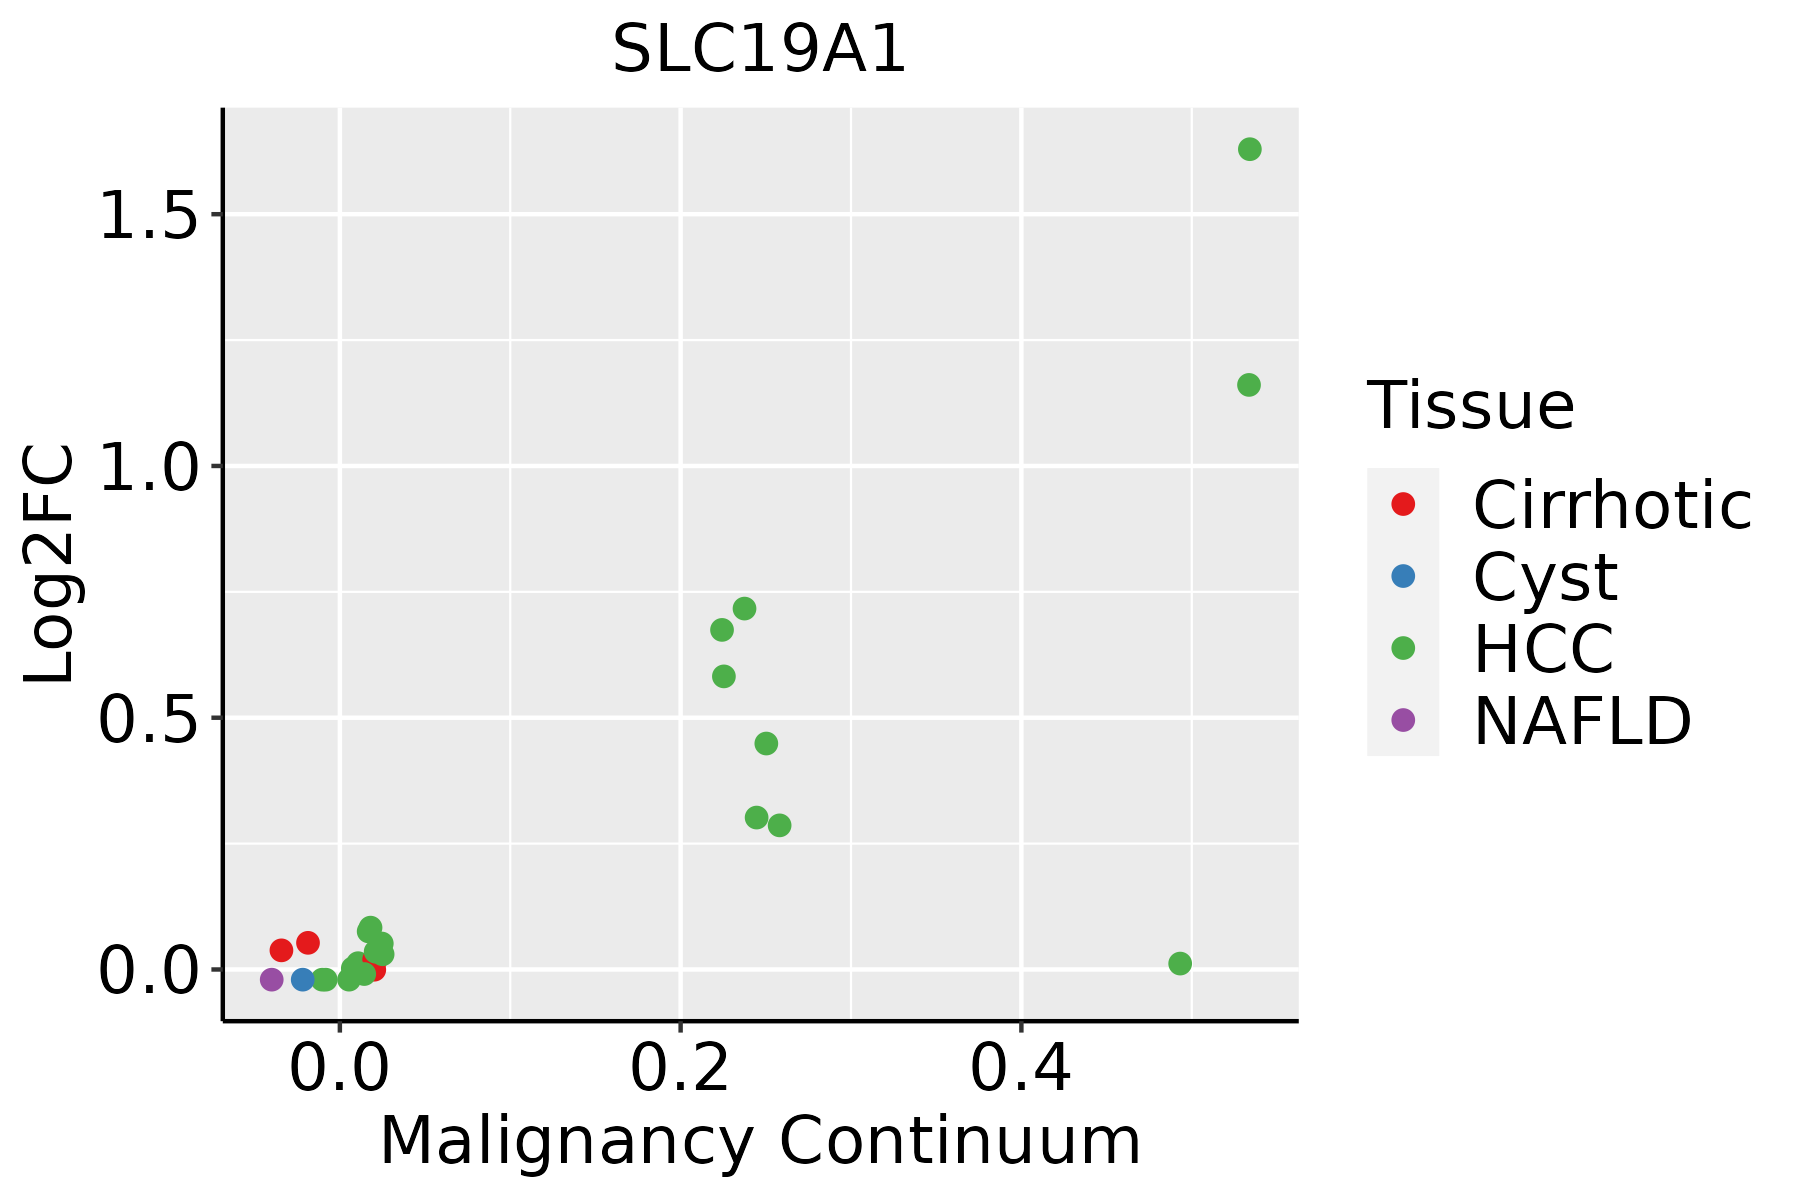 | HCC: Hepatocellular carcinoma |
| NAFLD: Non-alcoholic fatty liver disease |
| ∗log2FC in expression of this searched gene in stem-like cells from each diseased tissue sample relative to stem-like cells in normal samples in each tissue plotted against the malignancy continuum. Samples are colored based on if they are from different disease stage. |
Top |
Malignant transformation related pathway analysis |
| Find out the enriched GO biological processes and KEGG pathways involved in transition from healthy to precancer to cancer |
| Tissue | Disease Stage | Enriched GO biological Processes |
| Colorectum | AD |  |
| Colorectum | SER |  |
| Colorectum | MSS |  |
| Colorectum | MSI-H |  |
| Colorectum | FAP |  |
| ∗Top 15 enriched GO BP terms are showed in the bar plot of each disease state in each tissue. Each row represents a significant GO biological process which is colored according to the -log10(p.adjust). |
| Page: 1 2 3 4 5 6 7 8 9 |
| GO ID | Tissue | Disease Stage | Description | Gene Ratio | Bg Ratio | pvalue | p.adjust | Count |
| GO:001593117 | Esophagus | ESCC | nucleobase-containing compound transport | 162/8552 | 222/18723 | 9.87e-17 | 7.93e-15 | 162 |
| GO:00065757 | Esophagus | ESCC | cellular modified amino acid metabolic process | 112/8552 | 188/18723 | 8.31e-05 | 6.06e-04 | 112 |
| GO:00067671 | Esophagus | ESCC | water-soluble vitamin metabolic process | 41/8552 | 59/18723 | 1.84e-04 | 1.17e-03 | 41 |
| GO:00067661 | Esophagus | ESCC | vitamin metabolic process | 67/8552 | 106/18723 | 2.03e-04 | 1.28e-03 | 67 |
| GO:00425584 | Esophagus | ESCC | pteridine-containing compound metabolic process | 25/8552 | 33/18723 | 4.30e-04 | 2.43e-03 | 25 |
| GO:00436485 | Esophagus | ESCC | dicarboxylic acid metabolic process | 58/8552 | 96/18723 | 2.55e-03 | 1.09e-02 | 58 |
| GO:00067602 | Esophagus | ESCC | folic acid-containing compound metabolic process | 19/8552 | 26/18723 | 4.31e-03 | 1.71e-02 | 19 |
| GO:00466551 | Esophagus | ESCC | folic acid metabolic process | 11/8552 | 14/18723 | 1.30e-02 | 4.27e-02 | 11 |
| GO:001593111 | Liver | HCC | nucleobase-containing compound transport | 150/7958 | 222/18723 | 3.17e-14 | 2.03e-12 | 150 |
| GO:000657521 | Liver | HCC | cellular modified amino acid metabolic process | 119/7958 | 188/18723 | 6.47e-09 | 1.67e-07 | 119 |
| GO:00436482 | Liver | HCC | dicarboxylic acid metabolic process | 68/7958 | 96/18723 | 1.73e-08 | 4.14e-07 | 68 |
| GO:00425581 | Liver | HCC | pteridine-containing compound metabolic process | 28/7958 | 33/18723 | 6.57e-07 | 1.03e-05 | 28 |
| GO:00067601 | Liver | HCC | folic acid-containing compound metabolic process | 22/7958 | 26/18723 | 1.23e-05 | 1.39e-04 | 22 |
| GO:0006767 | Liver | HCC | water-soluble vitamin metabolic process | 39/7958 | 59/18723 | 2.14e-04 | 1.63e-03 | 39 |
| GO:0046655 | Liver | HCC | folic acid metabolic process | 12/7958 | 14/18723 | 1.17e-03 | 6.54e-03 | 12 |
| GO:1901264 | Liver | HCC | carbohydrate derivative transport | 48/7958 | 80/18723 | 1.19e-03 | 6.62e-03 | 48 |
| GO:015010411 | Liver | HCC | transport across blood-brain barrier | 50/7958 | 87/18723 | 3.42e-03 | 1.55e-02 | 50 |
| GO:001023211 | Liver | HCC | vascular transport | 50/7958 | 88/18723 | 4.69e-03 | 2.02e-02 | 50 |
| GO:00075651 | Liver | HCC | female pregnancy | 99/7958 | 193/18723 | 8.24e-03 | 3.23e-02 | 99 |
| GO:0006766 | Liver | HCC | vitamin metabolic process | 57/7958 | 106/18723 | 1.25e-02 | 4.53e-02 | 57 |
| Page: 1 |
| Pathway ID | Tissue | Disease Stage | Description | Gene Ratio | Bg Ratio | pvalue | p.adjust | qvalue | Count |
| hsa015232 | Esophagus | ESCC | Antifolate resistance | 22/4205 | 30/8465 | 7.23e-03 | 1.76e-02 | 8.99e-03 | 22 |
| hsa0152311 | Esophagus | ESCC | Antifolate resistance | 22/4205 | 30/8465 | 7.23e-03 | 1.76e-02 | 8.99e-03 | 22 |
| hsa01523 | Liver | HCC | Antifolate resistance | 21/4020 | 30/8465 | 1.06e-02 | 2.71e-02 | 1.51e-02 | 21 |
| hsa015231 | Liver | HCC | Antifolate resistance | 21/4020 | 30/8465 | 1.06e-02 | 2.71e-02 | 1.51e-02 | 21 |
| Page: 1 |
Top |
Cell-cell communication analysis |
| Identification of potential cell-cell interactions between two cell types and their ligand-receptor pairs for different disease states |
| Ligand | Receptor | LRpair | Pathway | Tissue | Disease Stage |
| Page: 1 |
Top |
Single-cell gene regulatory network inference analysis |
| Find out the significant the regulons (TFs) and the target genes of each regulon across cell types for different disease states |
| TF | Cell Type | Tissue | Disease Stage | Target Gene | RSS | Regulon Activity |
| ∗The dot plots of a searched regulon are shown for all cell subpopulations in each disease state of each tissue based on the regulon specific score inferred using pySCENIC and by calculating the average expression. |
| Page: 1 |
Top |
Somatic mutation of malignant transformation related genes |
| Annotation of somatic variants for genes involved in malignant transformation |
| Hugo Symbol | Variant Class | Variant Classification | dbSNP RS | HGVSc | HGVSp | HGVSp Short | SWISSPROT | BIOTYPE | SIFT | PolyPhen | Tumor Sample Barcode | Tissue | Histology | Sex | Age | Stage | Therapy Types | Drugs | Outcome |
| SLC19A1 | SNV | Missense_Mutation | c.413N>G | p.Ser138Cys | p.S138C | P41440 | protein_coding | deleterious(0) | probably_damaging(0.997) | TCGA-JW-A5VJ-01 | Cervix | cervical & endocervical cancer | Female | <65 | I/II | Unknown | Unknown | PD | |
| SLC19A1 | SNV | Missense_Mutation | novel | c.952N>A | p.Ala318Thr | p.A318T | P41440 | protein_coding | deleterious(0.02) | benign(0.243) | TCGA-VS-A94Y-01 | Cervix | cervical & endocervical cancer | Female | <65 | I/II | Chemotherapy | cisplatin | PD |
| SLC19A1 | insertion | Frame_Shift_Ins | novel | c.649_650insATGGGGCA | p.Arg217HisfsTer17 | p.R217Hfs*17 | P41440 | protein_coding | TCGA-DS-A1OB-01 | Cervix | cervical & endocervical cancer | Female | <65 | I/II | Chemotherapy | carboplatin | PD | ||
| SLC19A1 | insertion | Frame_Shift_Ins | novel | c.647_648insT | p.Arg217ProfsTer177 | p.R217Pfs*177 | P41440 | protein_coding | TCGA-DS-A1OB-01 | Cervix | cervical & endocervical cancer | Female | <65 | I/II | Chemotherapy | carboplatin | PD | ||
| SLC19A1 | SNV | Missense_Mutation | rs771242705 | c.436N>T | p.Pro146Ser | p.P146S | P41440 | protein_coding | tolerated(0.06) | probably_damaging(0.992) | TCGA-5M-AAT6-01 | Colorectum | colon adenocarcinoma | Female | <65 | III/IV | Unknown | Unknown | PD |
| SLC19A1 | SNV | Missense_Mutation | c.235G>A | p.Val79Met | p.V79M | P41440 | protein_coding | tolerated(0.08) | probably_damaging(0.997) | TCGA-A6-A565-01 | Colorectum | colon adenocarcinoma | Female | <65 | III/IV | Unspecific | 5FU | PD | |
| SLC19A1 | SNV | Missense_Mutation | novel | c.844T>C | p.Tyr282His | p.Y282H | P41440 | protein_coding | tolerated(0.08) | possibly_damaging(0.774) | TCGA-AA-3866-01 | Colorectum | colon adenocarcinoma | Female | >=65 | I/II | Unknown | Unknown | SD |
| SLC19A1 | SNV | Missense_Mutation | novel | c.838G>A | p.Gly280Ser | p.G280S | P41440 | protein_coding | deleterious(0) | probably_damaging(0.98) | TCGA-AA-3877-01 | Colorectum | colon adenocarcinoma | Female | >=65 | I/II | Unknown | Unknown | SD |
| SLC19A1 | SNV | Missense_Mutation | c.1038N>T | p.Gln346His | p.Q346H | P41440 | protein_coding | deleterious(0.05) | probably_damaging(0.959) | TCGA-AD-6889-01 | Colorectum | colon adenocarcinoma | Male | >=65 | I/II | Chemotherapy | xeloda | PD | |
| SLC19A1 | SNV | Missense_Mutation | c.1189N>A | p.Ala397Thr | p.A397T | P41440 | protein_coding | deleterious(0) | probably_damaging(1) | TCGA-AD-6895-01 | Colorectum | colon adenocarcinoma | Male | >=65 | III/IV | Unknown | Unknown | SD |
| Page: 1 2 3 4 5 6 7 |
Top |
Related drugs of malignant transformation related genes |
| Identification of chemicals and drugs interact with genes involved in malignant transfromation |
| (DGIdb 4.0) |
| Entrez ID | Symbol | Category | Interaction Types | Drug Claim Name | Drug Name | PMIDs |
| 6573 | SLC19A1 | TRANSPORTER, EXTERNAL SIDE OF PLASMA MEMBRANE, DRUGGABLE GENOME | Folic Acid | |||
| 6573 | SLC19A1 | TRANSPORTER, EXTERNAL SIDE OF PLASMA MEMBRANE, DRUGGABLE GENOME | RALTITREXED | RALTITREXED | 21879757 | |
| 6573 | SLC19A1 | TRANSPORTER, EXTERNAL SIDE OF PLASMA MEMBRANE, DRUGGABLE GENOME | leucovorin | LEUCOVORIN | 16115875 | |
| 6573 | SLC19A1 | TRANSPORTER, EXTERNAL SIDE OF PLASMA MEMBRANE, DRUGGABLE GENOME | cisplatin | CISPLATIN | 16875718 | |
| 6573 | SLC19A1 | TRANSPORTER, EXTERNAL SIDE OF PLASMA MEMBRANE, DRUGGABLE GENOME | Methotrexate | METHOTREXATE | ||
| 6573 | SLC19A1 | TRANSPORTER, EXTERNAL SIDE OF PLASMA MEMBRANE, DRUGGABLE GENOME | fluorouracil | FLUOROURACIL | 16875718 | |
| 6573 | SLC19A1 | TRANSPORTER, EXTERNAL SIDE OF PLASMA MEMBRANE, DRUGGABLE GENOME | PEMETREXED | PEMETREXED | 21879757 | |
| 6573 | SLC19A1 | TRANSPORTER, EXTERNAL SIDE OF PLASMA MEMBRANE, DRUGGABLE GENOME | Platinum compounds | 29662106 | ||
| 6573 | SLC19A1 | TRANSPORTER, EXTERNAL SIDE OF PLASMA MEMBRANE, DRUGGABLE GENOME | 178101388 | |||
| 6573 | SLC19A1 | TRANSPORTER, EXTERNAL SIDE OF PLASMA MEMBRANE, DRUGGABLE GENOME | raltitrexed | RALTITREXED | 11705857 |
| Page: 1 2 |

Copyright 2023-Present -The University of Texas Health Science Center at Houston |