
|
|||||
|
 | |
| |
| |
| |
| |
| |
|
Gene: SLC17A5 |
Gene summary for SLC17A5 |
| Gene information | Species | Human | Gene symbol | SLC17A5 | Gene ID | 26503 |
| Gene name | solute carrier family 17 member 5 | |
| Gene Alias | AST | |
| Cytomap | 6q13 | |
| Gene Type | protein-coding | GO ID | GO:0006810 | UniProtAcc | Q9NRA2 |
Top |
Malignant transformation analysis |
| Identification of the aberrant gene expression in precancerous and cancerous lesions by comparing the gene expression of stem-like cells in diseased tissues with normal stem cells |
| Entrez ID | Symbol | Replicates | Species | Organ | Tissue | Adj P-value | Log2FC | Malignancy |
| 26503 | SLC17A5 | HTA11_1938_2000001011 | Human | Colorectum | AD | 1.12e-02 | 3.90e-01 | -0.0811 |
| 26503 | SLC17A5 | HTA11_347_2000001011 | Human | Colorectum | AD | 6.59e-08 | 4.31e-01 | -0.1954 |
| 26503 | SLC17A5 | HTA11_411_2000001011 | Human | Colorectum | SER | 7.85e-07 | 1.31e+00 | -0.2602 |
| 26503 | SLC17A5 | HTA11_2112_2000001011 | Human | Colorectum | SER | 3.64e-02 | 7.07e-01 | -0.2196 |
| 26503 | SLC17A5 | HTA11_99999965104_69814 | Human | Colorectum | MSS | 8.69e-03 | 4.26e-01 | 0.281 |
| 26503 | SLC17A5 | A015-C-203 | Human | Colorectum | FAP | 9.25e-09 | -2.33e-01 | -0.1294 |
| 26503 | SLC17A5 | A002-C-201 | Human | Colorectum | FAP | 4.94e-03 | -1.44e-01 | 0.0324 |
| 26503 | SLC17A5 | A001-C-108 | Human | Colorectum | FAP | 7.95e-03 | -1.45e-01 | -0.0272 |
| 26503 | SLC17A5 | A002-C-205 | Human | Colorectum | FAP | 9.58e-06 | -2.03e-01 | -0.1236 |
| 26503 | SLC17A5 | A015-C-006 | Human | Colorectum | FAP | 9.56e-04 | -2.36e-01 | -0.0994 |
| 26503 | SLC17A5 | A015-C-106 | Human | Colorectum | FAP | 1.87e-04 | -1.52e-01 | -0.0511 |
| 26503 | SLC17A5 | A002-C-114 | Human | Colorectum | FAP | 1.50e-04 | -1.93e-01 | -0.1561 |
| 26503 | SLC17A5 | A015-C-104 | Human | Colorectum | FAP | 1.78e-08 | -2.54e-01 | -0.1899 |
| 26503 | SLC17A5 | A001-C-014 | Human | Colorectum | FAP | 5.38e-03 | -1.16e-01 | 0.0135 |
| 26503 | SLC17A5 | A002-C-016 | Human | Colorectum | FAP | 3.79e-04 | -1.82e-01 | 0.0521 |
| 26503 | SLC17A5 | A015-C-002 | Human | Colorectum | FAP | 6.15e-03 | -2.10e-01 | -0.0763 |
| 26503 | SLC17A5 | A001-C-203 | Human | Colorectum | FAP | 3.92e-04 | -1.41e-01 | -0.0481 |
| 26503 | SLC17A5 | A002-C-116 | Human | Colorectum | FAP | 1.88e-08 | -2.05e-01 | -0.0452 |
| 26503 | SLC17A5 | A014-C-008 | Human | Colorectum | FAP | 7.08e-03 | -2.06e-01 | -0.191 |
| 26503 | SLC17A5 | A018-E-020 | Human | Colorectum | FAP | 2.88e-04 | -1.57e-01 | -0.2034 |
| Page: 1 2 3 4 5 |
| Tissue | Expression Dynamics | Abbreviation |
| Colorectum (GSE201348) |  | FAP: Familial adenomatous polyposis |
| CRC: Colorectal cancer | ||
| Colorectum (HTA11) |  | AD: Adenomas |
| SER: Sessile serrated lesions | ||
| MSI-H: Microsatellite-high colorectal cancer | ||
| MSS: Microsatellite stable colorectal cancer | ||
| Esophagus | 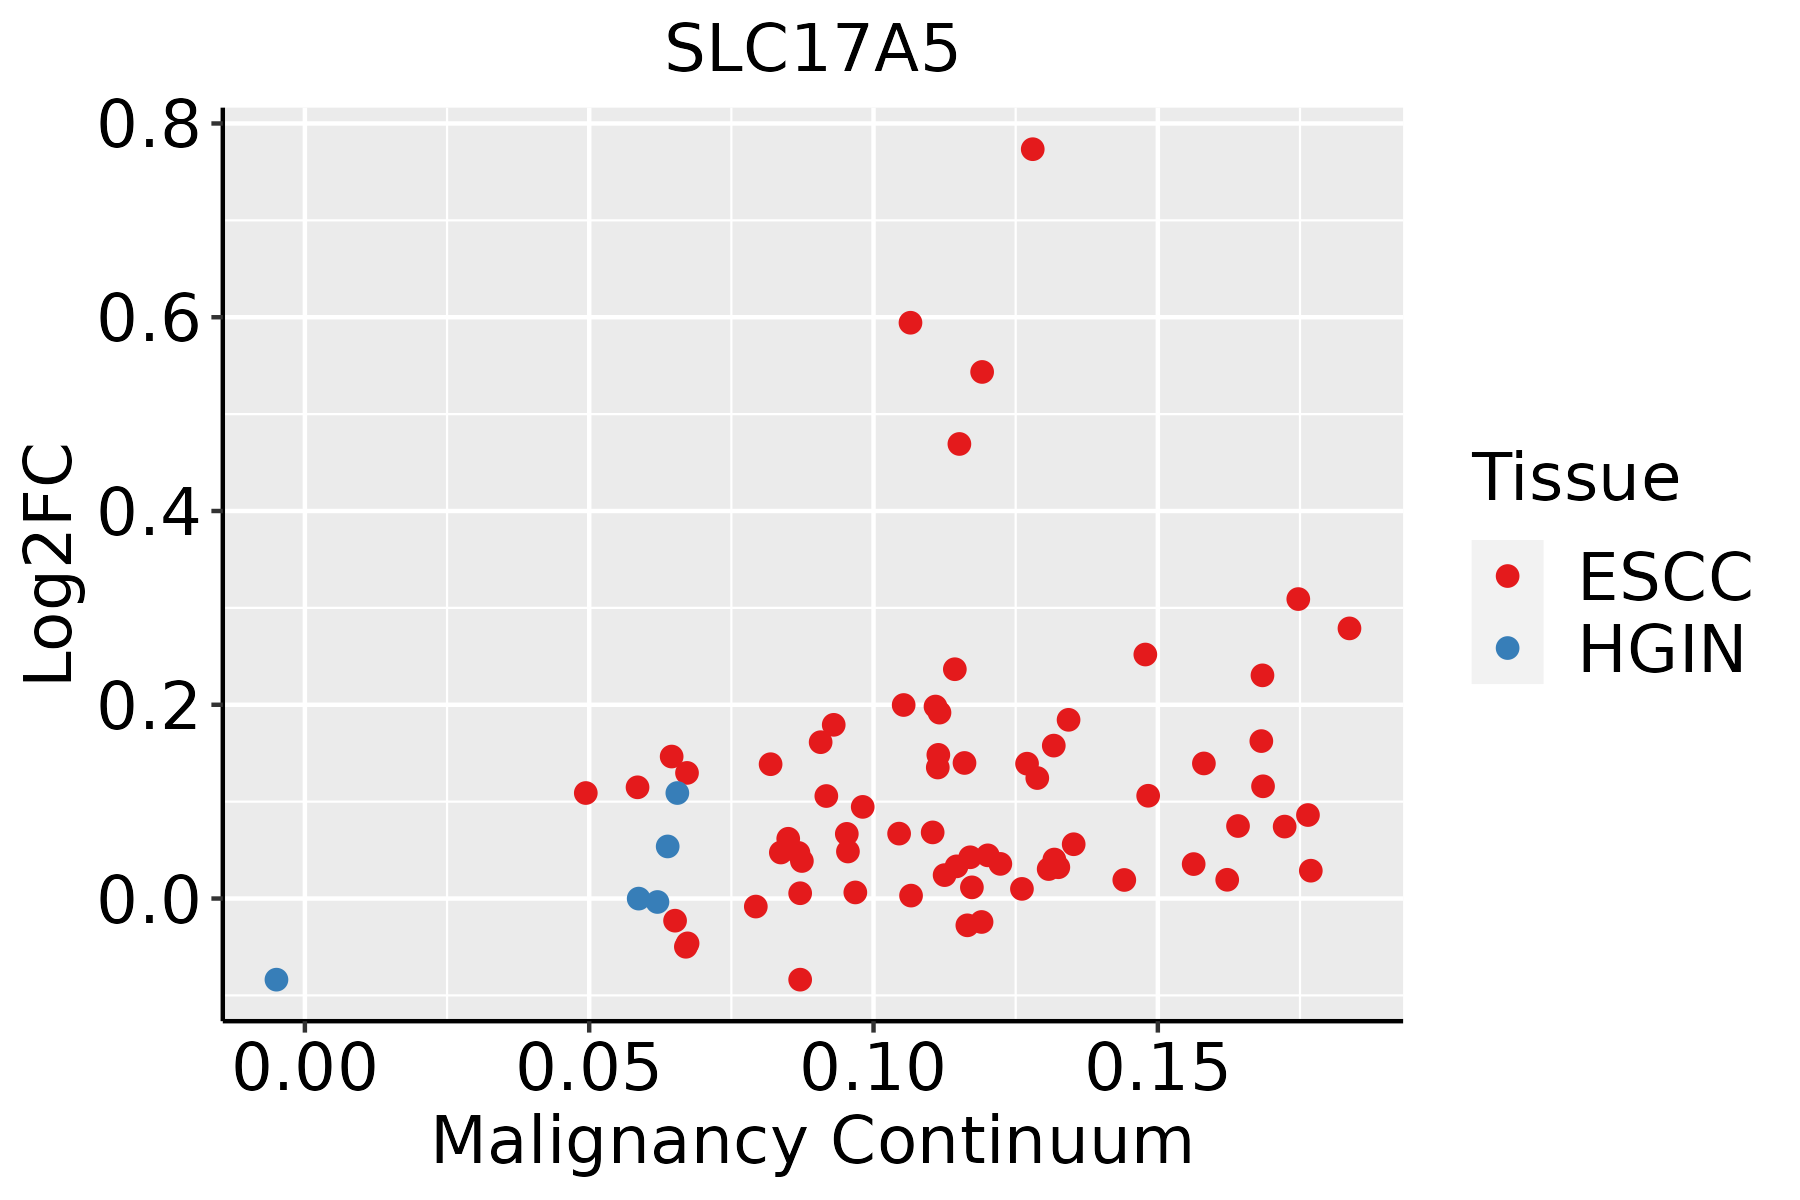 | ESCC: Esophageal squamous cell carcinoma |
| HGIN: High-grade intraepithelial neoplasias | ||
| LGIN: Low-grade intraepithelial neoplasias | ||
| Liver | 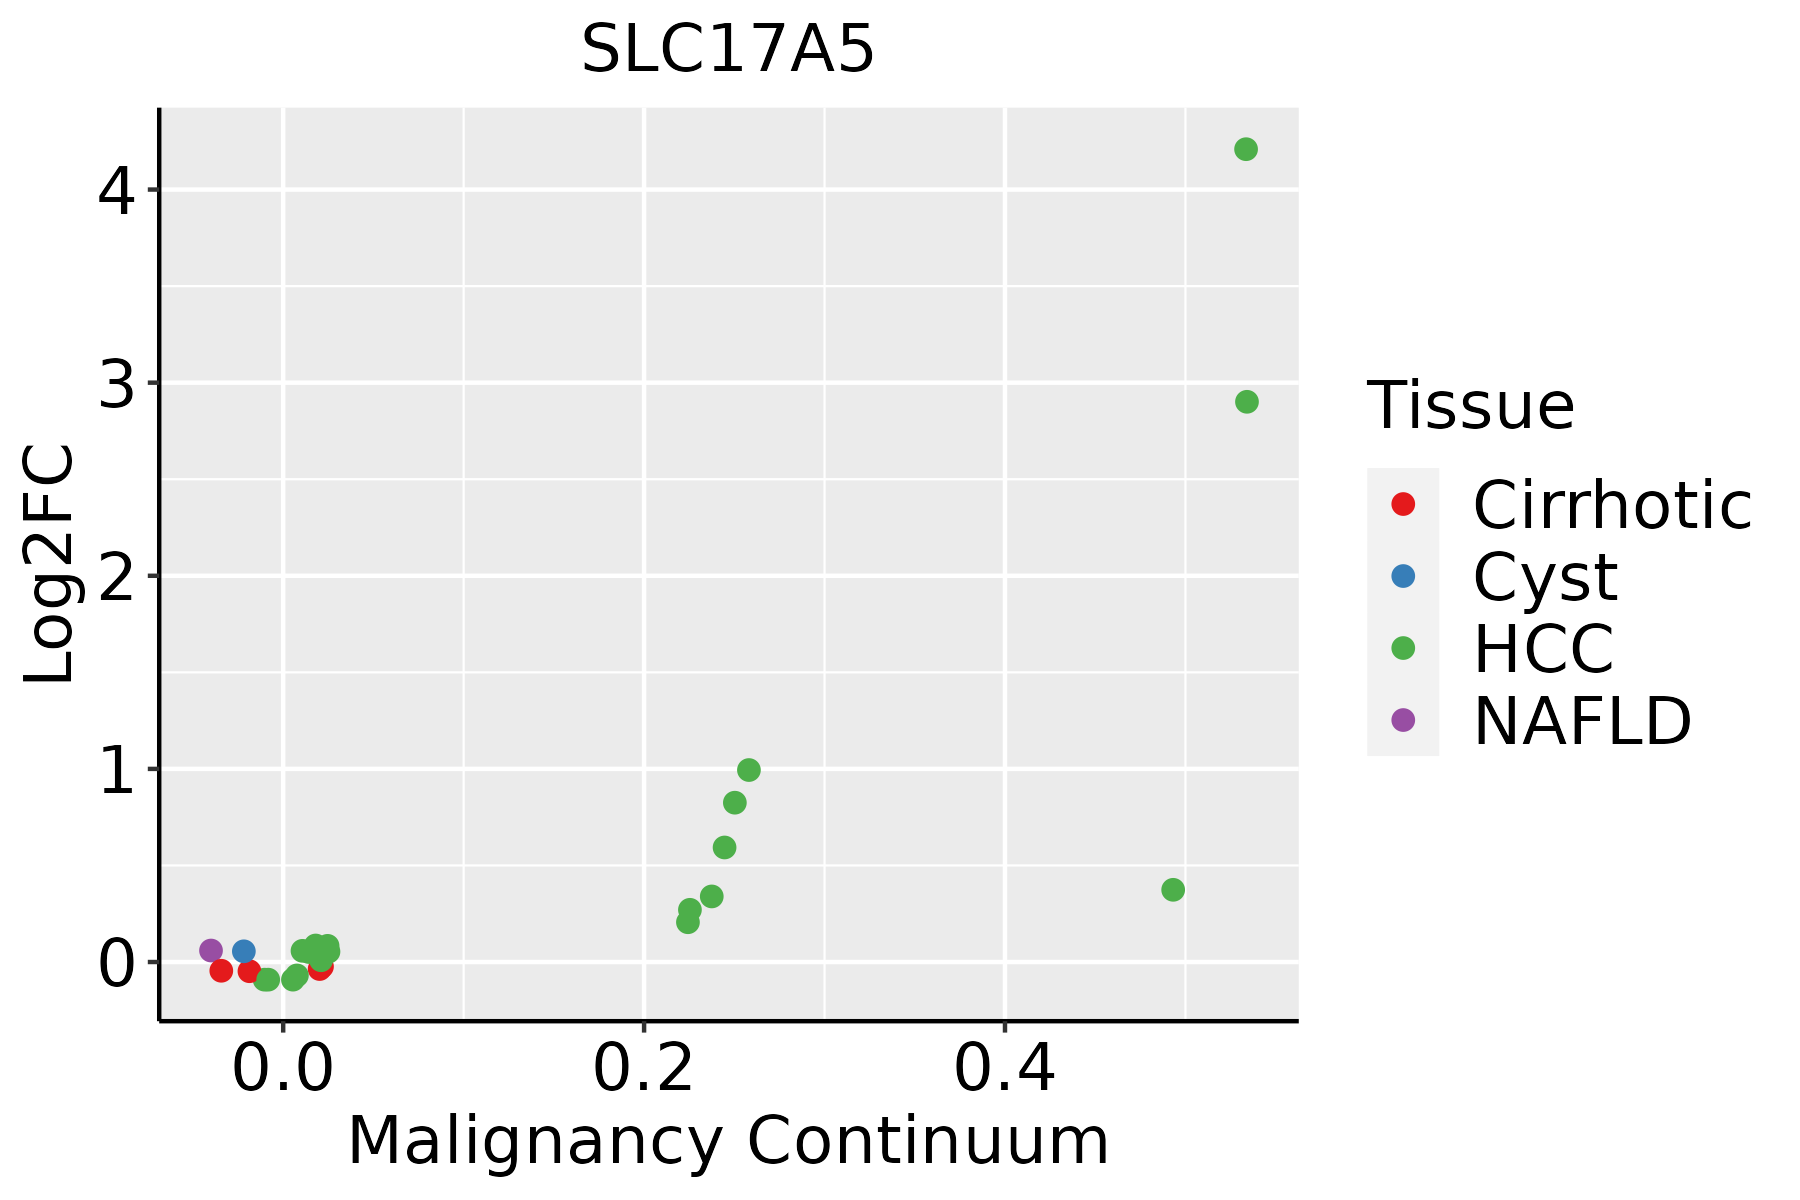 | HCC: Hepatocellular carcinoma |
| NAFLD: Non-alcoholic fatty liver disease | ||
| Thyroid | 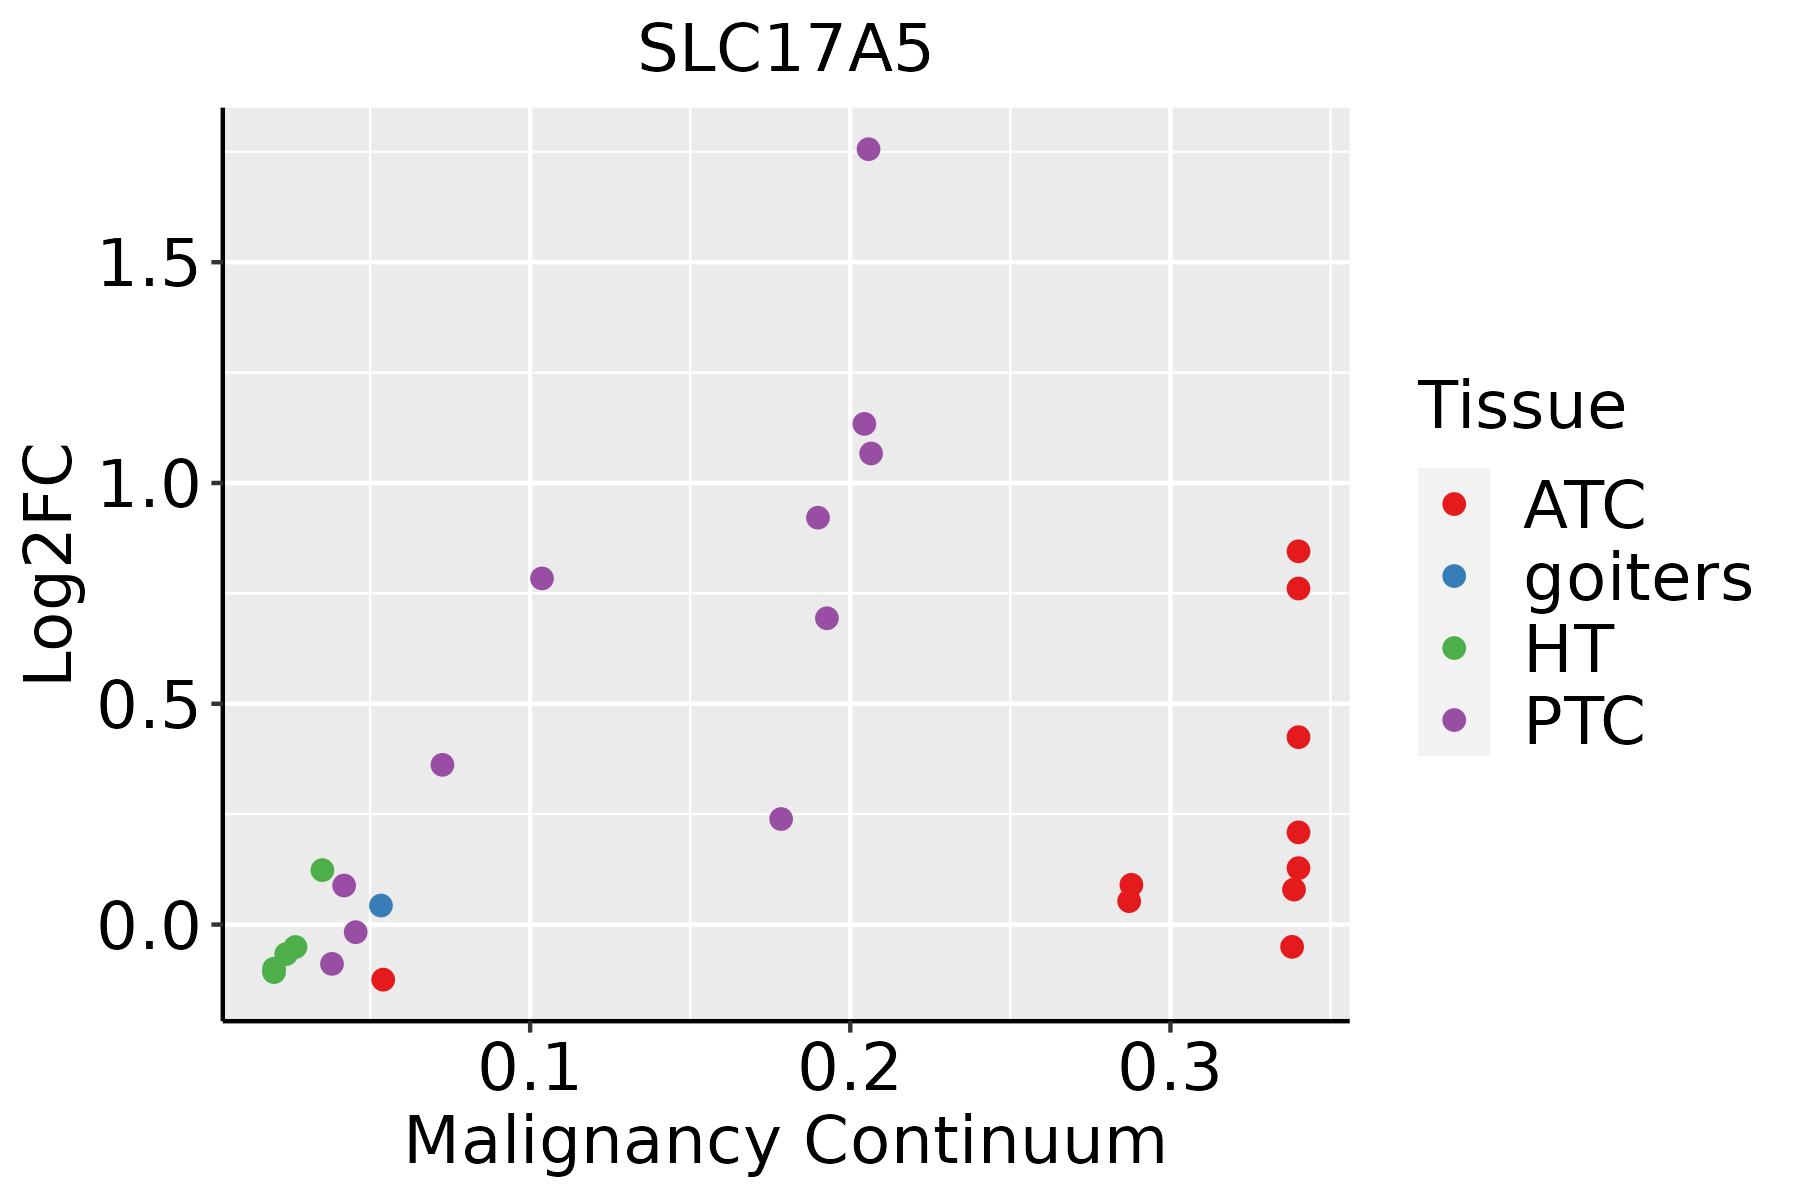 | ATC: Anaplastic thyroid cancer |
| HT: Hashimoto's thyroiditis | ||
| PTC: Papillary thyroid cancer |
| ∗log2FC in expression of this searched gene in stem-like cells from each diseased tissue sample relative to stem-like cells in normal samples in each tissue plotted against the malignancy continuum. Samples are colored based on if they are from different disease stage. |
Top |
Malignant transformation related pathway analysis |
| Find out the enriched GO biological processes and KEGG pathways involved in transition from healthy to precancer to cancer |
| Tissue | Disease Stage | Enriched GO biological Processes |
| Colorectum | AD |  |
| Colorectum | SER |  |
| Colorectum | MSS |  |
| Colorectum | MSI-H |  |
| Colorectum | FAP |  |
| ∗Top 15 enriched GO BP terms are showed in the bar plot of each disease state in each tissue. Each row represents a significant GO biological process which is colored according to the -log10(p.adjust). |
| Page: 1 2 3 4 5 6 7 8 9 |
| GO ID | Tissue | Disease Stage | Description | Gene Ratio | Bg Ratio | pvalue | p.adjust | Count |
| GO:1902600 | Colorectum | AD | proton transmembrane transport | 66/3918 | 157/18723 | 1.59e-09 | 1.17e-07 | 66 |
| GO:19026001 | Colorectum | SER | proton transmembrane transport | 60/2897 | 157/18723 | 3.12e-12 | 7.08e-10 | 60 |
| GO:19026002 | Colorectum | MSS | proton transmembrane transport | 57/3467 | 157/18723 | 1.00e-07 | 4.81e-06 | 57 |
| GO:19026004 | Colorectum | FAP | proton transmembrane transport | 39/2622 | 157/18723 | 2.03e-04 | 2.92e-03 | 39 |
| GO:190260018 | Esophagus | ESCC | proton transmembrane transport | 88/8552 | 157/18723 | 5.62e-03 | 2.10e-02 | 88 |
| GO:19026007 | Liver | HCC | proton transmembrane transport | 87/7958 | 157/18723 | 7.27e-04 | 4.42e-03 | 87 |
| GO:0008643 | Liver | HCC | carbohydrate transport | 80/7958 | 152/18723 | 7.34e-03 | 2.92e-02 | 80 |
| GO:1902600111 | Thyroid | PTC | proton transmembrane transport | 72/5968 | 157/18723 | 1.64e-04 | 1.26e-03 | 72 |
| GO:190260032 | Thyroid | ATC | proton transmembrane transport | 73/6293 | 157/18723 | 5.25e-04 | 3.06e-03 | 73 |
| Page: 1 |
| Pathway ID | Tissue | Disease Stage | Description | Gene Ratio | Bg Ratio | pvalue | p.adjust | qvalue | Count |
| hsa04142 | Colorectum | SER | Lysosome | 38/1580 | 132/8465 | 2.87e-03 | 2.03e-02 | 1.47e-02 | 38 |
| hsa041421 | Colorectum | SER | Lysosome | 38/1580 | 132/8465 | 2.87e-03 | 2.03e-02 | 1.47e-02 | 38 |
| hsa0414222 | Esophagus | ESCC | Lysosome | 102/4205 | 132/8465 | 5.11e-11 | 7.13e-10 | 3.65e-10 | 102 |
| hsa0414232 | Esophagus | ESCC | Lysosome | 102/4205 | 132/8465 | 5.11e-11 | 7.13e-10 | 3.65e-10 | 102 |
| hsa041422 | Liver | HCC | Lysosome | 100/4020 | 132/8465 | 2.32e-11 | 4.31e-10 | 2.40e-10 | 100 |
| hsa041423 | Liver | HCC | Lysosome | 100/4020 | 132/8465 | 2.32e-11 | 4.31e-10 | 2.40e-10 | 100 |
| Page: 1 |
Top |
Cell-cell communication analysis |
| Identification of potential cell-cell interactions between two cell types and their ligand-receptor pairs for different disease states |
| Ligand | Receptor | LRpair | Pathway | Tissue | Disease Stage |
| Page: 1 |
Top |
Single-cell gene regulatory network inference analysis |
| Find out the significant the regulons (TFs) and the target genes of each regulon across cell types for different disease states |
| TF | Cell Type | Tissue | Disease Stage | Target Gene | RSS | Regulon Activity |
| ∗The dot plots of a searched regulon are shown for all cell subpopulations in each disease state of each tissue based on the regulon specific score inferred using pySCENIC and by calculating the average expression. |
| Page: 1 |
Top |
Somatic mutation of malignant transformation related genes |
| Annotation of somatic variants for genes involved in malignant transformation |
| Hugo Symbol | Variant Class | Variant Classification | dbSNP RS | HGVSc | HGVSp | HGVSp Short | SWISSPROT | BIOTYPE | SIFT | PolyPhen | Tumor Sample Barcode | Tissue | Histology | Sex | Age | Stage | Therapy Types | Drugs | Outcome |
| SLC17A5 | SNV | Missense_Mutation | novel | c.863C>G | p.Ser288Cys | p.S288C | Q9NRA2 | protein_coding | deleterious(0.01) | probably_damaging(1) | TCGA-3C-AALI-01 | Breast | breast invasive carcinoma | Female | <65 | I/II | Unspecific | Poly E | Complete Response |
| SLC17A5 | SNV | Missense_Mutation | rs781359811 | c.646N>G | p.Leu216Val | p.L216V | Q9NRA2 | protein_coding | tolerated(0.21) | benign(0.095) | TCGA-BH-A203-01 | Breast | breast invasive carcinoma | Female | >=65 | I/II | Unknown | Unknown | PD |
| SLC17A5 | SNV | Missense_Mutation | rs748755467 | c.841C>T | p.Pro281Ser | p.P281S | Q9NRA2 | protein_coding | deleterious(0.03) | probably_damaging(1) | TCGA-D8-A1JA-01 | Breast | breast invasive carcinoma | Female | <65 | III/IV | Chemotherapy | adriamycin | PD |
| SLC17A5 | SNV | Missense_Mutation | c.187N>A | p.Ala63Thr | p.A63T | Q9NRA2 | protein_coding | deleterious(0.02) | probably_damaging(0.998) | TCGA-AA-3492-01 | Colorectum | colon adenocarcinoma | Female | >=65 | I/II | Unknown | Unknown | SD | |
| SLC17A5 | SNV | Missense_Mutation | c.353G>A | p.Gly118Asp | p.G118D | Q9NRA2 | protein_coding | deleterious(0) | probably_damaging(0.999) | TCGA-AA-A01K-01 | Colorectum | colon adenocarcinoma | Female | >=65 | III/IV | Chemotherapy | folinic | CR | |
| SLC17A5 | SNV | Missense_Mutation | novel | c.703N>G | p.Thr235Ala | p.T235A | Q9NRA2 | protein_coding | tolerated(1) | benign(0.003) | TCGA-AZ-4315-01 | Colorectum | colon adenocarcinoma | Male | <65 | I/II | Unknown | Unknown | SD |
| SLC17A5 | SNV | Missense_Mutation | c.1071N>A | p.Asn357Lys | p.N357K | Q9NRA2 | protein_coding | tolerated(0.29) | benign(0.006) | TCGA-AZ-6598-01 | Colorectum | colon adenocarcinoma | Female | >=65 | I/II | Unknown | Unknown | SD | |
| SLC17A5 | SNV | Missense_Mutation | c.638N>A | p.Ser213Tyr | p.S213Y | Q9NRA2 | protein_coding | deleterious(0) | probably_damaging(0.926) | TCGA-CA-6717-01 | Colorectum | colon adenocarcinoma | Male | <65 | I/II | Chemotherapy | oxaliplatin | CR | |
| SLC17A5 | SNV | Missense_Mutation | novel | c.160N>C | p.Tyr54His | p.Y54H | Q9NRA2 | protein_coding | deleterious(0) | probably_damaging(0.999) | TCGA-G4-6302-01 | Colorectum | colon adenocarcinoma | Female | >=65 | I/II | Unknown | Unknown | SD |
| SLC17A5 | SNV | Missense_Mutation | rs150686745 | c.1090N>T | p.Arg364Cys | p.R364C | Q9NRA2 | protein_coding | deleterious(0) | probably_damaging(1) | TCGA-AG-A002-01 | Colorectum | rectum adenocarcinoma | Male | <65 | I/II | Unknown | Unknown | SD |
| Page: 1 2 3 4 5 6 |
Top |
Related drugs of malignant transformation related genes |
| Identification of chemicals and drugs interact with genes involved in malignant transfromation |
| (DGIdb 4.0) |
| Entrez ID | Symbol | Category | Interaction Types | Drug Claim Name | Drug Name | PMIDs |
| Page: 1 |

Copyright 2023-Present -The University of Texas Health Science Center at Houston |