
|
|||||
|
 | |
| |
| |
| |
| |
| |
|
Gene: SLC17A3 |
Gene summary for SLC17A3 |
| Gene information | Species | Human | Gene symbol | SLC17A3 | Gene ID | 10786 |
| Gene name | solute carrier family 17 member 3 | |
| Gene Alias | GOUT4 | |
| Cytomap | 6p22.2 | |
| Gene Type | protein-coding | GO ID | GO:0006082 | UniProtAcc | O00476 |
Top |
Malignant transformation analysis |
| Identification of the aberrant gene expression in precancerous and cancerous lesions by comparing the gene expression of stem-like cells in diseased tissues with normal stem cells |
| Entrez ID | Symbol | Replicates | Species | Organ | Tissue | Adj P-value | Log2FC | Malignancy |
| 10786 | SLC17A3 | NAFLD1 | Human | Liver | NAFLD | 5.09e-06 | 4.91e-01 | -0.04 |
| 10786 | SLC17A3 | HCC1_Meng | Human | Liver | HCC | 1.90e-73 | 6.21e-01 | 0.0246 |
| 10786 | SLC17A3 | HCC2 | Human | Liver | HCC | 9.52e-06 | 2.12e+00 | 0.5341 |
| 10786 | SLC17A3 | S027 | Human | Liver | HCC | 2.82e-05 | 6.32e-01 | 0.2446 |
| 10786 | SLC17A3 | S028 | Human | Liver | HCC | 1.09e-18 | 6.69e-01 | 0.2503 |
| 10786 | SLC17A3 | S029 | Human | Liver | HCC | 5.41e-19 | 8.15e-01 | 0.2581 |
| Page: 1 |
| Tissue | Expression Dynamics | Abbreviation |
| Liver | 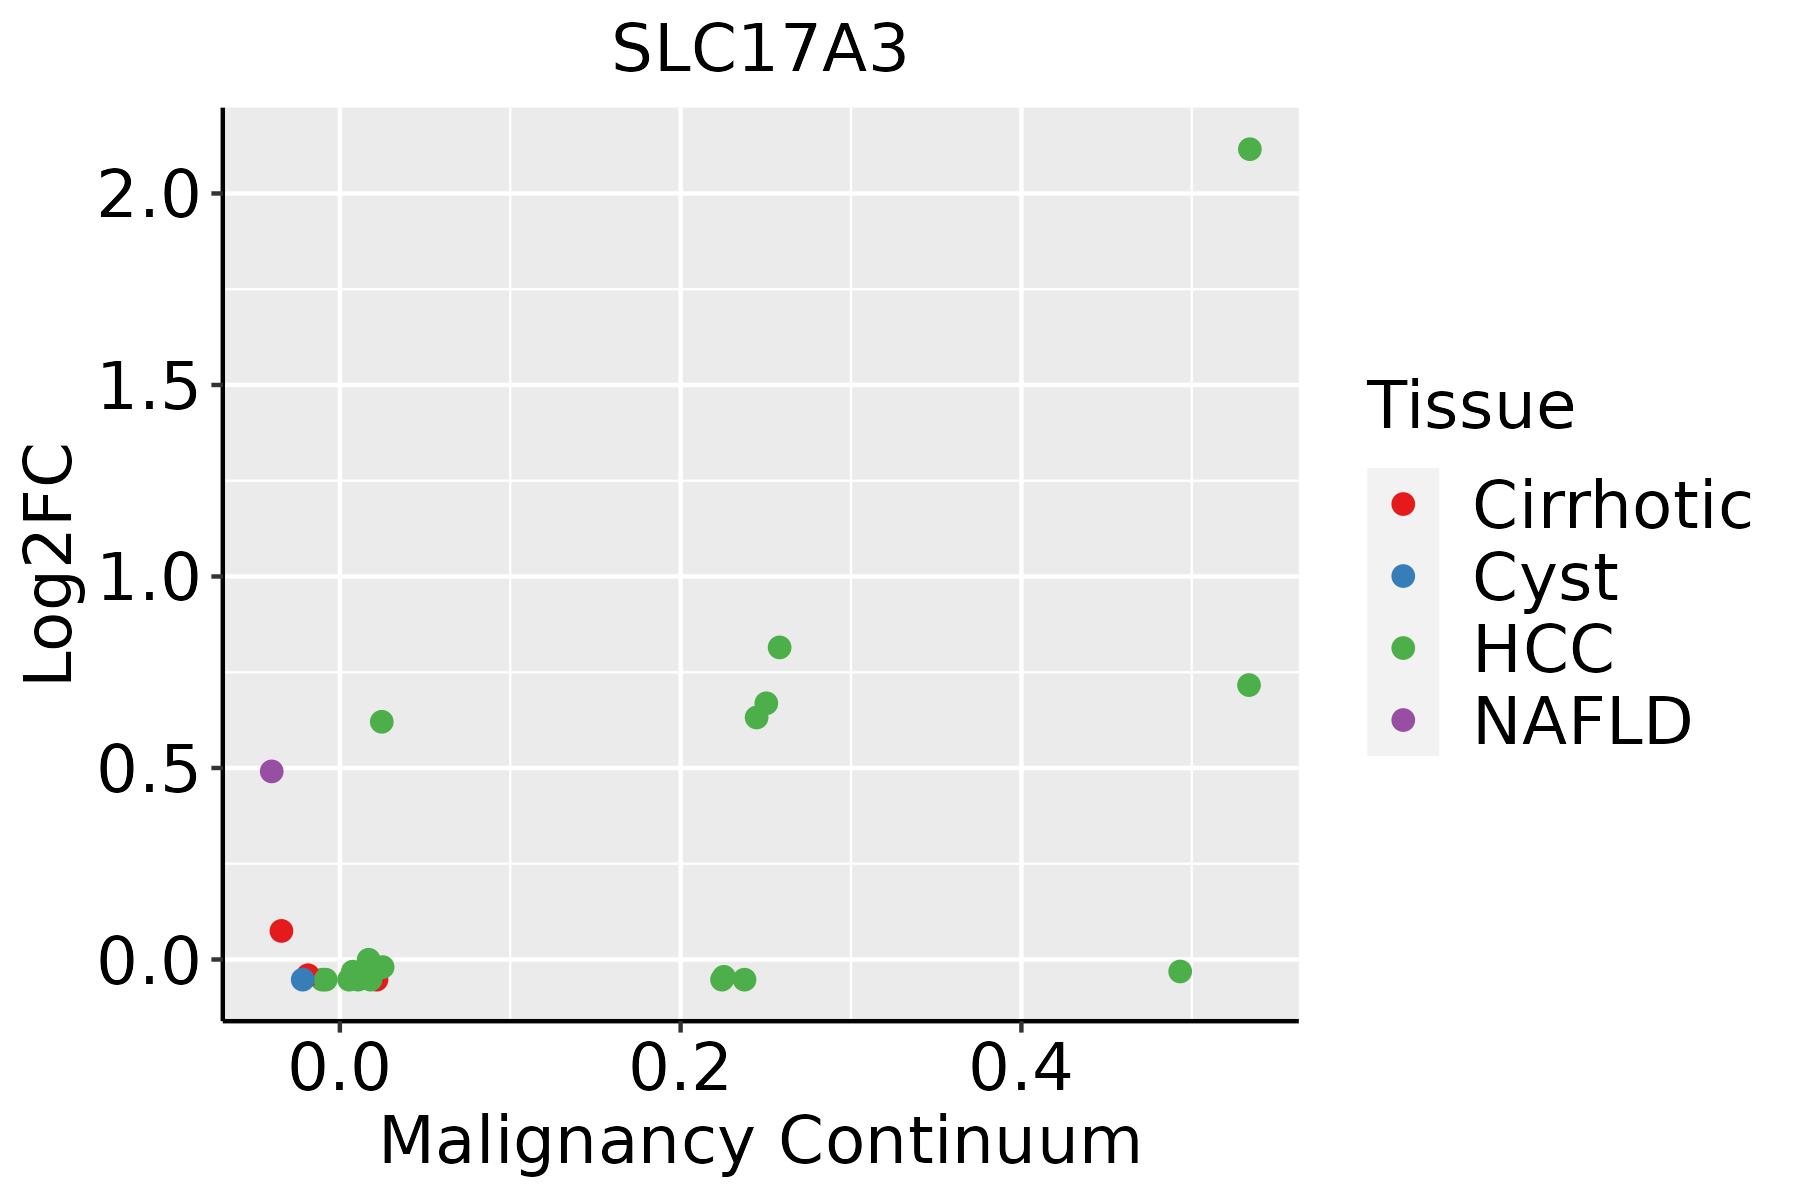 | HCC: Hepatocellular carcinoma |
| NAFLD: Non-alcoholic fatty liver disease |
| ∗log2FC in expression of this searched gene in stem-like cells from each diseased tissue sample relative to stem-like cells in normal samples in each tissue plotted against the malignancy continuum. Samples are colored based on if they are from different disease stage. |
Top |
Malignant transformation related pathway analysis |
| Find out the enriched GO biological processes and KEGG pathways involved in transition from healthy to precancer to cancer |
| Tissue | Disease Stage | Enriched GO biological Processes |
| Colorectum | AD |  |
| Colorectum | SER |  |
| Colorectum | MSS |  |
| Colorectum | MSI-H |  |
| Colorectum | FAP |  |
| ∗Top 15 enriched GO BP terms are showed in the bar plot of each disease state in each tissue. Each row represents a significant GO biological process which is colored according to the -log10(p.adjust). |
| Page: 1 2 3 4 5 6 7 8 9 |
| GO ID | Tissue | Disease Stage | Description | Gene Ratio | Bg Ratio | pvalue | p.adjust | Count |
| GO:00096367 | Liver | NAFLD | response to toxic substance | 41/1882 | 262/18723 | 2.83e-03 | 2.57e-02 | 41 |
| GO:000963622 | Liver | HCC | response to toxic substance | 153/7958 | 262/18723 | 1.37e-07 | 2.58e-06 | 153 |
| GO:009875412 | Liver | HCC | detoxification | 87/7958 | 152/18723 | 1.70e-04 | 1.35e-03 | 87 |
| GO:1901264 | Liver | HCC | carbohydrate derivative transport | 48/7958 | 80/18723 | 1.19e-03 | 6.62e-03 | 48 |
| Page: 1 |
| Pathway ID | Tissue | Disease Stage | Description | Gene Ratio | Bg Ratio | pvalue | p.adjust | qvalue | Count |
| Page: 1 |
Top |
Cell-cell communication analysis |
| Identification of potential cell-cell interactions between two cell types and their ligand-receptor pairs for different disease states |
| Ligand | Receptor | LRpair | Pathway | Tissue | Disease Stage |
| Page: 1 |
Top |
Single-cell gene regulatory network inference analysis |
| Find out the significant the regulons (TFs) and the target genes of each regulon across cell types for different disease states |
| TF | Cell Type | Tissue | Disease Stage | Target Gene | RSS | Regulon Activity |
| ∗The dot plots of a searched regulon are shown for all cell subpopulations in each disease state of each tissue based on the regulon specific score inferred using pySCENIC and by calculating the average expression. |
| Page: 1 |
Top |
Somatic mutation of malignant transformation related genes |
| Annotation of somatic variants for genes involved in malignant transformation |
| Hugo Symbol | Variant Class | Variant Classification | dbSNP RS | HGVSc | HGVSp | HGVSp Short | SWISSPROT | BIOTYPE | SIFT | PolyPhen | Tumor Sample Barcode | Tissue | Histology | Sex | Age | Stage | Therapy Types | Drugs | Outcome |
| SLC17A3 | SNV | Missense_Mutation | c.621N>T | p.Leu207Phe | p.L207F | O00476 | protein_coding | tolerated(0.64) | benign(0.034) | TCGA-A8-A09V-01 | Breast | breast invasive carcinoma | Female | <65 | I/II | Hormone Therapy | tamoxiphen | SD | |
| SLC17A3 | SNV | Missense_Mutation | c.939N>T | p.Met313Ile | p.M313I | O00476 | protein_coding | tolerated(0.89) | benign(0.006) | TCGA-B6-A0I8-01 | Breast | breast invasive carcinoma | Female | <65 | I/II | Unknown | Unknown | PD | |
| SLC17A3 | SNV | Missense_Mutation | c.137A>G | p.His46Arg | p.H46R | O00476 | protein_coding | deleterious(0) | possibly_damaging(0.781) | TCGA-BH-A0AV-01 | Breast | breast invasive carcinoma | Female | <65 | I/II | Chemotherapy | taxotere | CR | |
| SLC17A3 | insertion | Nonsense_Mutation | novel | c.128_129insATAATGAAGAGAATAATAAATTGATCAAAACTAACC | p.Leu43_Val44insTer | p.L43_V44ins* | O00476 | protein_coding | TCGA-A8-A06O-01 | Breast | breast invasive carcinoma | Female | <65 | I/II | Hormone Therapy | letrozole | SD | ||
| SLC17A3 | insertion | Nonsense_Mutation | novel | c.54_55insTACTATGTGTAGACAATTCAGTAGCAATTATCAA | p.Asp19TyrfsTer4 | p.D19Yfs*4 | O00476 | protein_coding | TCGA-AR-A0U2-01 | Breast | breast invasive carcinoma | Female | <65 | III/IV | Hormone Therapy | tamoxiphen | PD | ||
| SLC17A3 | insertion | In_Frame_Ins | novel | c.1050_1051insATCCCACATATCACCACTAAAGAACTTACTCGTGTAACCAAATAT | p.Gly350_Gly351insIleProHisIleThrThrLysGluLeuThrArgValThrLysTyr | p.G350_G351insIPHITTKELTRVTKY | O00476 | protein_coding | TCGA-BH-A0HF-01 | Breast | breast invasive carcinoma | Female | >=65 | I/II | Hormone Therapy | arimidex | SD | ||
| SLC17A3 | deletion | Frame_Shift_Del | novel | c.436delN | p.Ser146LeufsTer20 | p.S146Lfs*20 | O00476 | protein_coding | TCGA-EW-A2FV-01 | Breast | breast invasive carcinoma | Female | <65 | III/IV | Chemotherapy | docetaxel | SD | ||
| SLC17A3 | SNV | Missense_Mutation | c.12N>T | p.Lys4Asn | p.K4N | O00476 | protein_coding | tolerated(0.5) | benign(0.045) | TCGA-FU-A3HZ-01 | Cervix | cervical & endocervical cancer | Female | <65 | I/II | Chemotherapy | cisplatin | CR | |
| SLC17A3 | SNV | Missense_Mutation | c.709N>C | p.Phe237Leu | p.F237L | O00476 | protein_coding | tolerated(0.05) | benign(0.072) | TCGA-FU-A3TQ-01 | Cervix | cervical & endocervical cancer | Female | <65 | III/IV | Unknown | Unknown | SD | |
| SLC17A3 | SNV | Missense_Mutation | novel | c.41N>T | p.Ser14Ile | p.S14I | O00476 | protein_coding | tolerated(0.26) | benign(0.005) | TCGA-AA-3710-01 | Colorectum | colon adenocarcinoma | Female | >=65 | I/II | Unknown | Unknown | SD |
| Page: 1 2 3 4 5 6 7 8 9 |
Top |
Related drugs of malignant transformation related genes |
| Identification of chemicals and drugs interact with genes involved in malignant transfromation |
| (DGIdb 4.0) |
| Entrez ID | Symbol | Category | Interaction Types | Drug Claim Name | Drug Name | PMIDs |
| Page: 1 |

Copyright 2023-Present -The University of Texas Health Science Center at Houston |