| Tissue | Expression Dynamics | Abbreviation |
| Colorectum (GSE201348) |  | FAP: Familial adenomatous polyposis |
| CRC: Colorectal cancer |
| Colorectum (HTA11) | 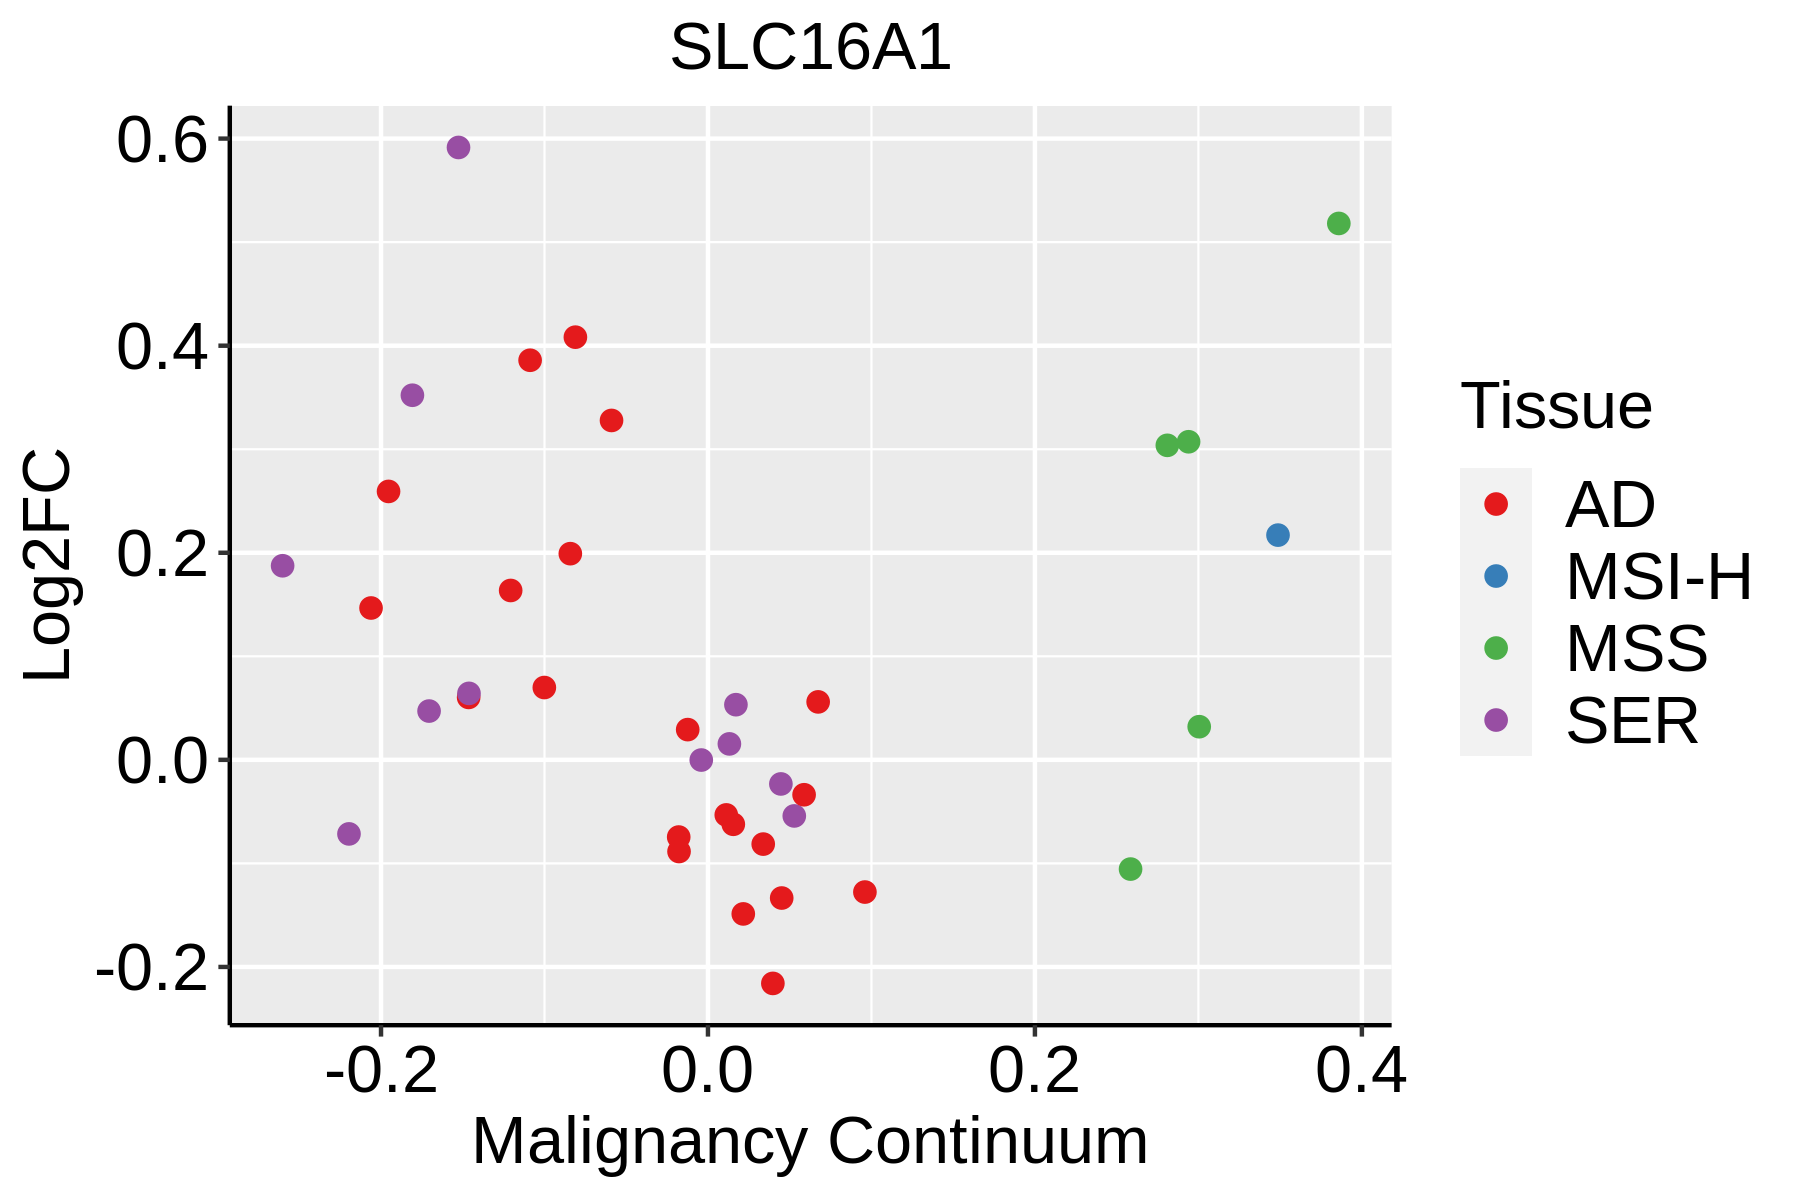 | AD: Adenomas |
| SER: Sessile serrated lesions |
| MSI-H: Microsatellite-high colorectal cancer |
| MSS: Microsatellite stable colorectal cancer |
| Esophagus | 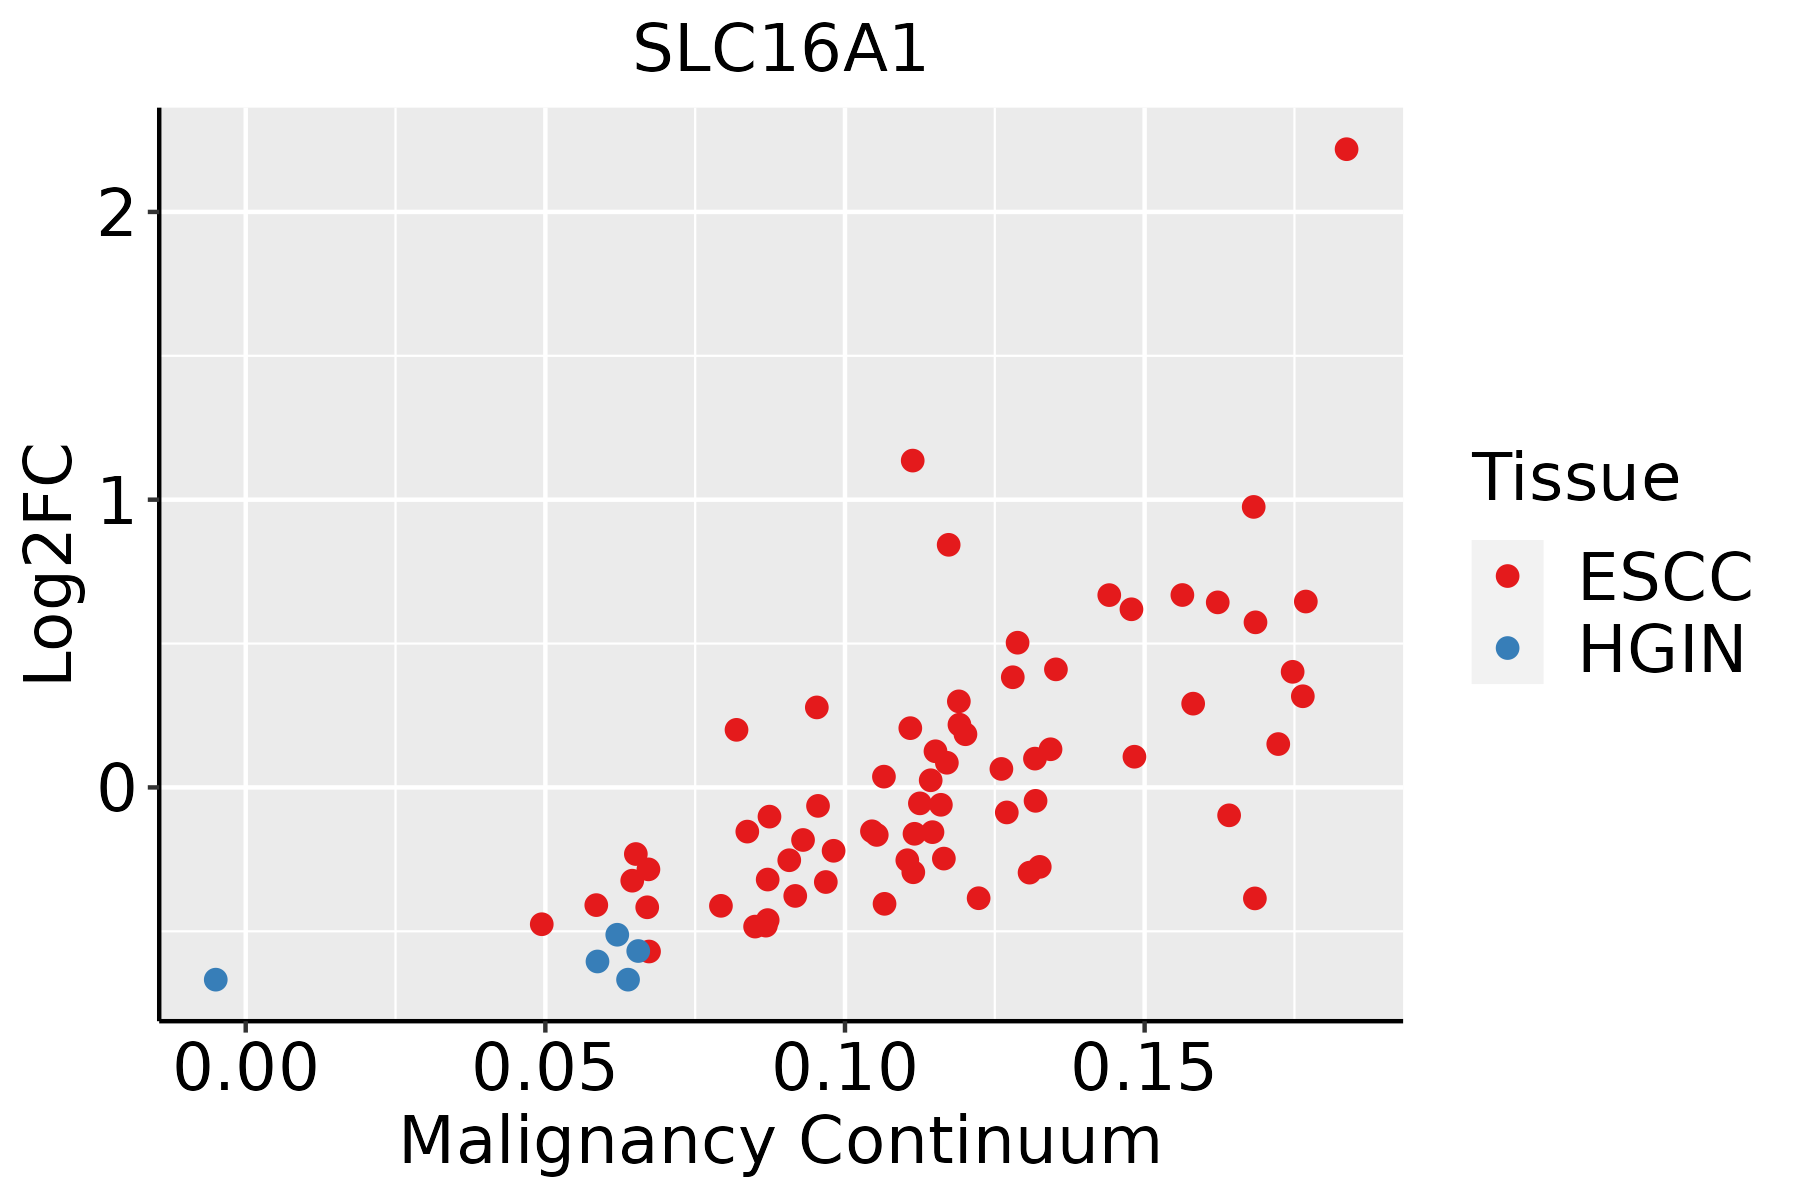 | ESCC: Esophageal squamous cell carcinoma |
| HGIN: High-grade intraepithelial neoplasias |
| LGIN: Low-grade intraepithelial neoplasias |
| Liver | 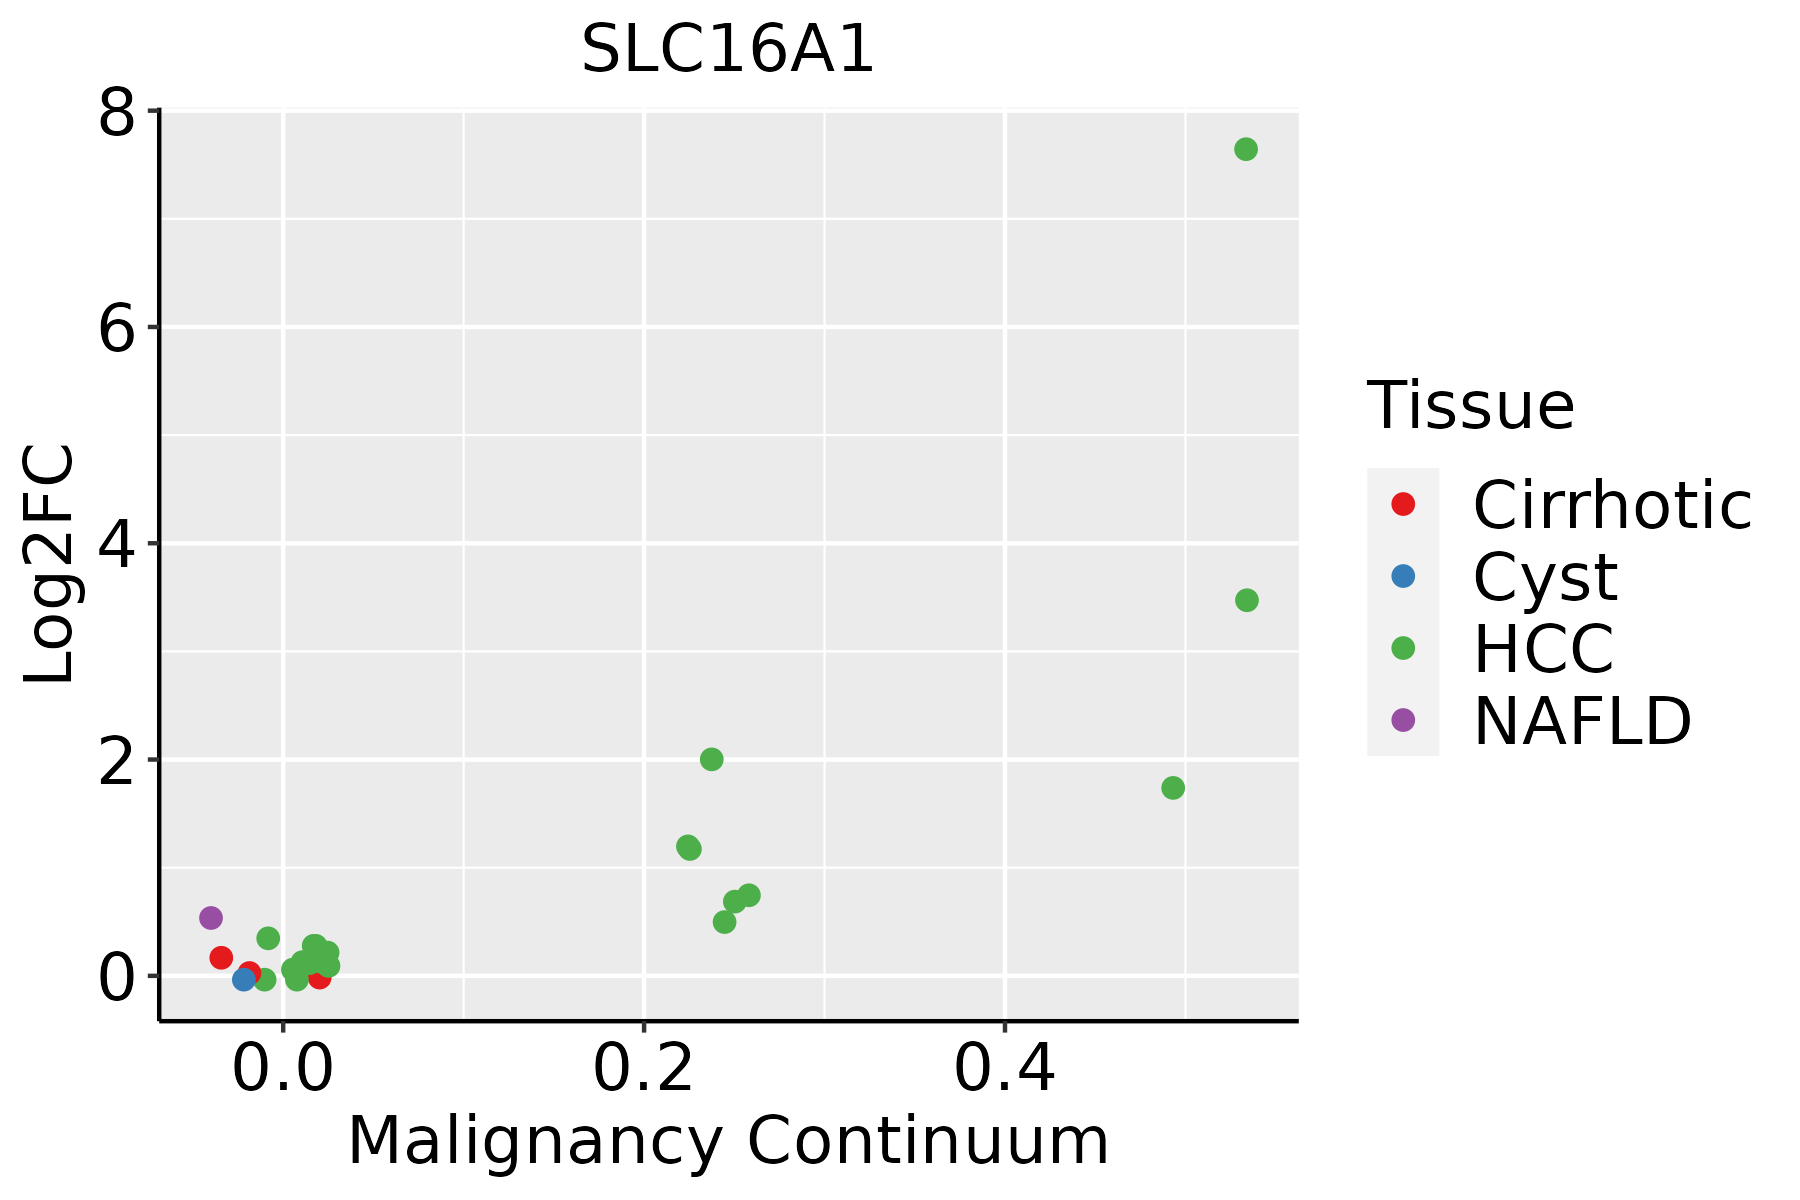 | HCC: Hepatocellular carcinoma |
| NAFLD: Non-alcoholic fatty liver disease |
| Oral Cavity | 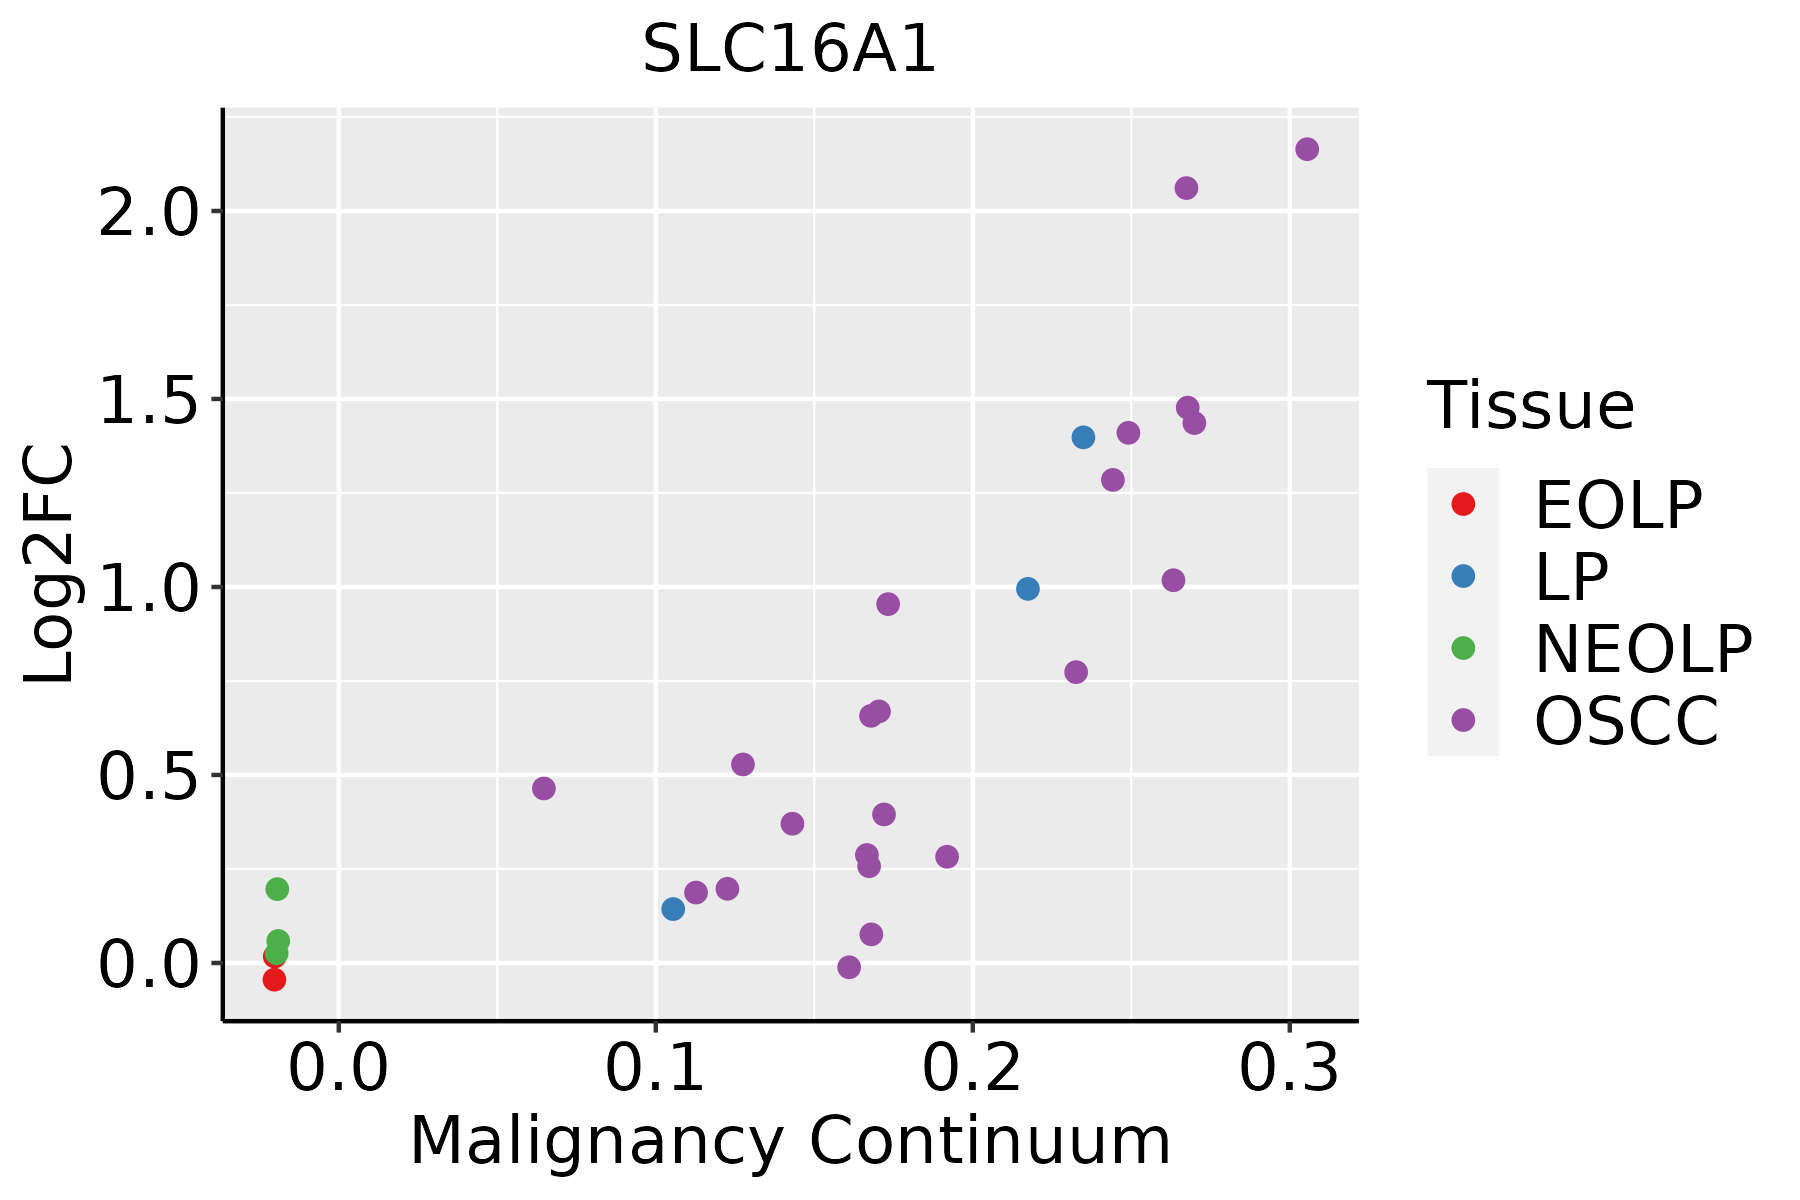 | EOLP: Erosive Oral lichen planus |
| LP: leukoplakia |
| NEOLP: Non-erosive oral lichen planus |
| OSCC: Oral squamous cell carcinoma |
| Skin | 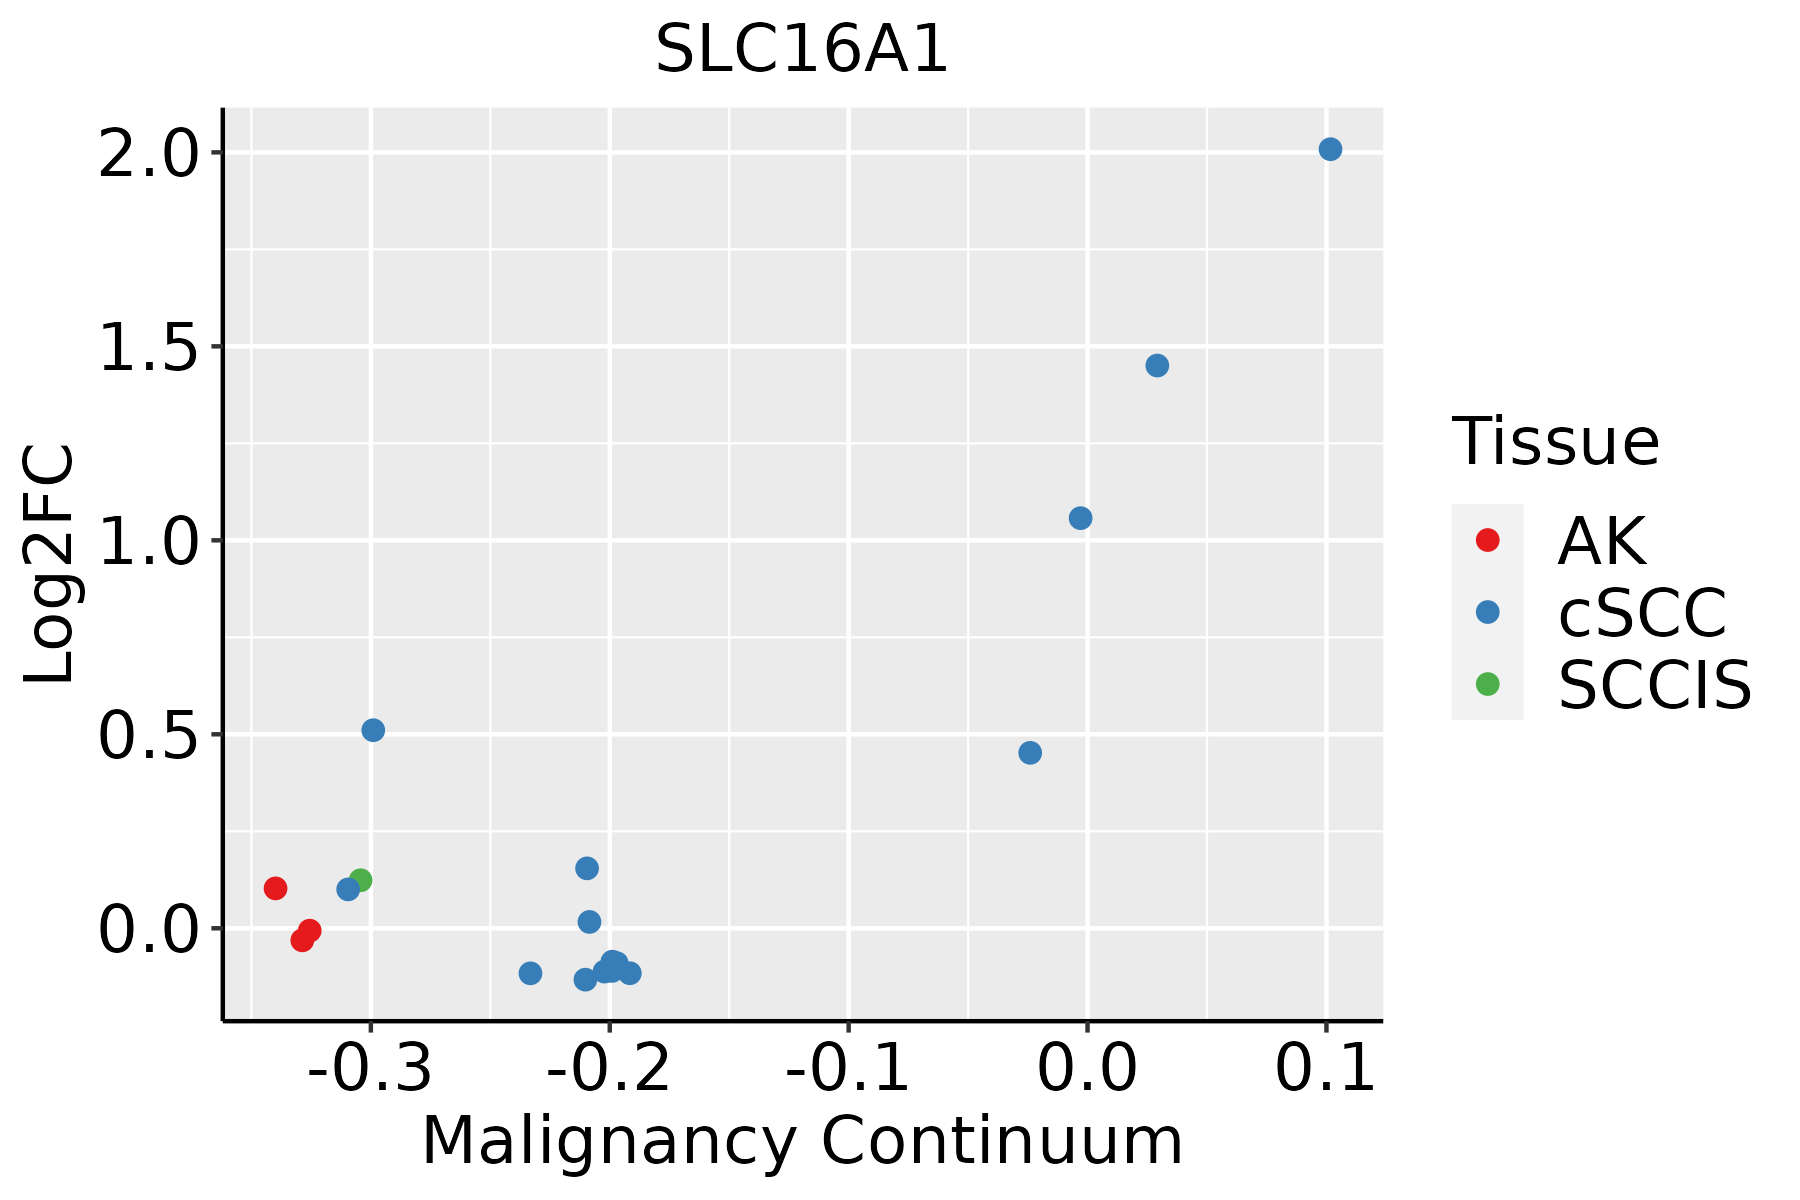 | AK: Actinic keratosis |
| cSCC: Cutaneous squamous cell carcinoma |
| SCCIS:squamous cell carcinoma in situ |
| Thyroid | 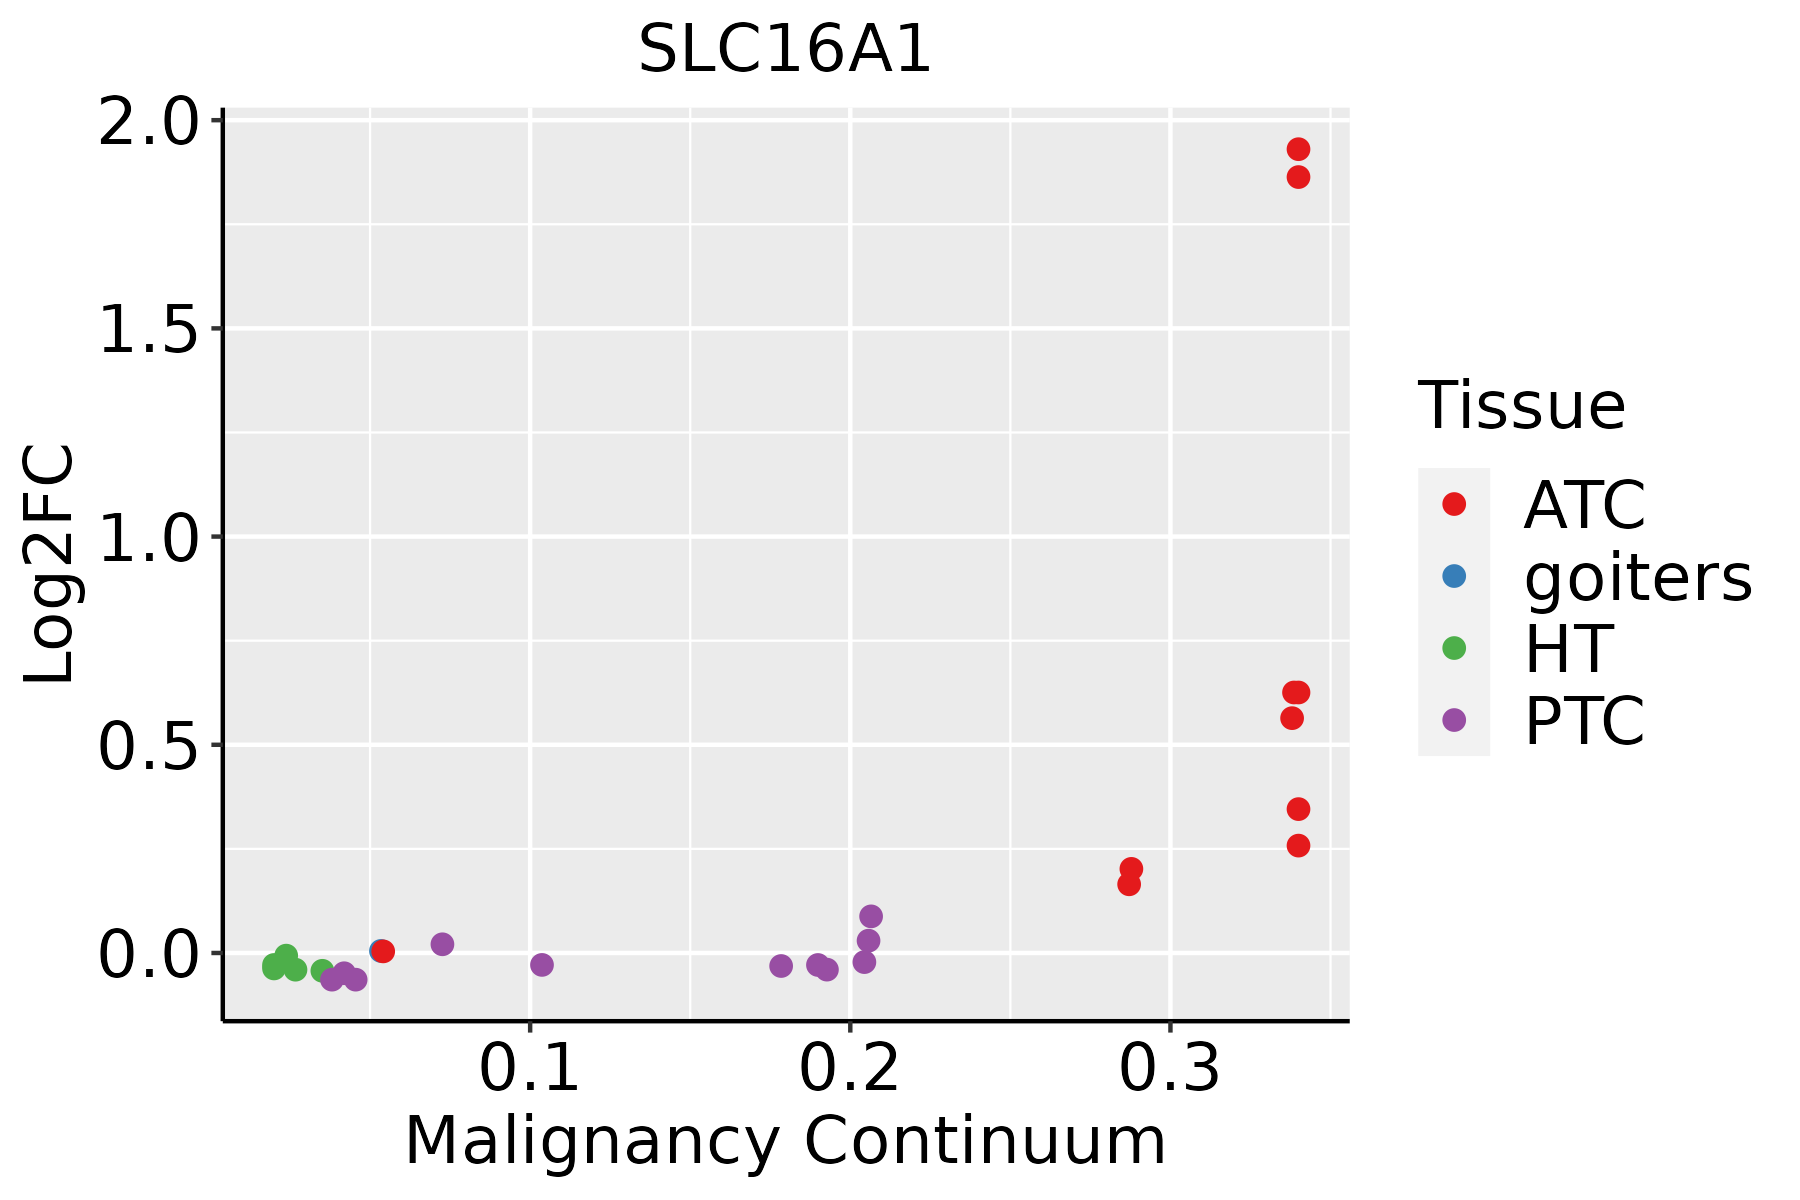 | ATC: Anaplastic thyroid cancer |
| HT: Hashimoto's thyroiditis |
| PTC: Papillary thyroid cancer |
| GO ID | Tissue | Disease Stage | Description | Gene Ratio | Bg Ratio | pvalue | p.adjust | Count |
| GO:0033500 | Colorectum | AD | carbohydrate homeostasis | 84/3918 | 259/18723 | 9.10e-06 | 2.15e-04 | 84 |
| GO:0031667 | Colorectum | AD | response to nutrient levels | 138/3918 | 474/18723 | 1.22e-05 | 2.68e-04 | 138 |
| GO:0042593 | Colorectum | AD | glucose homeostasis | 83/3918 | 258/18723 | 1.44e-05 | 3.11e-04 | 83 |
| GO:0050708 | Colorectum | AD | regulation of protein secretion | 83/3918 | 268/18723 | 6.59e-05 | 1.07e-03 | 83 |
| GO:0009306 | Colorectum | AD | protein secretion | 105/3918 | 359/18723 | 1.05e-04 | 1.57e-03 | 105 |
| GO:0035592 | Colorectum | AD | establishment of protein localization to extracellular region | 105/3918 | 360/18723 | 1.18e-04 | 1.73e-03 | 105 |
| GO:0071692 | Colorectum | AD | protein localization to extracellular region | 106/3918 | 368/18723 | 1.86e-04 | 2.49e-03 | 106 |
| GO:0050796 | Colorectum | AD | regulation of insulin secretion | 54/3918 | 165/18723 | 2.60e-04 | 3.25e-03 | 54 |
| GO:0030073 | Colorectum | AD | insulin secretion | 61/3918 | 195/18723 | 4.28e-04 | 4.81e-03 | 61 |
| GO:0015833 | Colorectum | AD | peptide transport | 77/3918 | 264/18723 | 8.90e-04 | 8.60e-03 | 77 |
| GO:0090087 | Colorectum | AD | regulation of peptide transport | 60/3918 | 202/18723 | 1.94e-03 | 1.58e-02 | 60 |
| GO:0030072 | Colorectum | AD | peptide hormone secretion | 68/3918 | 236/18723 | 2.39e-03 | 1.85e-02 | 68 |
| GO:0002791 | Colorectum | AD | regulation of peptide secretion | 59/3918 | 200/18723 | 2.50e-03 | 1.92e-02 | 59 |
| GO:0090276 | Colorectum | AD | regulation of peptide hormone secretion | 58/3918 | 196/18723 | 2.51e-03 | 1.92e-02 | 58 |
| GO:0002790 | Colorectum | AD | peptide secretion | 69/3918 | 242/18723 | 2.97e-03 | 2.22e-02 | 69 |
| GO:0042886 | Colorectum | AD | amide transport | 83/3918 | 301/18723 | 3.37e-03 | 2.46e-02 | 83 |
| GO:00316671 | Colorectum | SER | response to nutrient levels | 106/2897 | 474/18723 | 3.94e-05 | 1.00e-03 | 106 |
| GO:00507081 | Colorectum | SER | regulation of protein secretion | 63/2897 | 268/18723 | 3.42e-04 | 5.39e-03 | 63 |
| GO:00093061 | Colorectum | SER | protein secretion | 79/2897 | 359/18723 | 5.99e-04 | 8.19e-03 | 79 |
| GO:00355921 | Colorectum | SER | establishment of protein localization to extracellular region | 79/2897 | 360/18723 | 6.54e-04 | 8.77e-03 | 79 |
| Hugo Symbol | Variant Class | Variant Classification | dbSNP RS | HGVSc | HGVSp | HGVSp Short | SWISSPROT | BIOTYPE | SIFT | PolyPhen | Tumor Sample Barcode | Tissue | Histology | Sex | Age | Stage | Therapy Types | Drugs | Outcome |
| SLC16A1 | SNV | Missense_Mutation | rs151166713 | c.1285G>A | p.Val429Ile | p.V429I | P53985 | protein_coding | tolerated(1) | benign(0.012) | TCGA-A2-A25E-01 | Breast | breast invasive carcinoma | Female | <65 | III/IV | Chemotherapy | cytoxan | PD |
| SLC16A1 | SNV | Missense_Mutation | novel | c.1007C>T | p.Ser336Phe | p.S336F | P53985 | protein_coding | deleterious(0) | probably_damaging(0.981) | TCGA-AC-A23H-01 | Breast | breast invasive carcinoma | Female | >=65 | I/II | Unknown | Unknown | PD |
| SLC16A1 | SNV | Missense_Mutation | | c.402G>T | p.Met134Ile | p.M134I | P53985 | protein_coding | tolerated(0.56) | benign(0.013) | TCGA-AC-A23H-01 | Breast | breast invasive carcinoma | Female | >=65 | I/II | Unknown | Unknown | PD |
| SLC16A1 | SNV | Missense_Mutation | rs759149434 | c.256C>T | p.Arg86Cys | p.R86C | P53985 | protein_coding | deleterious(0) | probably_damaging(1) | TCGA-AN-A046-01 | Breast | breast invasive carcinoma | Female | >=65 | I/II | Unknown | Unknown | SD |
| SLC16A1 | SNV | Missense_Mutation | novel | c.992N>G | p.Tyr331Cys | p.Y331C | P53985 | protein_coding | deleterious(0.01) | probably_damaging(0.999) | TCGA-D8-A13Z-01 | Breast | breast invasive carcinoma | Female | <65 | I/II | Chemotherapy | doxorubicine | SD |
| SLC16A1 | SNV | Missense_Mutation | | c.867N>C | p.Lys289Asn | p.K289N | P53985 | protein_coding | deleterious(0) | probably_damaging(0.997) | TCGA-D8-A27G-01 | Breast | breast invasive carcinoma | Female | >=65 | I/II | Unknown | Unknown | SD |
| SLC16A1 | SNV | Missense_Mutation | rs746931470 | c.1250N>A | p.Gly417Glu | p.G417E | P53985 | protein_coding | deleterious(0.02) | possibly_damaging(0.597) | TCGA-E2-A15K-06 | Breast | breast invasive carcinoma | Female | <65 | I/II | Chemotherapy | adriamycin | SD |
| SLC16A1 | SNV | Missense_Mutation | | c.81C>G | p.Phe27Leu | p.F27L | P53985 | protein_coding | deleterious(0.01) | probably_damaging(0.995) | TCGA-E2-A1IH-01 | Breast | breast invasive carcinoma | Female | >=65 | I/II | Hormone Therapy | aromasin | SD |
| SLC16A1 | insertion | Frame_Shift_Ins | rs606231309 | c.41dupC | p.Asp15ArgfsTer34 | p.D15Rfs*34 | P53985 | protein_coding | | | TCGA-AN-A0FV-01 | Breast | breast invasive carcinoma | Female | <65 | I/II | Unknown | Unknown | SD |
| SLC16A1 | SNV | Missense_Mutation | novel | c.1499N>G | p.Val500Gly | p.V500G | P53985 | protein_coding | deleterious_low_confidence(0) | possibly_damaging(0.637) | TCGA-EA-A3HS-01 | Cervix | cervical & endocervical cancer | Female | <65 | I/II | Unknown | Unknown | SD |
| Entrez ID | Symbol | Category | Interaction Types | Drug Claim Name | Drug Name | PMIDs |
| 6566 | SLC16A1 | TRANSPORTER, EXTERNAL SIDE OF PLASMA MEMBRANE, DRUGGABLE GENOME | | BUTYRATE | | 11882670 |
| 6566 | SLC16A1 | TRANSPORTER, EXTERNAL SIDE OF PLASMA MEMBRANE, DRUGGABLE GENOME | | SODIUM BUTYRATE | | 11882670 |
| 6566 | SLC16A1 | TRANSPORTER, EXTERNAL SIDE OF PLASMA MEMBRANE, DRUGGABLE GENOME | inhibitor | 404859052 | | |
| 6566 | SLC16A1 | TRANSPORTER, EXTERNAL SIDE OF PLASMA MEMBRANE, DRUGGABLE GENOME | inhibitor | 252827471 | | |
| 6566 | SLC16A1 | TRANSPORTER, EXTERNAL SIDE OF PLASMA MEMBRANE, DRUGGABLE GENOME | | PMA | | 14525727 |
| 6566 | SLC16A1 | TRANSPORTER, EXTERNAL SIDE OF PLASMA MEMBRANE, DRUGGABLE GENOME | inhibitor | 384403683 | | |


