
|
|||||
|
 | |
| |
| |
| |
| |
| |
|
Gene: SLC15A4 |
Gene summary for SLC15A4 |
| Gene information | Species | Human | Gene symbol | SLC15A4 | Gene ID | 121260 |
| Gene name | solute carrier family 15 member 4 | |
| Gene Alias | FP12591 | |
| Cytomap | 12q24.33 | |
| Gene Type | protein-coding | GO ID | GO:0000018 | UniProtAcc | Q8N697 |
Top |
Malignant transformation analysis |
| Identification of the aberrant gene expression in precancerous and cancerous lesions by comparing the gene expression of stem-like cells in diseased tissues with normal stem cells |
| Entrez ID | Symbol | Replicates | Species | Organ | Tissue | Adj P-value | Log2FC | Malignancy |
| 121260 | SLC15A4 | HCC1_Meng | Human | Liver | HCC | 3.57e-53 | 9.47e-02 | 0.0246 |
| 121260 | SLC15A4 | HCC2_Meng | Human | Liver | HCC | 4.27e-08 | 2.28e-02 | 0.0107 |
| 121260 | SLC15A4 | HCC1 | Human | Liver | HCC | 1.12e-03 | 3.43e+00 | 0.5336 |
| 121260 | SLC15A4 | HCC2 | Human | Liver | HCC | 2.12e-04 | 2.30e+00 | 0.5341 |
| 121260 | SLC15A4 | S027 | Human | Liver | HCC | 4.74e-07 | 7.12e-01 | 0.2446 |
| 121260 | SLC15A4 | S028 | Human | Liver | HCC | 3.20e-12 | 5.97e-01 | 0.2503 |
| 121260 | SLC15A4 | S029 | Human | Liver | HCC | 1.24e-06 | 4.49e-01 | 0.2581 |
| 121260 | SLC15A4 | C04 | Human | Oral cavity | OSCC | 1.47e-04 | 2.96e-01 | 0.2633 |
| 121260 | SLC15A4 | C21 | Human | Oral cavity | OSCC | 1.34e-11 | 4.37e-01 | 0.2678 |
| 121260 | SLC15A4 | C30 | Human | Oral cavity | OSCC | 8.68e-20 | 7.17e-01 | 0.3055 |
| 121260 | SLC15A4 | C43 | Human | Oral cavity | OSCC | 4.12e-09 | 9.49e-02 | 0.1704 |
| 121260 | SLC15A4 | C51 | Human | Oral cavity | OSCC | 1.21e-02 | 2.78e-01 | 0.2674 |
| 121260 | SLC15A4 | C08 | Human | Oral cavity | OSCC | 4.75e-08 | 4.64e-02 | 0.1919 |
| 121260 | SLC15A4 | EOLP-1 | Human | Oral cavity | EOLP | 6.43e-15 | 5.35e-01 | -0.0202 |
| 121260 | SLC15A4 | NEOLP-3 | Human | Oral cavity | NEOLP | 2.83e-02 | 1.49e-01 | -0.0191 |
| 121260 | SLC15A4 | SYSMH1 | Human | Oral cavity | OSCC | 6.97e-07 | 1.37e-01 | 0.1127 |
| 121260 | SLC15A4 | SYSMH2 | Human | Oral cavity | OSCC | 5.59e-14 | 1.58e-01 | 0.2326 |
| 121260 | SLC15A4 | SYSMH3 | Human | Oral cavity | OSCC | 3.01e-17 | 3.54e-01 | 0.2442 |
| 121260 | SLC15A4 | SYSMH5 | Human | Oral cavity | OSCC | 1.48e-02 | 1.34e-01 | 0.0647 |
| 121260 | SLC15A4 | SYSMH6 | Human | Oral cavity | OSCC | 7.57e-08 | 1.44e-01 | 0.1275 |
| Page: 1 2 |
| Tissue | Expression Dynamics | Abbreviation |
| Liver | 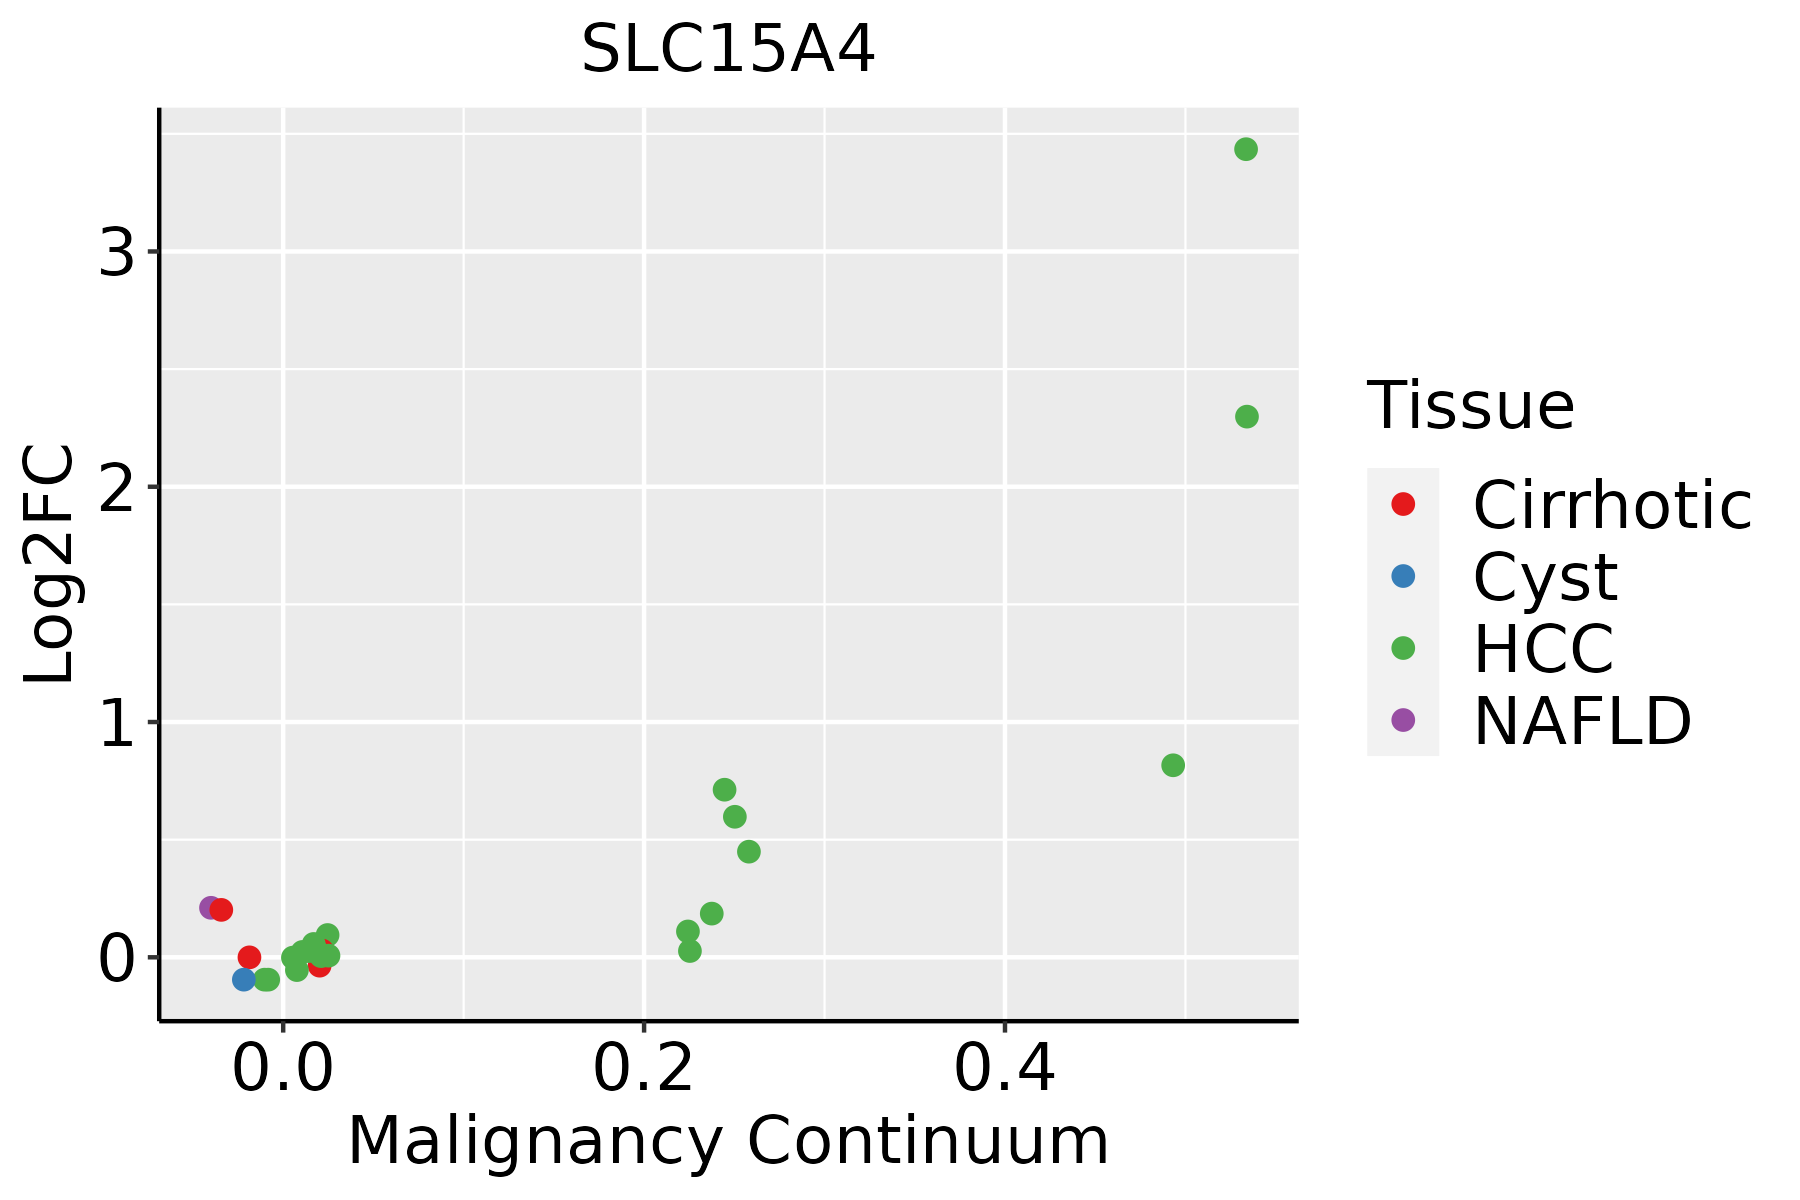 | HCC: Hepatocellular carcinoma |
| NAFLD: Non-alcoholic fatty liver disease | ||
| Oral Cavity |  | EOLP: Erosive Oral lichen planus |
| LP: leukoplakia | ||
| NEOLP: Non-erosive oral lichen planus | ||
| OSCC: Oral squamous cell carcinoma | ||
| Thyroid |  | ATC: Anaplastic thyroid cancer |
| HT: Hashimoto's thyroiditis | ||
| PTC: Papillary thyroid cancer |
| ∗log2FC in expression of this searched gene in stem-like cells from each diseased tissue sample relative to stem-like cells in normal samples in each tissue plotted against the malignancy continuum. Samples are colored based on if they are from different disease stage. |
Top |
Malignant transformation related pathway analysis |
| Find out the enriched GO biological processes and KEGG pathways involved in transition from healthy to precancer to cancer |
| Tissue | Disease Stage | Enriched GO biological Processes |
| Colorectum | AD |  |
| Colorectum | SER |  |
| Colorectum | MSS |  |
| Colorectum | MSI-H |  |
| Colorectum | FAP |  |
| ∗Top 15 enriched GO BP terms are showed in the bar plot of each disease state in each tissue. Each row represents a significant GO biological process which is colored according to the -log10(p.adjust). |
| Page: 1 2 3 4 5 6 7 8 9 |
| GO ID | Tissue | Disease Stage | Description | Gene Ratio | Bg Ratio | pvalue | p.adjust | Count |
| GO:003052222 | Liver | HCC | intracellular receptor signaling pathway | 171/7958 | 265/18723 | 3.00e-13 | 1.61e-11 | 171 |
| GO:000703421 | Liver | HCC | vacuolar transport | 108/7958 | 157/18723 | 2.22e-11 | 8.69e-10 | 108 |
| GO:00027533 | Liver | HCC | cytoplasmic pattern recognition receptor signaling pathway | 46/7958 | 60/18723 | 7.37e-08 | 1.49e-06 | 46 |
| GO:00022211 | Liver | HCC | pattern recognition receptor signaling pathway | 107/7958 | 172/18723 | 1.37e-07 | 2.58e-06 | 107 |
| GO:005105221 | Liver | HCC | regulation of DNA metabolic process | 198/7958 | 359/18723 | 7.62e-07 | 1.17e-05 | 198 |
| GO:000226222 | Liver | HCC | myeloid cell homeostasis | 93/7958 | 157/18723 | 1.67e-05 | 1.81e-04 | 93 |
| GO:004887222 | Liver | HCC | homeostasis of number of cells | 147/7958 | 272/18723 | 7.48e-05 | 6.70e-04 | 147 |
| GO:00028312 | Liver | HCC | regulation of response to biotic stimulus | 173/7958 | 327/18723 | 8.55e-05 | 7.48e-04 | 173 |
| GO:19026007 | Liver | HCC | proton transmembrane transport | 87/7958 | 157/18723 | 7.27e-04 | 4.42e-03 | 87 |
| GO:1901264 | Liver | HCC | carbohydrate derivative transport | 48/7958 | 80/18723 | 1.19e-03 | 6.62e-03 | 48 |
| GO:00358726 | Liver | HCC | nucleotide-binding domain, leucine rich repeat containing receptor signaling pathway | 19/7958 | 26/18723 | 1.57e-03 | 8.23e-03 | 19 |
| GO:00704236 | Liver | HCC | nucleotide-binding oligomerization domain containing signaling pathway | 18/7958 | 25/18723 | 2.74e-03 | 1.31e-02 | 18 |
| GO:0002224 | Liver | HCC | toll-like receptor signaling pathway | 67/7958 | 121/18723 | 2.87e-03 | 1.34e-02 | 67 |
| GO:00622072 | Liver | HCC | regulation of pattern recognition receptor signaling pathway | 59/7958 | 105/18723 | 3.18e-03 | 1.47e-02 | 59 |
| GO:00450881 | Liver | HCC | regulation of innate immune response | 113/7958 | 218/18723 | 3.27e-03 | 1.50e-02 | 113 |
| GO:0002200 | Liver | HCC | somatic diversification of immune receptors | 44/7958 | 77/18723 | 6.70e-03 | 2.72e-02 | 44 |
| GO:0016445 | Liver | HCC | somatic diversification of immunoglobulins | 38/7958 | 67/18723 | 1.32e-02 | 4.73e-02 | 38 |
| GO:005105210 | Oral cavity | OSCC | regulation of DNA metabolic process | 207/7305 | 359/18723 | 4.45e-13 | 2.17e-11 | 207 |
| GO:000703410 | Oral cavity | OSCC | vacuolar transport | 103/7305 | 157/18723 | 1.25e-11 | 4.44e-10 | 103 |
| GO:000226220 | Oral cavity | OSCC | myeloid cell homeostasis | 98/7305 | 157/18723 | 2.29e-09 | 5.34e-08 | 98 |
| Page: 1 2 3 4 5 6 7 |
| Pathway ID | Tissue | Disease Stage | Description | Gene Ratio | Bg Ratio | pvalue | p.adjust | qvalue | Count |
| Page: 1 |
Top |
Cell-cell communication analysis |
| Identification of potential cell-cell interactions between two cell types and their ligand-receptor pairs for different disease states |
| Ligand | Receptor | LRpair | Pathway | Tissue | Disease Stage |
| Page: 1 |
Top |
Single-cell gene regulatory network inference analysis |
| Find out the significant the regulons (TFs) and the target genes of each regulon across cell types for different disease states |
| TF | Cell Type | Tissue | Disease Stage | Target Gene | RSS | Regulon Activity |
| ∗The dot plots of a searched regulon are shown for all cell subpopulations in each disease state of each tissue based on the regulon specific score inferred using pySCENIC and by calculating the average expression. |
| Page: 1 |
Top |
Somatic mutation of malignant transformation related genes |
| Annotation of somatic variants for genes involved in malignant transformation |
| Hugo Symbol | Variant Class | Variant Classification | dbSNP RS | HGVSc | HGVSp | HGVSp Short | SWISSPROT | BIOTYPE | SIFT | PolyPhen | Tumor Sample Barcode | Tissue | Histology | Sex | Age | Stage | Therapy Types | Drugs | Outcome |
| SLC15A4 | SNV | Missense_Mutation | c.1311N>T | p.Gln437His | p.Q437H | Q8N697 | protein_coding | deleterious(0) | probably_damaging(0.976) | TCGA-A8-A07P-01 | Breast | breast invasive carcinoma | Female | >=65 | I/II | Chemotherapy | 5-fluorouracil | SD | |
| SLC15A4 | SNV | Missense_Mutation | novel | c.1709G>A | p.Gly570Asp | p.G570D | Q8N697 | protein_coding | deleterious(0.04) | benign(0.003) | TCGA-AN-A0AK-01 | Breast | breast invasive carcinoma | Female | >=65 | I/II | Unknown | Unknown | SD |
| SLC15A4 | SNV | Missense_Mutation | c.697G>C | p.Val233Leu | p.V233L | Q8N697 | protein_coding | tolerated(0.74) | benign(0.037) | TCGA-AR-A0TU-01 | Breast | breast invasive carcinoma | Female | <65 | I/II | Unspecific | Doxorubicin | SD | |
| SLC15A4 | deletion | Frame_Shift_Del | novel | c.711delN | p.Phe237LeufsTer28 | p.F237Lfs*28 | Q8N697 | protein_coding | TCGA-EW-A2FV-01 | Breast | breast invasive carcinoma | Female | <65 | III/IV | Chemotherapy | docetaxel | SD | ||
| SLC15A4 | SNV | Missense_Mutation | novel | c.1042C>T | p.His348Tyr | p.H348Y | Q8N697 | protein_coding | deleterious(0) | possibly_damaging(0.874) | TCGA-C5-A7X5-01 | Cervix | cervical & endocervical cancer | Female | >=65 | I/II | Chemotherapy | carboplatin | PD |
| SLC15A4 | SNV | Missense_Mutation | c.1420N>C | p.Glu474Gln | p.E474Q | Q8N697 | protein_coding | tolerated(0.06) | possibly_damaging(0.896) | TCGA-IR-A3LA-01 | Cervix | cervical & endocervical cancer | Female | <65 | I/II | Chemotherapy | cisplatin | CR | |
| SLC15A4 | SNV | Missense_Mutation | c.938A>G | p.Glu313Gly | p.E313G | Q8N697 | protein_coding | deleterious(0.03) | possibly_damaging(0.883) | TCGA-AA-3710-01 | Colorectum | colon adenocarcinoma | Female | >=65 | I/II | Unknown | Unknown | SD | |
| SLC15A4 | SNV | Missense_Mutation | rs376967004 | c.680N>T | p.Ala227Val | p.A227V | Q8N697 | protein_coding | tolerated(0.53) | benign(0.028) | TCGA-AA-3949-01 | Colorectum | colon adenocarcinoma | Female | >=65 | III/IV | Unknown | Unknown | SD |
| SLC15A4 | SNV | Missense_Mutation | rs372794236 | c.1694N>A | p.Arg565Gln | p.R565Q | Q8N697 | protein_coding | tolerated(0.15) | benign(0.013) | TCGA-AA-A01R-01 | Colorectum | colon adenocarcinoma | Male | <65 | III/IV | Chemotherapy | 5-fluorouracil | PD |
| SLC15A4 | SNV | Missense_Mutation | c.685N>T | p.Pro229Ser | p.P229S | Q8N697 | protein_coding | tolerated(0.05) | possibly_damaging(0.897) | TCGA-CA-6718-01 | Colorectum | colon adenocarcinoma | Male | <65 | I/II | Unknown | Unknown | PD |
| Page: 1 2 3 4 5 6 |
Top |
Related drugs of malignant transformation related genes |
| Identification of chemicals and drugs interact with genes involved in malignant transfromation |
| (DGIdb 4.0) |
| Entrez ID | Symbol | Category | Interaction Types | Drug Claim Name | Drug Name | PMIDs |
| 121260 | SLC15A4 | DRUGGABLE GENOME, TRANSPORTER | 178101385 | |||
| 121260 | SLC15A4 | DRUGGABLE GENOME, TRANSPORTER | 178101341 |
| Page: 1 |

Copyright 2023-Present -The University of Texas Health Science Center at Houston |