
|
|||||
|
 | |
| |
| |
| |
| |
| |
|
Gene: SLC15A3 |
Gene summary for SLC15A3 |
| Gene information | Species | Human | Gene symbol | SLC15A3 | Gene ID | 51296 |
| Gene name | solute carrier family 15 member 3 | |
| Gene Alias | OCTP | |
| Cytomap | 11q12.2 | |
| Gene Type | protein-coding | GO ID | GO:0002221 | UniProtAcc | Q8IY34 |
Top |
Malignant transformation analysis |
| Identification of the aberrant gene expression in precancerous and cancerous lesions by comparing the gene expression of stem-like cells in diseased tissues with normal stem cells |
| Entrez ID | Symbol | Replicates | Species | Organ | Tissue | Adj P-value | Log2FC | Malignancy |
| 51296 | SLC15A3 | P2T-E | Human | Esophagus | ESCC | 1.10e-19 | 4.16e-01 | 0.1177 |
| 51296 | SLC15A3 | P5T-E | Human | Esophagus | ESCC | 4.24e-11 | 2.61e-01 | 0.1327 |
| 51296 | SLC15A3 | P8T-E | Human | Esophagus | ESCC | 2.13e-05 | 7.99e-02 | 0.0889 |
| 51296 | SLC15A3 | P9T-E | Human | Esophagus | ESCC | 1.60e-05 | 2.07e-01 | 0.1131 |
| 51296 | SLC15A3 | P11T-E | Human | Esophagus | ESCC | 1.09e-19 | 7.22e-01 | 0.1426 |
| 51296 | SLC15A3 | P17T-E | Human | Esophagus | ESCC | 3.49e-02 | 2.23e-01 | 0.1278 |
| 51296 | SLC15A3 | P19T-E | Human | Esophagus | ESCC | 3.11e-07 | 5.57e-01 | 0.1662 |
| 51296 | SLC15A3 | P20T-E | Human | Esophagus | ESCC | 4.48e-12 | 2.82e-01 | 0.1124 |
| 51296 | SLC15A3 | P21T-E | Human | Esophagus | ESCC | 8.11e-13 | 3.56e-01 | 0.1617 |
| 51296 | SLC15A3 | P23T-E | Human | Esophagus | ESCC | 6.10e-20 | 5.06e-01 | 0.108 |
| 51296 | SLC15A3 | P24T-E | Human | Esophagus | ESCC | 5.82e-07 | 2.73e-01 | 0.1287 |
| 51296 | SLC15A3 | P27T-E | Human | Esophagus | ESCC | 5.47e-10 | 2.74e-01 | 0.1055 |
| 51296 | SLC15A3 | P31T-E | Human | Esophagus | ESCC | 1.41e-20 | 4.13e-01 | 0.1251 |
| 51296 | SLC15A3 | P32T-E | Human | Esophagus | ESCC | 1.14e-05 | 3.40e-01 | 0.1666 |
| 51296 | SLC15A3 | P36T-E | Human | Esophagus | ESCC | 3.11e-20 | 5.05e-01 | 0.1187 |
| 51296 | SLC15A3 | P38T-E | Human | Esophagus | ESCC | 3.69e-13 | 5.76e-01 | 0.127 |
| 51296 | SLC15A3 | P40T-E | Human | Esophagus | ESCC | 4.02e-11 | 3.83e-01 | 0.109 |
| 51296 | SLC15A3 | P47T-E | Human | Esophagus | ESCC | 1.23e-07 | 1.57e-01 | 0.1067 |
| 51296 | SLC15A3 | P49T-E | Human | Esophagus | ESCC | 4.10e-02 | 3.30e-01 | 0.1768 |
| 51296 | SLC15A3 | P52T-E | Human | Esophagus | ESCC | 2.18e-10 | 3.20e-01 | 0.1555 |
| Page: 1 2 3 |
| Tissue | Expression Dynamics | Abbreviation |
| Esophagus | 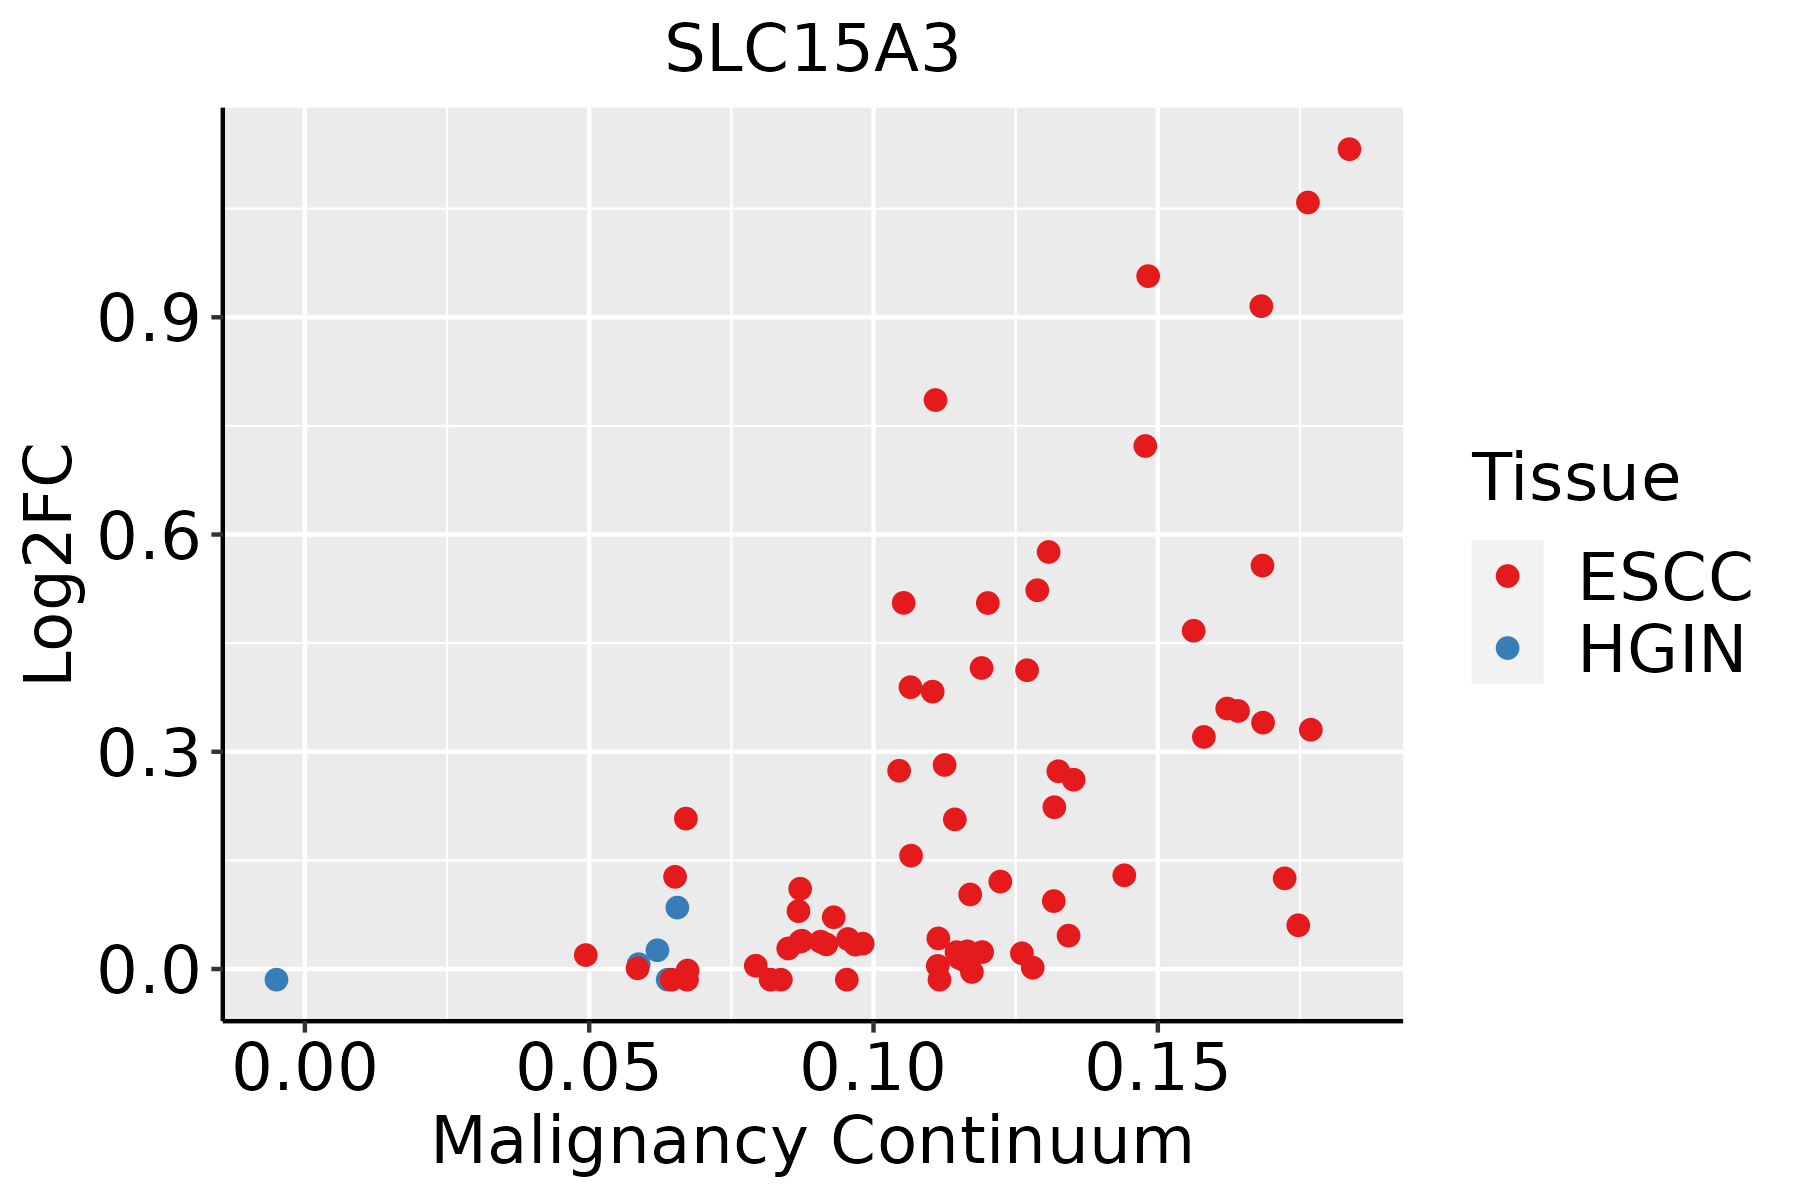 | ESCC: Esophageal squamous cell carcinoma |
| HGIN: High-grade intraepithelial neoplasias | ||
| LGIN: Low-grade intraepithelial neoplasias | ||
| Oral Cavity | 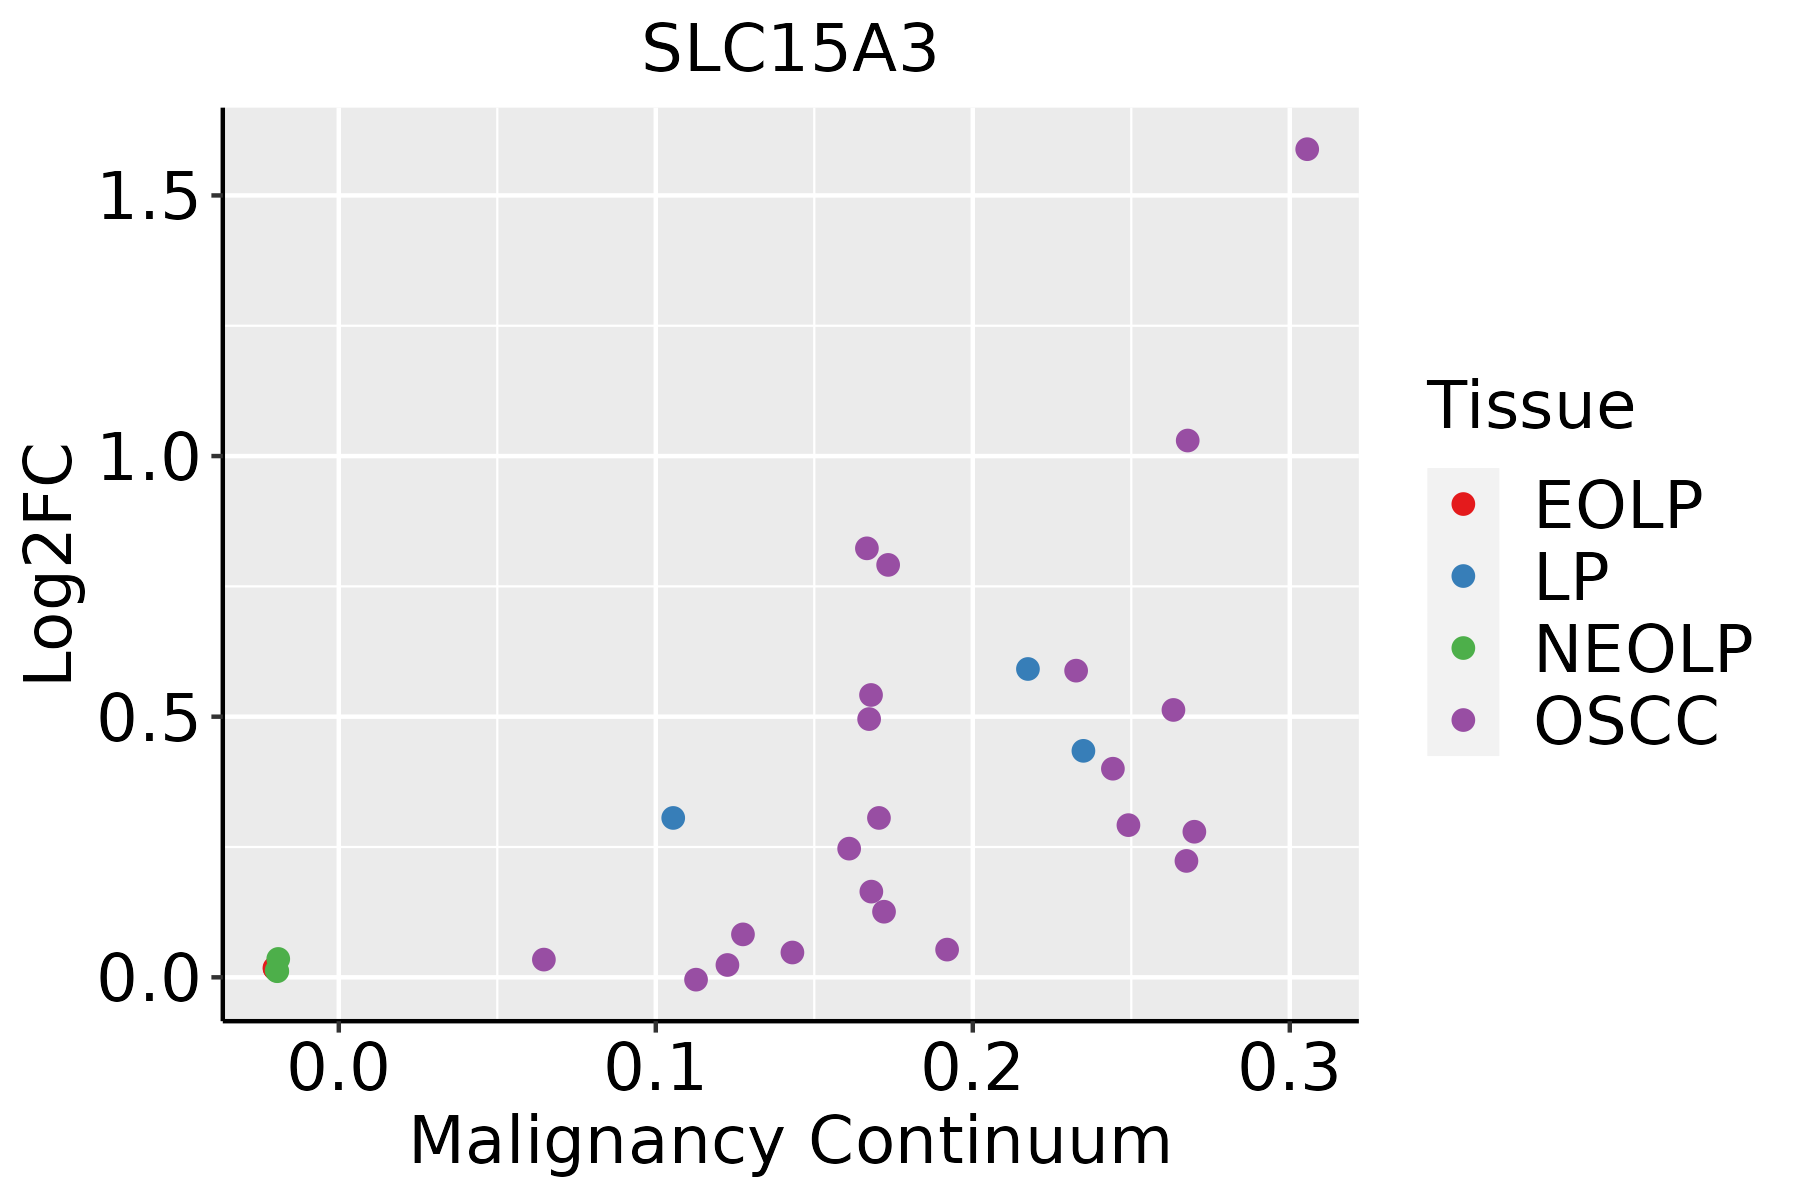 | EOLP: Erosive Oral lichen planus |
| LP: leukoplakia | ||
| NEOLP: Non-erosive oral lichen planus | ||
| OSCC: Oral squamous cell carcinoma |
| ∗log2FC in expression of this searched gene in stem-like cells from each diseased tissue sample relative to stem-like cells in normal samples in each tissue plotted against the malignancy continuum. Samples are colored based on if they are from different disease stage. |
Top |
Malignant transformation related pathway analysis |
| Find out the enriched GO biological processes and KEGG pathways involved in transition from healthy to precancer to cancer |
| Tissue | Disease Stage | Enriched GO biological Processes |
| Colorectum | AD |  |
| Colorectum | SER |  |
| Colorectum | MSS |  |
| Colorectum | MSI-H |  |
| Colorectum | FAP |  |
| ∗Top 15 enriched GO BP terms are showed in the bar plot of each disease state in each tissue. Each row represents a significant GO biological process which is colored according to the -log10(p.adjust). |
| Page: 1 2 3 4 5 6 7 8 9 |
| GO ID | Tissue | Disease Stage | Description | Gene Ratio | Bg Ratio | pvalue | p.adjust | Count |
| GO:0030522110 | Esophagus | ESCC | intracellular receptor signaling pathway | 170/8552 | 265/18723 | 8.58e-10 | 2.09e-08 | 170 |
| GO:000275313 | Esophagus | ESCC | cytoplasmic pattern recognition receptor signaling pathway | 41/8552 | 60/18723 | 3.25e-04 | 1.91e-03 | 41 |
| GO:190260018 | Esophagus | ESCC | proton transmembrane transport | 88/8552 | 157/18723 | 5.62e-03 | 2.10e-02 | 88 |
| GO:003052218 | Oral cavity | OSCC | intracellular receptor signaling pathway | 149/7305 | 265/18723 | 8.69e-09 | 1.81e-07 | 149 |
| GO:00022214 | Oral cavity | OSCC | pattern recognition receptor signaling pathway | 95/7305 | 172/18723 | 1.11e-05 | 1.15e-04 | 95 |
| GO:00027537 | Oral cavity | OSCC | cytoplasmic pattern recognition receptor signaling pathway | 40/7305 | 60/18723 | 1.32e-05 | 1.33e-04 | 40 |
| GO:00358729 | Oral cavity | OSCC | nucleotide-binding domain, leucine rich repeat containing receptor signaling pathway | 18/7305 | 26/18723 | 1.75e-03 | 8.28e-03 | 18 |
| GO:00622076 | Oral cavity | OSCC | regulation of pattern recognition receptor signaling pathway | 56/7305 | 105/18723 | 1.99e-03 | 9.23e-03 | 56 |
| GO:19012642 | Oral cavity | OSCC | carbohydrate derivative transport | 44/7305 | 80/18723 | 2.67e-03 | 1.16e-02 | 44 |
| GO:00027646 | Oral cavity | OSCC | immune response-regulating signaling pathway | 212/7305 | 468/18723 | 2.93e-03 | 1.27e-02 | 212 |
| GO:00704239 | Oral cavity | OSCC | nucleotide-binding oligomerization domain containing signaling pathway | 17/7305 | 25/18723 | 3.16e-03 | 1.36e-02 | 17 |
| GO:00622087 | Oral cavity | OSCC | positive regulation of pattern recognition receptor signaling pathway | 26/7305 | 44/18723 | 5.49e-03 | 2.13e-02 | 26 |
| GO:00704247 | Oral cavity | OSCC | regulation of nucleotide-binding oligomerization domain containing signaling pathway | 10/7305 | 13/18723 | 6.32e-03 | 2.35e-02 | 10 |
| GO:00068572 | Oral cavity | OSCC | oligopeptide transport | 11/7305 | 16/18723 | 1.56e-02 | 4.99e-02 | 11 |
| GO:003052219 | Oral cavity | LP | intracellular receptor signaling pathway | 87/4623 | 265/18723 | 1.63e-03 | 1.25e-02 | 87 |
| GO:19012641 | Oral cavity | LP | carbohydrate derivative transport | 31/4623 | 80/18723 | 3.69e-03 | 2.44e-02 | 31 |
| Page: 1 |
| Pathway ID | Tissue | Disease Stage | Description | Gene Ratio | Bg Ratio | pvalue | p.adjust | qvalue | Count |
| Page: 1 |
Top |
Cell-cell communication analysis |
| Identification of potential cell-cell interactions between two cell types and their ligand-receptor pairs for different disease states |
| Ligand | Receptor | LRpair | Pathway | Tissue | Disease Stage |
| Page: 1 |
Top |
Single-cell gene regulatory network inference analysis |
| Find out the significant the regulons (TFs) and the target genes of each regulon across cell types for different disease states |
| TF | Cell Type | Tissue | Disease Stage | Target Gene | RSS | Regulon Activity |
| ∗The dot plots of a searched regulon are shown for all cell subpopulations in each disease state of each tissue based on the regulon specific score inferred using pySCENIC and by calculating the average expression. |
| Page: 1 |
Top |
Somatic mutation of malignant transformation related genes |
| Annotation of somatic variants for genes involved in malignant transformation |
| Hugo Symbol | Variant Class | Variant Classification | dbSNP RS | HGVSc | HGVSp | HGVSp Short | SWISSPROT | BIOTYPE | SIFT | PolyPhen | Tumor Sample Barcode | Tissue | Histology | Sex | Age | Stage | Therapy Types | Drugs | Outcome |
| SLC15A3 | SNV | Missense_Mutation | novel | c.986N>G | p.Val329Gly | p.V329G | Q8IY34 | protein_coding | deleterious(0) | probably_damaging(0.999) | TCGA-B6-A1KF-01 | Breast | breast invasive carcinoma | Female | >=65 | I/II | Unknown | Unknown | SD |
| SLC15A3 | SNV | Missense_Mutation | c.956N>C | p.Val319Ala | p.V319A | Q8IY34 | protein_coding | deleterious(0) | possibly_damaging(0.681) | TCGA-D8-A1XK-01 | Breast | breast invasive carcinoma | Female | <65 | I/II | Chemotherapy | doxorubicine+cyclophosphamide | SD | |
| SLC15A3 | insertion | Frame_Shift_Ins | novel | c.1254_1255insGACAGAA | p.Phe419AspfsTer56 | p.F419Dfs*56 | Q8IY34 | protein_coding | TCGA-A2-A0EV-01 | Breast | breast invasive carcinoma | Female | >=65 | I/II | Unknown | Unknown | SD | ||
| SLC15A3 | insertion | In_Frame_Ins | novel | c.1441_1442insGAGCTCACTCAGATGGGGAGAGAACTG | p.Leu480_Glu481insGlyAlaHisSerAspGlyGluArgThr | p.L480_E481insGAHSDGERT | Q8IY34 | protein_coding | TCGA-C5-A7X8-01 | Cervix | cervical & endocervical cancer | Female | <65 | I/II | Chemotherapy | cisplatin | SD | ||
| SLC15A3 | SNV | Missense_Mutation | c.1537N>A | p.Leu513Ile | p.L513I | Q8IY34 | protein_coding | deleterious(0.04) | probably_damaging(0.994) | TCGA-AA-3663-01 | Colorectum | colon adenocarcinoma | Male | <65 | I/II | Unknown | Unknown | SD | |
| SLC15A3 | SNV | Missense_Mutation | rs138688557 | c.955N>A | p.Val319Ile | p.V319I | Q8IY34 | protein_coding | deleterious(0.02) | benign(0.102) | TCGA-AA-3713-01 | Colorectum | colon adenocarcinoma | Male | >=65 | III/IV | Chemotherapy | 5-fluorouracil | PR |
| SLC15A3 | SNV | Missense_Mutation | c.1480G>A | p.Ala494Thr | p.A494T | Q8IY34 | protein_coding | tolerated(0.06) | benign(0.416) | TCGA-AA-A00N-01 | Colorectum | colon adenocarcinoma | Male | >=65 | I/II | Unknown | Unknown | PD | |
| SLC15A3 | SNV | Missense_Mutation | rs771325349 | c.653C>T | p.Ala218Val | p.A218V | Q8IY34 | protein_coding | deleterious(0) | probably_damaging(0.937) | TCGA-AZ-4315-01 | Colorectum | colon adenocarcinoma | Male | <65 | I/II | Unknown | Unknown | SD |
| SLC15A3 | SNV | Missense_Mutation | c.865N>A | p.Arg289Ser | p.R289S | Q8IY34 | protein_coding | tolerated(0.82) | benign(0) | TCGA-AZ-6598-01 | Colorectum | colon adenocarcinoma | Female | >=65 | I/II | Unknown | Unknown | SD | |
| SLC15A3 | SNV | Missense_Mutation | c.818G>T | p.Cys273Phe | p.C273F | Q8IY34 | protein_coding | deleterious(0.01) | probably_damaging(0.999) | TCGA-DM-A28A-01 | Colorectum | colon adenocarcinoma | Male | >=65 | III/IV | Unknown | Unknown | SD |
| Page: 1 2 3 4 |
Top |
Related drugs of malignant transformation related genes |
| Identification of chemicals and drugs interact with genes involved in malignant transfromation |
| (DGIdb 4.0) |
| Entrez ID | Symbol | Category | Interaction Types | Drug Claim Name | Drug Name | PMIDs |
| 51296 | SLC15A3 | TRANSPORTER, DRUGGABLE GENOME | 178101341 | |||
| 51296 | SLC15A3 | TRANSPORTER, DRUGGABLE GENOME | 178101385 |
| Page: 1 |

Copyright 2023-Present -The University of Texas Health Science Center at Houston |