
|
|||||
|
 | |
| |
| |
| |
| |
| |
|
Gene: SLC15A2 |
Gene summary for SLC15A2 |
| Gene information | Species | Human | Gene symbol | SLC15A2 | Gene ID | 6565 |
| Gene name | solute carrier family 15 member 2 | |
| Gene Alias | PEPT2 | |
| Cytomap | 3q13.33 | |
| Gene Type | protein-coding | GO ID | GO:0002221 | UniProtAcc | Q16348 |
Top |
Malignant transformation analysis |
| Identification of the aberrant gene expression in precancerous and cancerous lesions by comparing the gene expression of stem-like cells in diseased tissues with normal stem cells |
| Entrez ID | Symbol | Replicates | Species | Organ | Tissue | Adj P-value | Log2FC | Malignancy |
| 6565 | SLC15A2 | HCC1_Meng | Human | Liver | HCC | 2.33e-07 | 3.41e-02 | 0.0246 |
| 6565 | SLC15A2 | HCC1 | Human | Liver | HCC | 7.77e-09 | 1.33e+00 | 0.5336 |
| 6565 | SLC15A2 | HCC2 | Human | Liver | HCC | 7.21e-18 | 1.38e+00 | 0.5341 |
| 6565 | SLC15A2 | HCC5 | Human | Liver | HCC | 1.19e-05 | 7.97e-01 | 0.4932 |
| 6565 | SLC15A2 | S016 | Human | Liver | HCC | 6.39e-06 | 1.56e-01 | 0.2243 |
| 6565 | SLC15A2 | C04 | Human | Oral cavity | OSCC | 3.41e-02 | 1.45e-01 | 0.2633 |
| 6565 | SLC15A2 | C21 | Human | Oral cavity | OSCC | 5.87e-17 | 4.93e-01 | 0.2678 |
| 6565 | SLC15A2 | C30 | Human | Oral cavity | OSCC | 1.33e-05 | 2.12e-01 | 0.3055 |
| 6565 | SLC15A2 | C38 | Human | Oral cavity | OSCC | 3.61e-03 | 2.61e-01 | 0.172 |
| 6565 | SLC15A2 | C46 | Human | Oral cavity | OSCC | 2.23e-02 | 8.75e-02 | 0.1673 |
| 6565 | SLC15A2 | C57 | Human | Oral cavity | OSCC | 9.78e-08 | 2.59e-01 | 0.1679 |
| 6565 | SLC15A2 | C08 | Human | Oral cavity | OSCC | 3.55e-18 | 3.53e-01 | 0.1919 |
| 6565 | SLC15A2 | LP15 | Human | Oral cavity | LP | 9.93e-03 | 5.97e-01 | 0.2174 |
| 6565 | SLC15A2 | LP17 | Human | Oral cavity | LP | 1.31e-06 | 5.09e-01 | 0.2349 |
| 6565 | SLC15A2 | SYSMH6 | Human | Oral cavity | OSCC | 1.71e-03 | 1.53e-01 | 0.1275 |
| 6565 | SLC15A2 | Dong_P1 | Human | Prostate | Tumor | 1.37e-10 | 1.69e-01 | 0.035 |
| 6565 | SLC15A2 | Dong_P3 | Human | Prostate | Tumor | 1.62e-02 | 8.40e-02 | 0.0278 |
| 6565 | SLC15A2 | GSM5353222_PA_PB2B_Pool_1_3_S52_L002 | Human | Prostate | Tumor | 1.89e-02 | 2.66e-01 | 0.1608 |
| Page: 1 |
| Tissue | Expression Dynamics | Abbreviation |
| Liver | 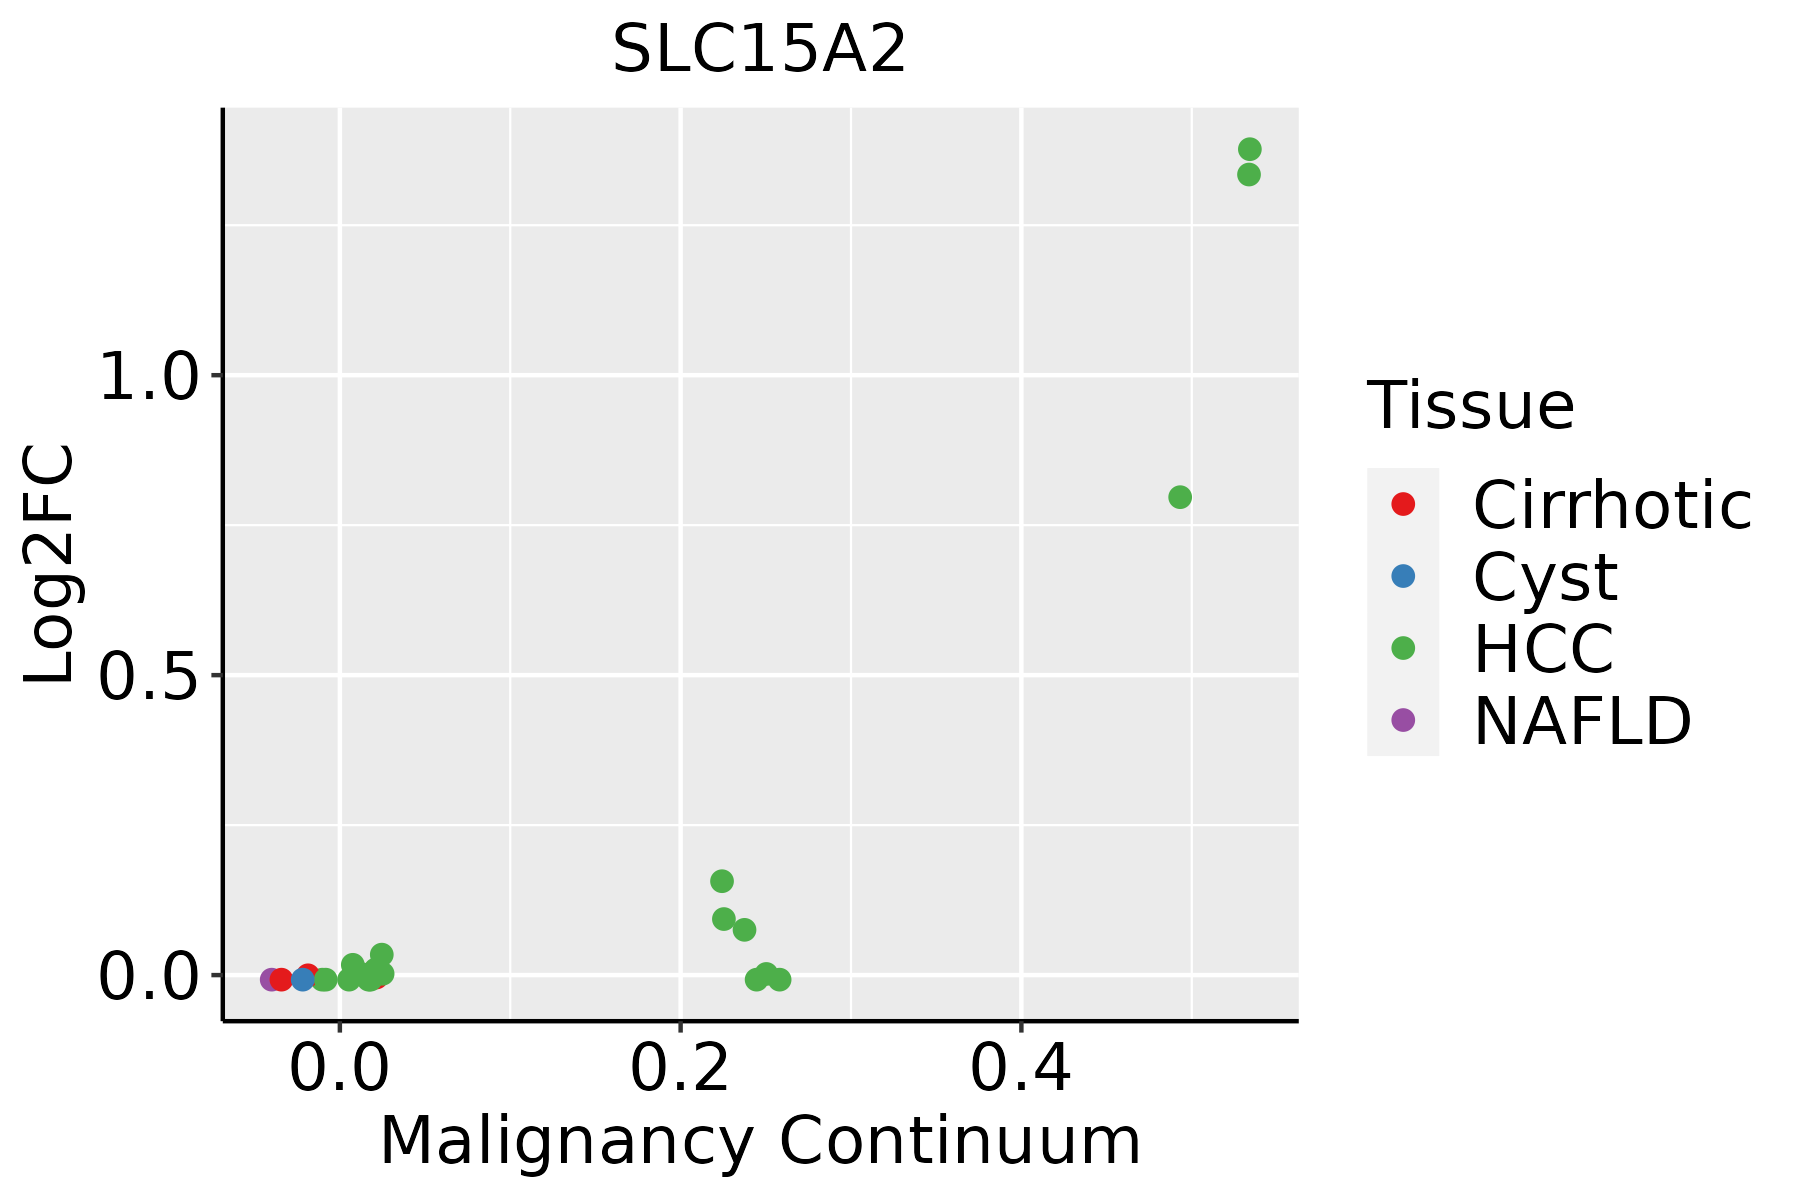 | HCC: Hepatocellular carcinoma |
| NAFLD: Non-alcoholic fatty liver disease | ||
| Oral Cavity | 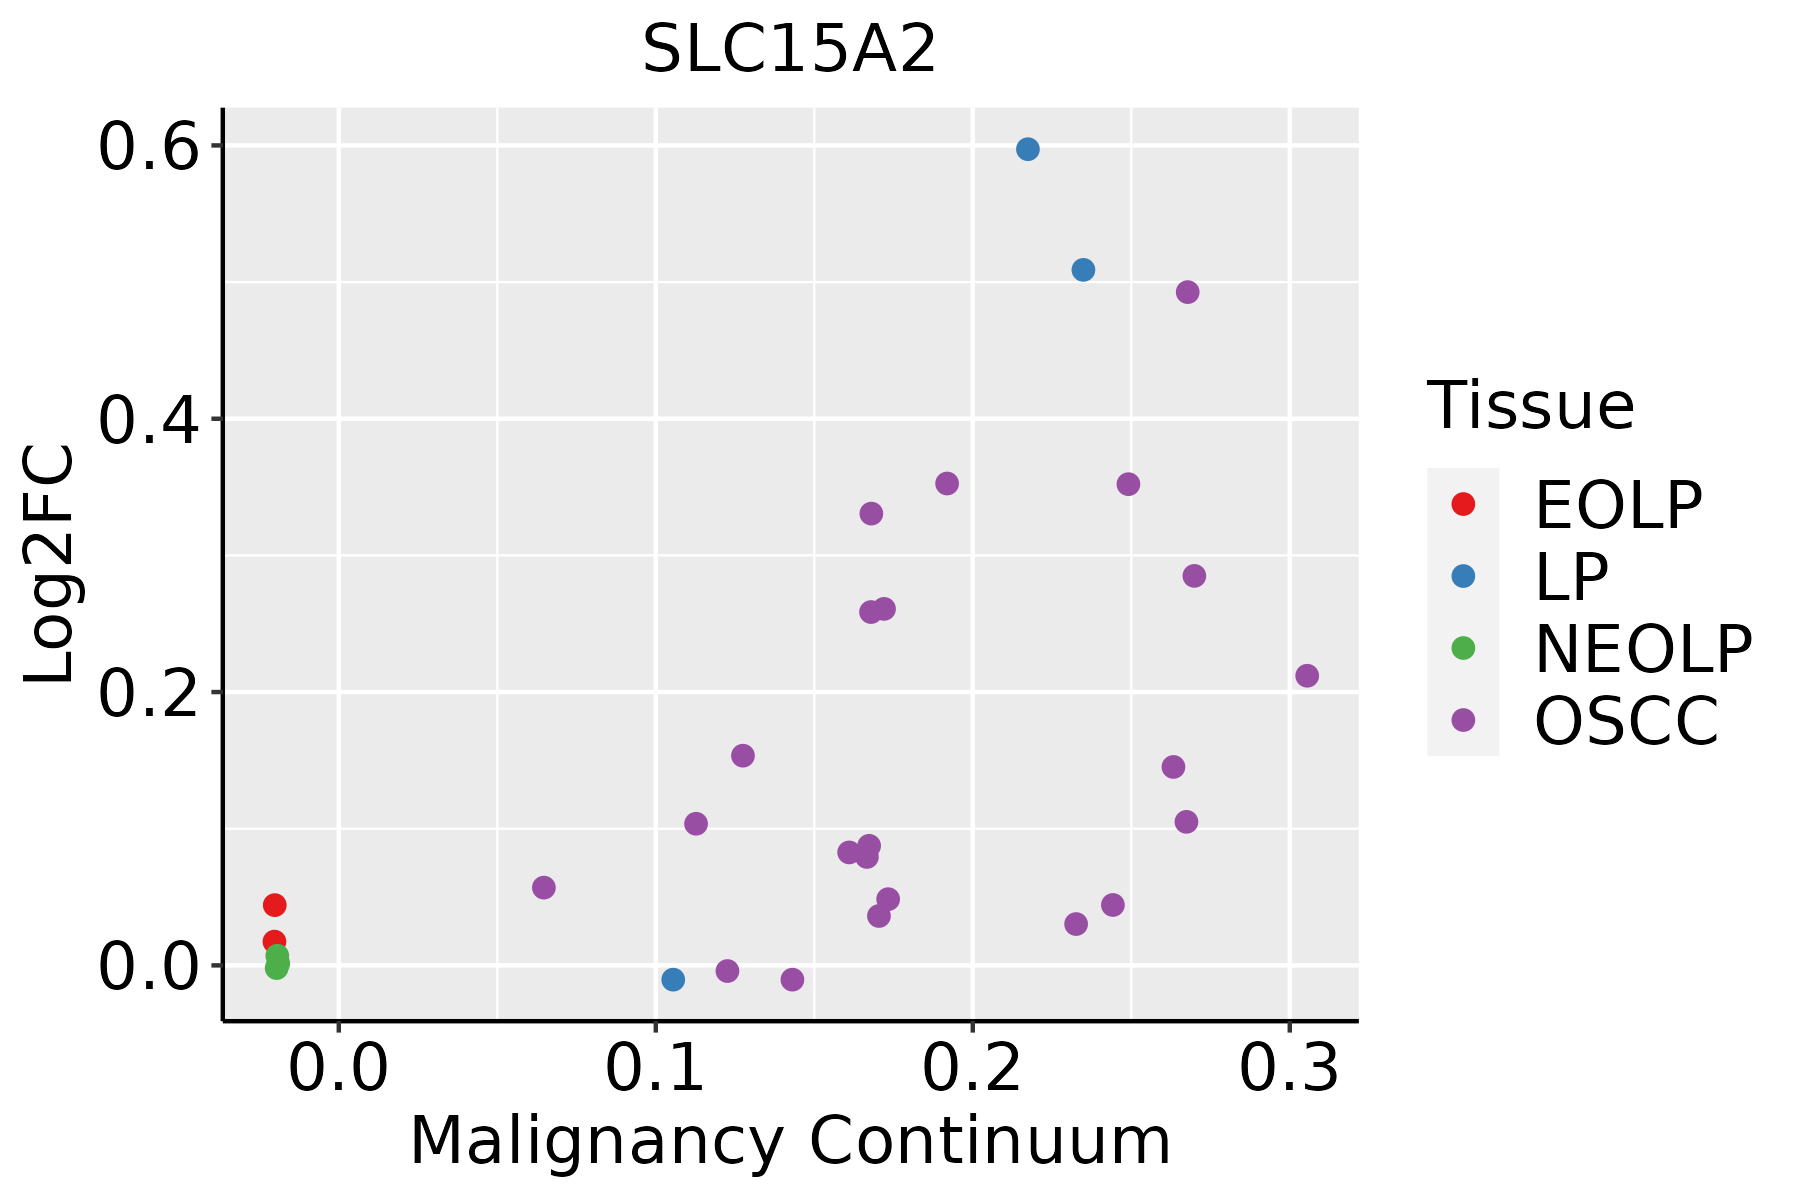 | EOLP: Erosive Oral lichen planus |
| LP: leukoplakia | ||
| NEOLP: Non-erosive oral lichen planus | ||
| OSCC: Oral squamous cell carcinoma | ||
| Prostate | 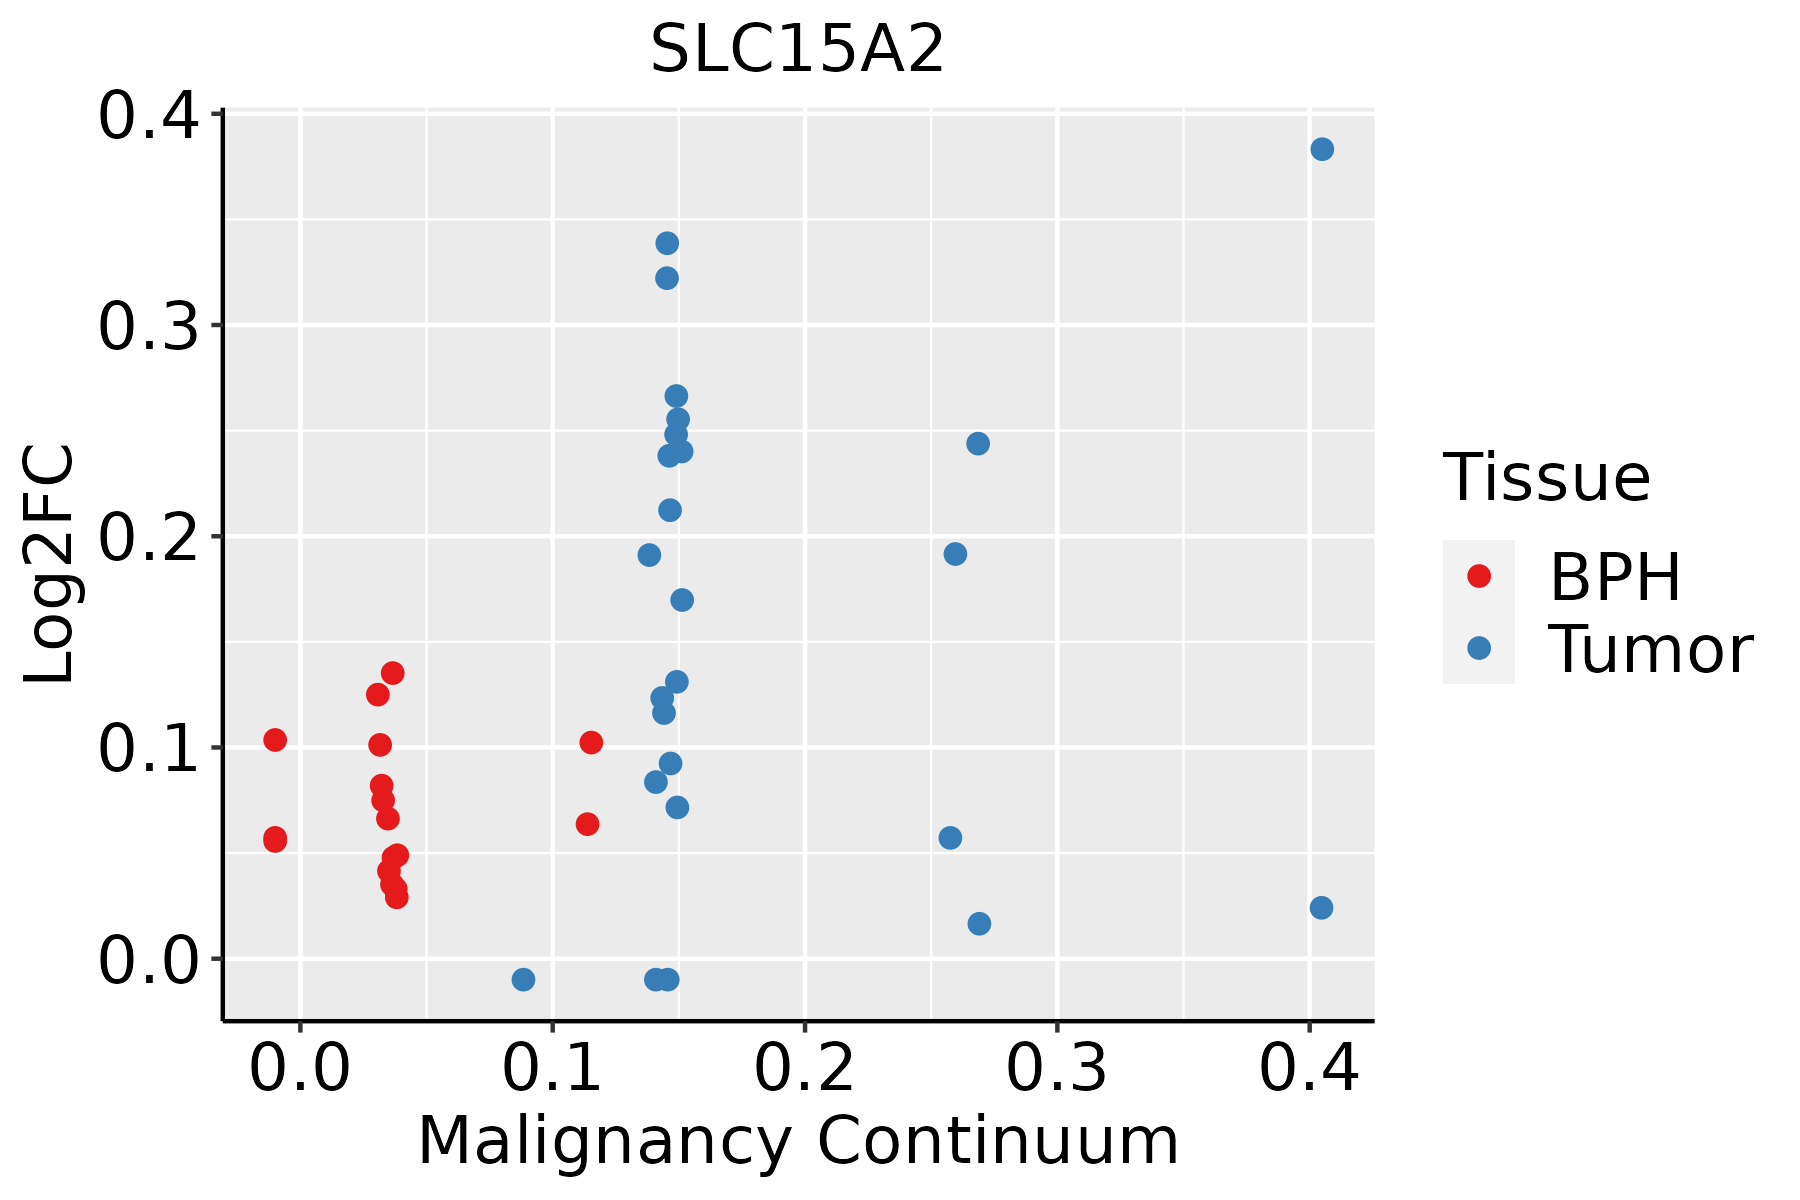 | BPH: Benign Prostatic Hyperplasia |
| ∗log2FC in expression of this searched gene in stem-like cells from each diseased tissue sample relative to stem-like cells in normal samples in each tissue plotted against the malignancy continuum. Samples are colored based on if they are from different disease stage. |
Top |
Malignant transformation related pathway analysis |
| Find out the enriched GO biological processes and KEGG pathways involved in transition from healthy to precancer to cancer |
| Tissue | Disease Stage | Enriched GO biological Processes |
| Colorectum | AD |  |
| Colorectum | SER |  |
| Colorectum | MSS |  |
| Colorectum | MSI-H |  |
| Colorectum | FAP |  |
| ∗Top 15 enriched GO BP terms are showed in the bar plot of each disease state in each tissue. Each row represents a significant GO biological process which is colored according to the -log10(p.adjust). |
| Page: 1 2 3 4 5 6 7 8 9 |
| GO ID | Tissue | Disease Stage | Description | Gene Ratio | Bg Ratio | pvalue | p.adjust | Count |
| GO:003052222 | Liver | HCC | intracellular receptor signaling pathway | 171/7958 | 265/18723 | 3.00e-13 | 1.61e-11 | 171 |
| GO:00027533 | Liver | HCC | cytoplasmic pattern recognition receptor signaling pathway | 46/7958 | 60/18723 | 7.37e-08 | 1.49e-06 | 46 |
| GO:000963622 | Liver | HCC | response to toxic substance | 153/7958 | 262/18723 | 1.37e-07 | 2.58e-06 | 153 |
| GO:00022211 | Liver | HCC | pattern recognition receptor signaling pathway | 107/7958 | 172/18723 | 1.37e-07 | 2.58e-06 | 107 |
| GO:009875412 | Liver | HCC | detoxification | 87/7958 | 152/18723 | 1.70e-04 | 1.35e-03 | 87 |
| GO:19026007 | Liver | HCC | proton transmembrane transport | 87/7958 | 157/18723 | 7.27e-04 | 4.42e-03 | 87 |
| GO:1901264 | Liver | HCC | carbohydrate derivative transport | 48/7958 | 80/18723 | 1.19e-03 | 6.62e-03 | 48 |
| GO:00358726 | Liver | HCC | nucleotide-binding domain, leucine rich repeat containing receptor signaling pathway | 19/7958 | 26/18723 | 1.57e-03 | 8.23e-03 | 19 |
| GO:00704236 | Liver | HCC | nucleotide-binding oligomerization domain containing signaling pathway | 18/7958 | 25/18723 | 2.74e-03 | 1.31e-02 | 18 |
| GO:00622072 | Liver | HCC | regulation of pattern recognition receptor signaling pathway | 59/7958 | 105/18723 | 3.18e-03 | 1.47e-02 | 59 |
| GO:015010411 | Liver | HCC | transport across blood-brain barrier | 50/7958 | 87/18723 | 3.42e-03 | 1.55e-02 | 50 |
| GO:001023211 | Liver | HCC | vascular transport | 50/7958 | 88/18723 | 4.69e-03 | 2.02e-02 | 50 |
| GO:003052218 | Oral cavity | OSCC | intracellular receptor signaling pathway | 149/7305 | 265/18723 | 8.69e-09 | 1.81e-07 | 149 |
| GO:000963618 | Oral cavity | OSCC | response to toxic substance | 137/7305 | 262/18723 | 7.94e-06 | 8.52e-05 | 137 |
| GO:00022214 | Oral cavity | OSCC | pattern recognition receptor signaling pathway | 95/7305 | 172/18723 | 1.11e-05 | 1.15e-04 | 95 |
| GO:00027537 | Oral cavity | OSCC | cytoplasmic pattern recognition receptor signaling pathway | 40/7305 | 60/18723 | 1.32e-05 | 1.33e-04 | 40 |
| GO:00358729 | Oral cavity | OSCC | nucleotide-binding domain, leucine rich repeat containing receptor signaling pathway | 18/7305 | 26/18723 | 1.75e-03 | 8.28e-03 | 18 |
| GO:00622076 | Oral cavity | OSCC | regulation of pattern recognition receptor signaling pathway | 56/7305 | 105/18723 | 1.99e-03 | 9.23e-03 | 56 |
| GO:19012642 | Oral cavity | OSCC | carbohydrate derivative transport | 44/7305 | 80/18723 | 2.67e-03 | 1.16e-02 | 44 |
| GO:00027646 | Oral cavity | OSCC | immune response-regulating signaling pathway | 212/7305 | 468/18723 | 2.93e-03 | 1.27e-02 | 212 |
| Page: 1 2 |
| Pathway ID | Tissue | Disease Stage | Description | Gene Ratio | Bg Ratio | pvalue | p.adjust | qvalue | Count |
| Page: 1 |
Top |
Cell-cell communication analysis |
| Identification of potential cell-cell interactions between two cell types and their ligand-receptor pairs for different disease states |
| Ligand | Receptor | LRpair | Pathway | Tissue | Disease Stage |
| Page: 1 |
Top |
Single-cell gene regulatory network inference analysis |
| Find out the significant the regulons (TFs) and the target genes of each regulon across cell types for different disease states |
| TF | Cell Type | Tissue | Disease Stage | Target Gene | RSS | Regulon Activity |
| ∗The dot plots of a searched regulon are shown for all cell subpopulations in each disease state of each tissue based on the regulon specific score inferred using pySCENIC and by calculating the average expression. |
| Page: 1 |
Top |
Somatic mutation of malignant transformation related genes |
| Annotation of somatic variants for genes involved in malignant transformation |
| Hugo Symbol | Variant Class | Variant Classification | dbSNP RS | HGVSc | HGVSp | HGVSp Short | SWISSPROT | BIOTYPE | SIFT | PolyPhen | Tumor Sample Barcode | Tissue | Histology | Sex | Age | Stage | Therapy Types | Drugs | Outcome |
| SLC15A2 | SNV | Missense_Mutation | c.1646N>C | p.Arg549Thr | p.R549T | Q16348 | protein_coding | tolerated(0.77) | benign(0) | TCGA-AC-A23H-01 | Breast | breast invasive carcinoma | Female | >=65 | I/II | Unknown | Unknown | PD | |
| SLC15A2 | SNV | Missense_Mutation | novel | c.1873N>C | p.Phe625Leu | p.F625L | Q16348 | protein_coding | tolerated(0.06) | possibly_damaging(0.742) | TCGA-AN-A046-01 | Breast | breast invasive carcinoma | Female | >=65 | I/II | Unknown | Unknown | SD |
| SLC15A2 | SNV | Missense_Mutation | rs368822521 | c.2020N>A | p.Glu674Lys | p.E674K | Q16348 | protein_coding | deleterious(0) | probably_damaging(0.931) | TCGA-BH-A0HF-01 | Breast | breast invasive carcinoma | Female | >=65 | I/II | Hormone Therapy | arimidex | SD |
| SLC15A2 | SNV | Missense_Mutation | c.1804C>G | p.Pro602Ala | p.P602A | Q16348 | protein_coding | tolerated(0.4) | benign(0.003) | TCGA-EW-A1PB-01 | Breast | breast invasive carcinoma | Female | >=65 | III/IV | Unknown | Unknown | SD | |
| SLC15A2 | SNV | Missense_Mutation | novel | c.232A>G | p.Asn78Asp | p.N78D | Q16348 | protein_coding | tolerated(1) | benign(0) | TCGA-S3-AA10-01 | Breast | breast invasive carcinoma | Female | >=65 | I/II | Chemotherapy | cytoxan | CR |
| SLC15A2 | SNV | Missense_Mutation | novel | c.1393N>G | p.His465Asp | p.H465D | Q16348 | protein_coding | tolerated(0.64) | benign(0.001) | TCGA-C5-A7UI-01 | Cervix | cervical & endocervical cancer | Female | <65 | I/II | Unknown | Unknown | SD |
| SLC15A2 | SNV | Missense_Mutation | c.437C>T | p.Ser146Leu | p.S146L | Q16348 | protein_coding | deleterious(0) | benign(0.183) | TCGA-IR-A3LA-01 | Cervix | cervical & endocervical cancer | Female | <65 | I/II | Chemotherapy | cisplatin | CR | |
| SLC15A2 | SNV | Missense_Mutation | rs372532662 | c.1549N>A | p.Val517Met | p.V517M | Q16348 | protein_coding | deleterious(0.04) | benign(0.042) | TCGA-A6-3808-01 | Colorectum | colon adenocarcinoma | Male | >=65 | I/II | Unknown | Unknown | SD |
| SLC15A2 | SNV | Missense_Mutation | c.1904N>A | p.Ser635Tyr | p.S635Y | Q16348 | protein_coding | deleterious(0) | probably_damaging(0.966) | TCGA-AA-3510-01 | Colorectum | colon adenocarcinoma | Male | >=65 | I/II | Unknown | Unknown | SD | |
| SLC15A2 | SNV | Missense_Mutation | rs771680786 | c.1181N>T | p.Ala394Val | p.A394V | Q16348 | protein_coding | deleterious(0.01) | possibly_damaging(0.554) | TCGA-AA-3864-01 | Colorectum | colon adenocarcinoma | Male | >=65 | I/II | Unknown | Unknown | SD |
| Page: 1 2 3 4 5 6 7 8 9 |
Top |
Related drugs of malignant transformation related genes |
| Identification of chemicals and drugs interact with genes involved in malignant transfromation |
| (DGIdb 4.0) |
| Entrez ID | Symbol | Category | Interaction Types | Drug Claim Name | Drug Name | PMIDs |
| 6565 | SLC15A2 | TRANSPORTER, DRUGGABLE GENOME | 178101375 | |||
| 6565 | SLC15A2 | TRANSPORTER, DRUGGABLE GENOME | 178101319 | |||
| 6565 | SLC15A2 | TRANSPORTER, DRUGGABLE GENOME | inhibitor | 178101226 | ||
| 6565 | SLC15A2 | TRANSPORTER, DRUGGABLE GENOME | 178101217 | |||
| 6565 | SLC15A2 | TRANSPORTER, DRUGGABLE GENOME | sorafenib | SORAFENIB | ||
| 6565 | SLC15A2 | TRANSPORTER, DRUGGABLE GENOME | inhibitor | 178101227 |
| Page: 1 |

Copyright 2023-Present -The University of Texas Health Science Center at Houston |